
| REPORT ATTRIBUTE | DETAILS |
|---|---|
| Historical Period | 2020-2023 |
| Base Year | 2024 |
| Forecast Period | 2025-2032 |
| Sports Protective Equipment Market Size 2024 | USD 7,634.0 Million |
| Sports Protective Equipment Market, CAGR | 5.30% |
| Sports Protective Equipment Market Size 2032 | USD 11,539.3 Million |
Market Overview
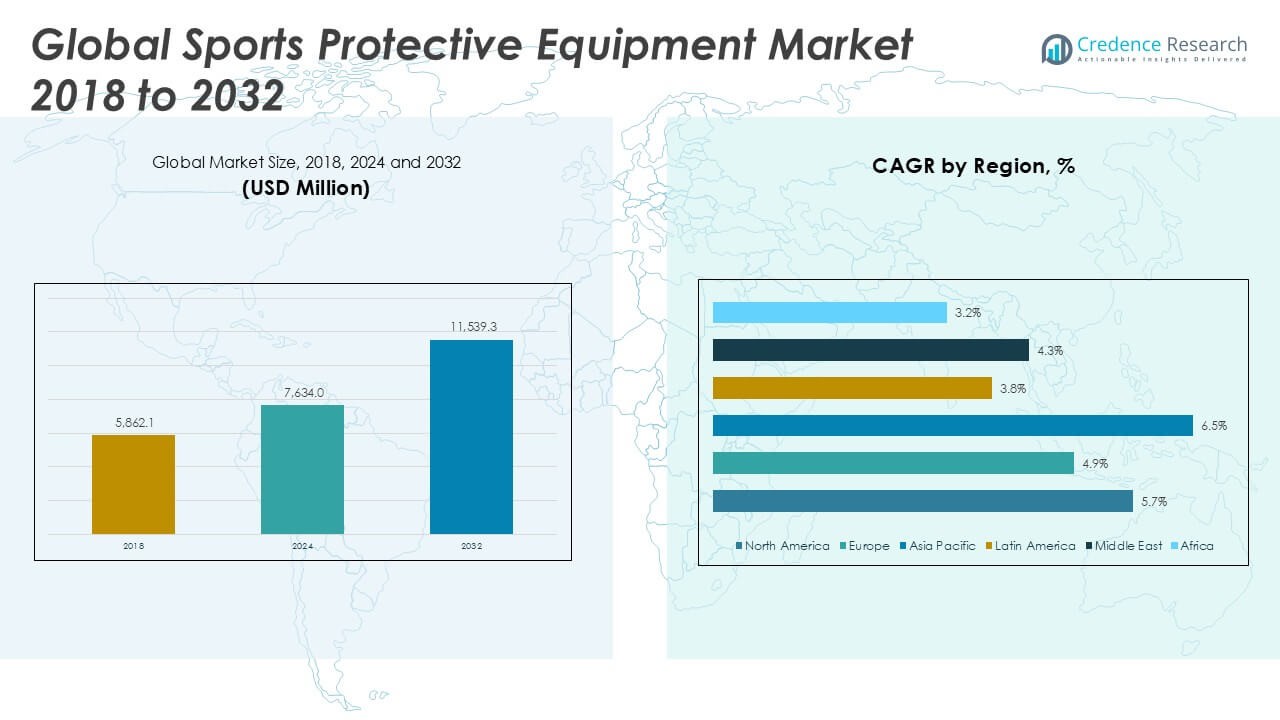
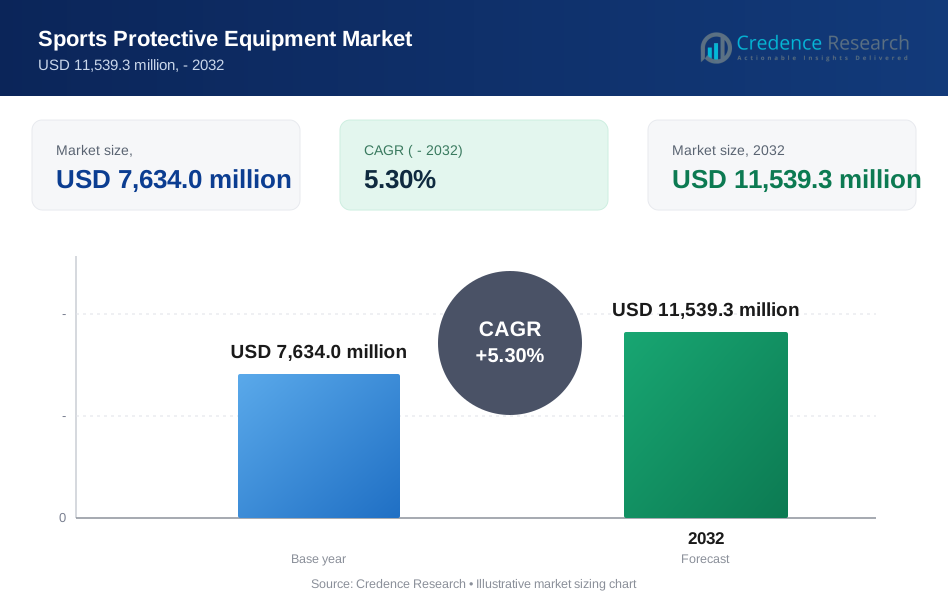
The Global Sports Protective Equipment Market is projected to grow from USD 7,634.0 million in 2024 to an estimated USD 11,539.3 million based on 2032, with a compound annual growth rate (CAGR) of 5.30% from 2025 to 2032.
Rising awareness of injury prevention drives demand for advanced protective equipment across youth, amateur and professional segments. Athletes and parents prioritize head, joint and torso protection, prompting brands to develop customizable fittings and performance-monitoring sensors. Growth in organized sports leagues, school-level competitions and recreational events further fuels uptake. Sustainability initiatives encourage the use of recyclable materials and eco-friendly manufacturing processes. Digital marketing platforms and e-commerce channels accelerate product reach, enabling direct-to-consumer engagement and personalized offerings.
North America leads with over 35% market share, supported by high sports participation rates and stringent safety regulations in the United States and Canada. Europe follows, driven by football, rugby and winter sports in Germany, the UK and Scandinavian countries. Asia Pacific exhibits the fastest growth, fueled by expanding middle-class incomes and government investments in sports infrastructure across China, India and Japan. Key players include Nike, Inc.; Adidas AG; Under Armour, Inc.; Bauer Hockey; and Rawlings Sporting Goods Company, Inc. These companies maintain competitive positioning through strategic partnerships, regional distribution networks and continuous R&D in material science.
Market Insights
- The Global Sports Protective Equipment Market will grow from USD 7,634.0 million in 2024 to USD 11,539.3 million by 2032 at a 5.30% CAGR.
- Heightened safety awareness among athletes and parents boosts demand for impact-resistant helmets, pads and guards.
- Integration of sensor modules and custom-fit solutions enhances product differentiation and performance monitoring.
- High material costs and stringent certification requirements constrain pricing flexibility and margin expansion.
- Fragmented regulatory standards across regions complicate product approvals and slow market entry.
- North America commands over 35% share, driven by strict safety mandates and established distribution networks.
- Asia Pacific delivers the fastest growth at a 6.5% CAGR, supported by rising disposable incomes and government sports infrastructure investments.
Market Drivers
Increasing Participation in Organized and Recreational Sports
The Global Sports Protective Equipment Market benefits from rising participation in sports across demographics. Consumers invest in safety gear for school leagues, amateur tournaments and professional events. It supports demand for helmets, pads and guards tailored to different age groups. Youth programs expand rapidly, driving equipment adoption at earlier stages. Professionals demand customized solutions for high-impact activities. It spurs growth in local and regional supplier networks. Manufacturers respond by scaling production to meet diverse needs.
- For instance, the National Federation of State High School Associations (NFHS) reported a record 8,062,302 participants in high school sports during the 2023–24 school year, highlighting the surge in demand for protective equipment across youth and school sports programs
Advancements in Material Technology and Equipment Design
The Global Sports Protective Equipment Market attracts investment in advanced composites and smart fabrics. It leverages lightweight foams and carbon-fiber blends to deliver superior shock absorption. Brands integrate sensor modules that offer real-time performance feedback and injury-risk alerts. It reduces fatigue and boosts athlete confidence during training and competition. Researchers explore bio-based polymers that align with sustainability goals. It drives collaboration between material scientists and equipment engineers. Product differentiation remains central to competitive strategy.
- For instance, at the Tokyo 2020 Summer Olympic Games, wearable sensor technologies were implemented to provide real-time data on athlete health and performance, with multiple companies deploying hundreds of smart devices to monitor environmental and physiological metrics during competition
Heightened Safety Regulations and Consumer Awareness
The Global Sports Protective Equipment Market responds to stricter standards set by sports authorities and insurance bodies. It meets certification requirements for impact tests and compression thresholds. Regulatory mandates enforce helmet use in various disciplines, enhancing protective gear uptake. It raises consumer trust in certified products. Public health campaigns emphasize concussion prevention and joint protection protocols. It strengthens brand reputations and drives purchase intent. Stakeholders align processes with best practices to ensure compliance.
Expansion of E-Commerce Channels and Direct-to-Consumer Strategies
The Global Sports Protective Equipment Market taps into online retail growth and social media engagement. It offers direct-to-consumer ordering alongside virtual fitting tools that improve accuracy. Omnichannel approaches blend digital catalogs with local pick-up options. It reduces lead times and broadens geographic reach. Retailers introduce subscription services for replacement pads and liners. It encourages repeat purchases and fosters long-term loyalty. Logistics optimizations support reliable, timely deliveries.
Market Trends
Integration of Smart Technologies and Sensor-Enabled Gear
The Global Sports Protective Equipment Market embraces sensor-enabled helmets and pads that monitor impact force in real time. It delivers data to clinicians and coaches to evaluate athlete safety. It reduces injury risk by alerting users to excessive strain. Developers embed microchips and Bluetooth modules for seamless connectivity. It demands battery longevity and data security. Manufacturers partner with tech firms to refine algorithms for threshold detection. It expands product value through actionable insights.
- For instance, the U.S. market for Bluetooth helmet communication systems serves a base of over 8,000,000 registered motorcycles, highlighting the scale of sensor-enabled helmet adoption for enhanced safety and connectivity in sports and recreational activities
Demand for Personalized Fit and Custom Protective Solutions
The Global Sports Protective Equipment Market shifts toward bespoke gear tailored to individual anatomy. It employs 3D scanning and molding to achieve precise fit. It increases comfort and compliance during extended play. Brands offer modular padding kits and adjustable straps to adapt to varied sport requirements. It leverages digital design studios for rapid prototyping. It emphasizes user feedback loops to refine iterations. It builds loyalty through differentiated experiences.
- For instance, in 2021, sports and fitness participation among Americans reached 232,600,000, the highest in five years, fueling demand for custom-fit and personalized protective equipment as reported by the Sports & Fitness Industry Association
Adoption of Sustainable Materials and Eco-Friendly Manufacturing
The Global Sports Protective Equipment Market prioritizes recycled polymers and bio-based composites in product lines. It reduces carbon footprint through energy-efficient production techniques. It sources hemp and bamboo fibers for padding structures to lower environmental impact. Suppliers implement closed-loop recycling for end-of-life gear. It addresses consumer demand for green credentials and ethical sourcing. It reports environmental metrics in annual sustainability statements. It drives collaboration among material scientists and production engineers.
Evolution of Digital Platforms and Virtual Trial Experiences
The Global Sports Protective Equipment Market leverages augmented reality apps that simulate gear fit in virtual environments. It boosts online conversion rates and cuts return shipments. It integrates AI-driven recommendation engines to suggest optimal protection levels. It supports omnichannel retail models that sync inventory across web and store outlets. It employs chatbots to guide users through product selection. It streamlines checkout through one-click and mobile wallets. It fosters engagement through interactive tutorials and maintenance reminders.
Market Challenges
Balancing Cost Constraints with Performance and Material Quality
The Global Sports Protective Equipment Market faces pressure to offer high-performance gear at competitive prices. It must source advanced materials that meet impact resistance standards without inflating production costs. It negotiates with suppliers to secure bulk discounts on foams, composites and sensor components. It implements lean manufacturing techniques to reduce waste and improve throughput. It balances inventory levels to avoid stockouts and minimize holding expenses. It trains production teams to maintain quality control across diverse product lines. It monitors raw-material price fluctuations to adjust pricing strategies proactively.
- For instance, in 2023, the men’s segment generated revenue of $4.4 billion, while the ball-based sports segment alone accounted for $2.5 billion, highlighting the scale of inventory and production management required to serve high-demand categories in this market
Navigating Regulatory Diversity and Complex Distribution Networks
The Global Sports Protective Equipment Market contends with varied safety regulations and certification requirements across regions. It aligns product designs with differing impact test protocols in North America, Europe and Asia Pacific. It manages multiple approval processes, from CE marking to ASTM standards, to access key markets. It streamlines logistics to serve retailers, specialized sports stores and e-commerce platforms efficiently. It integrates compliance checks into supply-chain operations to avoid shipment delays. It collaborates with legal experts to interpret evolving rules and update product documentation. It invests in training for sales and distribution partners to ensure accurate representation of certified features.
Market Opportunities
Rising Participation in Youth, Collegiate and Amateur Sports Programs
The Global Sports Protective Equipment Market benefits from expanding school and community sports initiatives that emphasize athlete safety. It delivers tailored solutions for helmets, guards and pads to meet program-specific requirements. It taps partnerships with educational institutions and local leagues to showcase product performance. It leverages certification endorsements from governing bodies to build trust among coaches and parents. It develops entry-level equipment bundles that appeal to budget-conscious consumers. It supports training workshops and safety clinics to reinforce proper usage. It positions brand ambassadors and program sponsors to strengthen market presence.
Growth Potential in Emerging Economies and Digital Retail Channels
The Global Sports Protective Equipment Market gains traction in regions with rising disposable incomes and government investment in sports infrastructure. It enters new territories through localized distribution agreements and joint ventures. It integrates online platforms that offer virtual fitting tools and real-time customer support. It expands direct-to-consumer models to reduce intermediary margins and enhance margins. It collaborates with e-sports and fitness influencers to reach tech-savvy audiences. It introduces subscription services for consumable liners and replacement parts. It tracks regional sales data to refine market entry strategies.
Market Segmentation Analysis
By Product
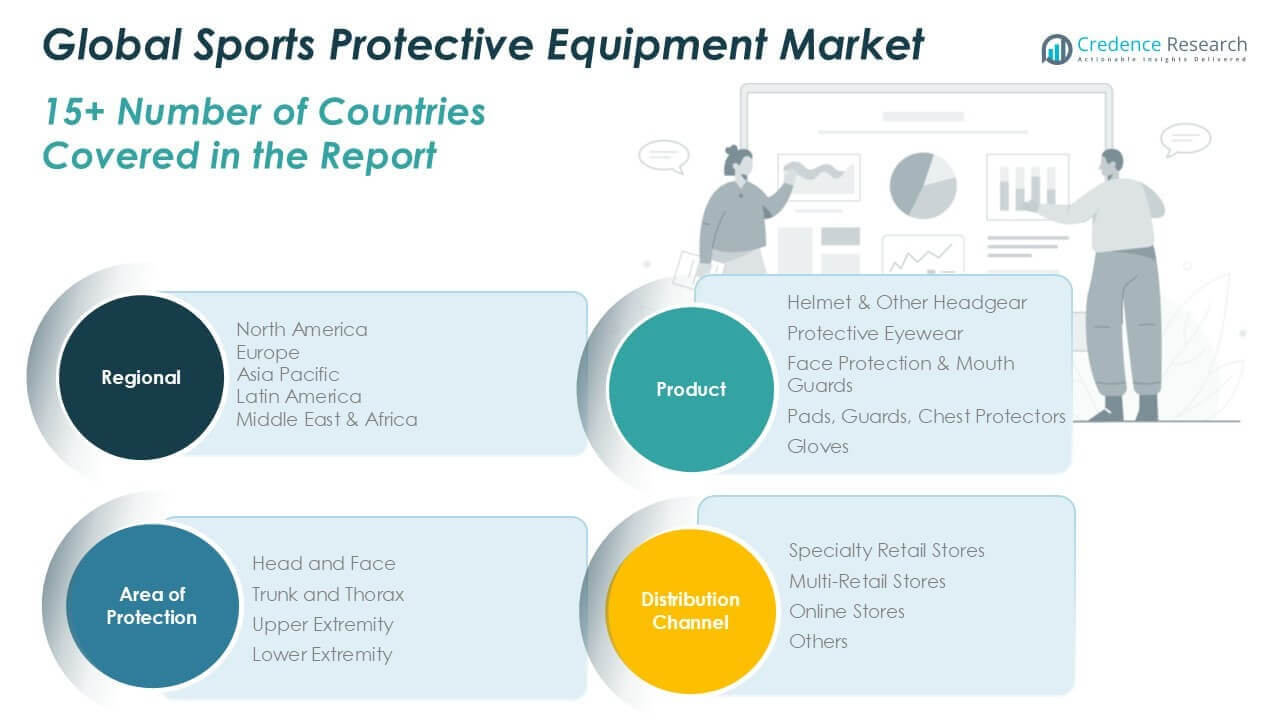
The Global Sports Protective Equipment Market divides product offerings into helmets & other headgear, protective eyewear, face protection & mouth guards, pads, guards & chest protectors, and gloves. It evaluates both volume share and revenue share across these categories. Helmets command a leading position based on safety regulations and consumer preference for impact resistance. Protective eyewear sees growth through integration of anti-fog and UV-blocking technologies. Face guards and mouth guards gain traction in contact sports, while padded chest protectors address female athlete safety needs. Gloves maintain steady demand across baseball, cycling and combat sports.
- For instance, company and industry data show that in 2023, the helmets and headgear segment accounted for approximately 46% of all sports protective equipment units sold globally, reflecting the dominance of head protection in the market
By Area of Protection
The Global Sports Protective Equipment Market segments protection by head and face, trunk and thorax, upper extremity, and lower extremity. It assesses volume and revenue contributions for each area. Head and face protection lead due to high concussion awareness and helmet mandates in youth and professional leagues. Trunk and thorax gear, including rib and spine protectors, grows with extreme sports participation. Upper-extremity covers elbow and wrist guards popular in skating and racket sports. Lower-extremity supports knee and shin guards vital for football, field hockey and skiing.
- For instance, government and industry surveys report that in 2023, over 90 million units of head and face protective equipment were distributed worldwide, surpassing all other protection areas in volume
By Distribution Channel
The Global Sports Protective Equipment Market distributes through specialty retail stores, multi-retail outlets, online stores, and other channels such as team dealers and schools. It measures channel performance by volume and revenue share. Specialty stores deliver expert fittings and personalized service. Multi-retail outlets leverage brand recognition and promotional events. Online platforms drive convenience with virtual fitting tools and subscription models for consumable liners. Other channels focus on bulk institutional sales to sports academies and league sponsors.
Segments
Based on Product
- Helmet & Other Headgear
- Protective Eyewear
- Face Protection & Mouth Guards
- Pads, Guards, Chest Protectors
- Gloves
Based on Area of Protection
- Head and Face
- Trunk and Thorax
- Upper Extremity
- Lower Extremity
Based on Distribution Channel
- Specialty Retail Stores
- Multi-Retail Stores
- Online Stores
- Others
Based on Region
- North America
- U.S.
- Canada
- Mexico
- Europe
- UK
- France
- Germany
- Italy
- Spain
- Russia
- Belgium
- Netherlands
- Austria
- Sweden
- Poland
- Denmark
- Switzerland
- Rest of Europe
- Asia Pacific
- China
- Japan
- South Korea
- India
- Australia
- Thailand
- Indonesia
- Vietnam
- Malaysia
- Philippines
- Taiwan
- Rest of Asia Pacific
- Latin America
- Brazil
- Argentina
- Peru
- Chile
- Colombia
- Rest of Latin America
- Middle East
- UAE
- KSA
- Israel
- Turkey
- Iran
- Rest of Middle East
- Africa
- Egypt
- Nigeria
- Algeria
- Morocco
- Rest of Africa
Regional Analysis
North America Sports Protective Equipment Market
North America generated USD 2,687.2 million in 2024, representing 35.2% of the global market. It is forecast to reach USD 3,784.9 million by 2032 at a CAGR of 5.7%. Strong youth and collegiate sports programs drive demand for helmets and padding. It benefits from rigorous safety standards enforced by governing bodies. High consumer spending supports premium and sensor-equipped products. It leverages robust distribution through specialty retailers and e-commerce platforms. Strategic partnerships with professional leagues reinforce brand visibility.
Europe Sports Protective Equipment Market
Europe recorded USD 2,107.0 million in 2024, accounting for 27.6% of the global total. It will climb to USD 3,057.9 million by 2032 with a 4.9% CAGR. Football, rugby and winter sports sustain steady demand for head and body protection. It capitalizes on strict CE certifications and national safety mandates. Growth in female participation fuels demand for chest protectors and mouth guards. It strengthens market presence via localized production and R\&D centers. Retailer networks in Germany, the UK and France ensure widespread availability.
Asia Pacific Sports Protective Equipment Market
Asia Pacific generated USD 1,633.7 million in 2024, or 21.4% of global share. It will reach USD 2,850.2 million by 2032 at 6.5% CAGR. Government investments in sports infrastructure boost amateur and professional leagues. It taps rising middle-class incomes and growing health awareness. Local manufacturers introduce cost-effective gear tailored for cricket, badminton and basketball. It expands online sales with virtual fitting tools to overcome logistical challenges. Brand collaborations with national federations enhance credibility.
Latin America Sports Protective Equipment Market
Latin America delivered USD 465.7 million in 2024, equivalent to 6.1% of the global market. It is projected to hit USD 738.5 million by 2032 at a CAGR of 3.8%. Growing interest in football and cycling underpins equipment uptake. It addresses price sensitivity through value-pack offerings. Emerging retail chains and e-commerce sites widen distribution. It builds awareness through school safety programs and league sponsorships. Local partnerships with sports academies reinforce market penetration.
Middle East Sports Protective Equipment Market
Middle East achieved USD 381.7 million in 2024, or 5.0% of the worldwide market. It will advance to USD 634.7 million by 2032 at 4.3% CAGR. It leverages rapid urbanization and rising youth participation in team sports. Consumers seek heat-resistant materials for desert climates. It grows through mall-based sports outlets and online platforms. Local certification bodies endorse safety equipment standards. Partnerships with regional sporting events boost brand exposure.
Africa Sports Protective Equipment Market
Africa posted USD 358.8 million in 2024, capturing 4.7% of global demand. It is set to grow to USD 473.1 million by 2032 at a CAGR of 3.2%. It benefits from expansion of school sports and grassroots programs. Limited disposable income drives demand for entry-level gear. It extends reach through mobile marketplaces and community clinics. Local NGOs and federations promote protective-gear adoption. Training workshops reinforce correct usage and build consumer trust.
Key players
- Nike Inc
- Adidas AG
- Under Armour, Inc
- Bauer Hockey LLC
- BRG Sports (now part of Vista Outdoor)
- Xenith, LLC
- Riddell, Inc.
- Warrior Sports (subsidiary of New Balance)
- McDavid Inc.
- Shock Doctor, Inc.
- Franklin Sports, Inc.
- Grays of Cambridge (International) Ltd.
- PUMA SE.
- ASICS Corporation
Competitive Analysis
Market leaders leverage strong brand equity and extensive R\&D to maintain dominance in the Global Sports Protective Equipment Market. Nike and Adidas compete through integrated technology platforms and premium material partnerships. Under Armour differentiates with lightweight composites and targeted athlete endorsements. Riddell and Bauer Hockey focus on sport-specific innovations in helmet safety and impact sensors. PUMA and ASICS expand geographic reach via localized manufacturing and tailored product lines. Emerging players such as Xenith and Shock Doctor carve niches in sensor-enabled and customizable gear. It places pressure on established brands to accelerate product cycles and refine cost structures. Direct-to-consumer channels intensify competition, forcing all firms to enhance e-commerce capabilities and after-sales support. Strategic alliances with sports federations and academic research centers further strengthen competitive positioning across regions.
Recent Developments
- In April 2025, Under Armour, Inc. partnered again with Kelsey Plum’s “Dawg Class” women's basketball camp, continuing its focus on mentorship and athlete development through specialized sports gear
- In December 2024, Nike and the NFL extended their partnership for another 10 years, with a key focus on global expansion and enhanced player health and safety. The collaboration will leverage Nike's research and design expertise to improve cleat design, aiming to reduce lower extremity injuries and enhance overall player well-being.
Market Concentration and Characteristics
The Global Sports Protective Equipment Market displays moderate concentration, with leading brands holding over 60% of total revenue while numerous regional and niche players share the remainder. It features high entry barriers due to stringent safety certifications and significant R&D investments in materials and sensor integration. It demands specialized manufacturing capabilities and compliance with diverse regulatory protocols across regions. Competition centers on product innovation, quality assurance and brand credibility. It favors firms that secure endorsement from professional leagues and governing bodies. It rewards scale advantages in distribution and marketing, yet offers growth opportunities for agile companies that target emerging sports and customization trends.
Report Coverage
The research report offers an in-depth analysis based on Product, Area of Protection, Distribution Channel and Region. It details leading market players, providing an overview of their business, product offerings, investments, revenue streams, and key applications. Additionally, the report includes insights into the competitive environment, SWOT analysis, current market trends, as well as the primary drivers and constraints. Furthermore, it discusses various factors that have driven market expansion in recent years. The report also explores market dynamics, regulatory scenarios, and technological advancements that are shaping the industry. It assesses the impact of external factors and global economic changes on market growth. Lastly, it provides strategic recommendations for new entrants and established companies to navigate the complexities of the market.
Future Outlook
- Manufacturers will integrate advanced sensors and IoT connectivity to deliver real-time impact analysis and health metrics. Athletes and coaches will leverage this data to optimize training and minimize injury risk.
- 3D scanning and rapid prototyping will enable tailored fits for helmets, pads and guards, improving comfort and compliance. Brands will offer on-demand modifications to suit individual preferences and sport-specific requirements.
- Designers will develop chest protectors and headgear that address female anatomy and biomechanics. Market leaders will partner with female athletes to validate performance and fit.
- It will shift toward bio-based polymers and post-consumer recycled composites to reduce environmental impact. Companies will publish lifecycle assessments to demonstrate green credentials.
- Cloud-based platforms will analyze usage patterns and historical impact data to forecast injury likelihood. Teams and medical staff will use predictive alerts to adjust training loads.
- Brands will offer monthly plans for replaceable liners, sensor modules and seasonal gear. Consumers will benefit from predictable costs and timely equipment upgrades.
- It will address protective needs in growing segments like skateboarding, parkour and virtual-reality gaming. Specialized soft-shell and impact-attenuating solutions will gain traction.
- E-commerce platforms will feature virtual fitting tools and personalized recommendation engines. Brands will enhance loyalty through online communities and exclusive member benefits.
- Sports medicine clinics and physiotherapists will integrate equipment data into rehabilitation protocols. Cross-sector partnerships will validate product efficacy and drive adoption.
- International bodies will work toward unified safety certifications and testing protocols. Manufacturers will streamline development cycles and reduce time-to-market for new innovations.
Request a Free Sample
Fill in your details and we'll send you a free sample report.
- Sample data tables & charts
- Research methodology
Need a Custom Version of This Report?
Tailor the scope, geography, or segments to your exact requirements.
- Custom geography or segment scope
- Direct access to our analyst team
Frequently Asked Questions
What was the market size in 2023, and what are the projections for 2032 and the CAGR?
What key factors drive market expansion?
How do technological innovations shape product development?
Which regions lead the market and why?
Who are the dominant players and how do they stay competitive?
Table of Content
Chapter 1. Report Introduction
- 1.1 Report Description & Purpose
- 1.1.1 Report Title & Market Definition
- 1.1.2 Unique Selling Propositions (USP) & Key Differentiators
- 1.1.3 Value Proposition for Stakeholders
- 1.2 Research Objectives
- 1.2.1 Market Sizing Objectives (Volume & Revenue)
- 1.2.2 Segmentation Objectives
- 1.2.3 Competitive Intelligence Objectives
- 1.2.4 Forecast & Scenario Objectives
- 1.3 Report Scope
- 1.3.1 Sports Protective Equipment Scope – Types & Subtypes Covered
- 1.3.2 Geographic Scope – Regions & Countries Covered
- 1.3.3 Historical Period, Base Year & Forecast Period (the historical period; forecast to 2032)
- 1.3.4 Inclusions & Exclusions
- 1.4 HS Code & Classification Framework
- 1.5 Currency, Units & Pricing Basis
- 1.6 Target Stakeholders
- 1.7 Limitations & Assumptions
Chapter 2. Executive Summary
- 2.1 Global Sports Protective Equipment Market Snapshot
- 2.1.1 Market Size – Historical (the historical period) & Forecast (2032) (base year: USD 7,634.0 million → 2032: USD 11,539.3 million)
- 2.1.2 Volume & Revenue – Global Totals
- 2.1.3 Key Market Highlights – Top Five Facts
- 2.2 Sports Protective Equipment Market Segmentation Snapshot
- 2.2.1 Market Split by Region – vs. 2032
- 2.3 Competitive Snapshot
- 2.3.1 Top 10 Players by Revenue Share –
- 2.3.2 Top 10 Players by Volume Share –
- 2.3.3 Recent Strategic Developments (18-Month Summary)
- 2.4 Key Investment Highlights & Strategic Conclusions
Chapter 3. Sports Protective Equipment Market Dynamics & Industry Analysis
- 3.1 Market Overview & Context
- 3.1.1 Sports Protective Equipment Market Position in the Broader Automotive Value Chain
- 3.1.2 OEM vs. Replacement Market Dynamics
- 3.1.3 Market Maturity & Development Stage by Region
- 3.2 Sports Protective Equipment Market Drivers
- 3.3 Sports Protective Equipment Market Restraints & Challenges
- 3.4 Sports Protective Equipment Market Opportunities
- 3.5 Porter's Five Forces Analysis
- 3.5.1 Threat of New Entrants
- 3.5.2 Bargaining Power of Suppliers
- 3.5.3 Bargaining Power of Buyers
- 3.5.4 Threat of Substitutes
- 3.5.5 Competitive Rivalry – Intensity Assessment
- 3.6 Sports Protective Equipment Value Chain Analysis
- 3.6.1 Upstream – Raw Material/Input Suppliers
- 3.6.1.1 Raw Material/Input 1
- 3.6.1.2 Raw Material/Input 2
- 3.6.1.3 Raw Material/Input 3
- 3.6.2 Midstream – Production/Manufacturing/Service Delivery
- 3.6.2.1 Production/Process Overview
- 3.6.2.2 Key Facility Locations & Capacity by Manufacturer
- 3.6.3 Downstream – Distribution & End Consumer
- 3.6.3.1 Primary Channel – B2B/OEM
- 3.6.3.2 Secondary Channels – Dealer, Retail, Online, Direct
- 3.6.4 Value Chain Profitability Analysis
- 3.6.1 Upstream – Raw Material/Input Suppliers
- 3.7 PESTEL Analysis
- 3.7.1 Political Factors
- 3.7.2 Economic Factors
- 3.7.3 Social Factors
- 3.7.4 Technological Factors
- 3.7.5 Environmental Factors
- 3.7.6 Legal Factors
- 3.8 Sports Protective Equipment Supply Chain Analysis
- 3.8.1 Raw Material/Input Supply Risk Assessment
- 3.8.2 Manufacturing Concentration Risk (Geographic Exposure)
- 3.8.3 Trade Disruption Impact Analysis
- 3.9 Regulatory & Policy Landscape
Note: The regulatory and policy landscape section covers regulations based on their applicability to the market, Sports Protective Equipment category, geography, and scope of the study. Only regulatory frameworks with a material impact on operations, compliance, trade, sustainability, or market access are analyzed in detail.
Chapter 4. Key Investment Pockets & Opportunity Analysis
- 4.1 Sports Protective Equipment Market Attractiveness Analysis
- 4.1.1 By Region – Investment Attractiveness Matrix (Volume × CAGR)
- 4.2 Absolute Revenue Growth Opportunity
- 4.2.1 By Region – Absolute USD Growth Through 2032
- 4.3 Incremental Volume Opportunity
- 4.3.1 By Region – Incremental Volume Through 2032
- 4.3.2 Segment – Incremental Volume
- 4.4 Emerging Submarket Opportunity Deep Dive (Subject to Applicability)
- 4.5 Emerging Market Opportunity Scorecards
- 4.5.1 United States
- 4.5.2 Europe
- 4.5.3 Asia
- 4.5.4 Middle East & Africa
Note: Emerging Market Opportunity Scorecards will be included based on relevance and strategic importance. Regions listed are indicative and may vary depending on data availability and market dynamics.
Chapter 5. Sports Protective Equipment Import-Export Analysis & Trade Flows
- 5.1 Global Trade Overview
- 5.1.1 Global Export Value by Country (the historical period)
- 5.1.2 Global Export Volume by Country (the historical period)
- 5.1.3 Global Import Value by Country (the historical period)
- 5.1.4 Global Import Volume by Country (the historical period)
- 5.1.5 Net Trade Balance by Country (the historical period)
- 5.2 Export Analysis – Segment
- 5.2.1 Type 1 (HS Code)
- 5.2.2 Type 2 (HS Code)
- 5.2.3 Type 3 (HS Code)
- 5.2.4 Type 4 (HS Code)
- 5.2.5 Type 5 (HS Code)
- 5.3 Import Analysis – Segment
- 5.3.1 Type 1 (HS Code)
- 5.3.2 Type 2 (HS Code)
- 5.3.3 Type 3 (HS Code)
- 5.3.4 Type 4 (HS Code)
- 5.3.5 Type 5 (HS Code)
- 5.4 Average Unit Trade Prices
- 5.4.1 Average Export Price – Segment & Country
- 5.4.2 Average Import Price – Segment & Source Country
- 5.4.3 Price Trends (the historical period)
- 5.5 Key Trade Route Analysis
- 5.5.1 Trade Route 1
- 5.5.2 Trade Route 2
- 5.5.3 Trade Route 3
- 5.5.4 Trade Route 4
- 5.5.5 Trade Route 5
- 5.6 Trade Policy Impact Assessment
- 5.6.1 US Anti-Dumping & Section 301 Tariffs
- 5.6.2 EU Customs Union Impact
- 5.6.3 Major Free Trade Agreements
- 5.6.4 USMCA Rules of Origin
Note: Trade policy analysis will be included only where relevant to the Sports Protective Equipment market.
Chapter 6. Competitive Landscape & Company Benchmarking
- 6.1 Sports Protective Equipment Market Concentration & Structure
- 6.1.1 Herfindahl-Hirschman Index (HHI) – vs.
- 6.1.2 Tier 1, Tier 2 & Tier 3 Market Structure
- 6.1.3 Global, Regional & Local Player Dynamics
- 6.2 Sports Protective Equipment Market Share Analysis –
- 6.2.1 Global Revenue Share by Company
- 6.2.2 Global Volume Share by Company
- 6.2.3 Regional Revenue Share
- 6.2.4 Market Share Evolution ( vs. )
- 6.2.5 OEM Segment Share by Company
- 6.2.6 Replacement Segment Share by Company
- 6.3 Production/Delivery Capacity & Facility Analysis
- 6.3.1 Global Installed Capacity
- 6.3.2 Capacity Utilization Rates
- 6.3.3 Production/Output Volume
- 6.3.4 Facility Locations & Capacity Map
- 6.3.5 Planned Capacity Additions
- 6.4 Sports Protective Equipment Competitive Benchmarking Matrix
- 6.4.1 Revenue, Volume, CAGR & Profitability Comparison
- 6.4.2 Channel Revenue Mix
- 6.4.3 Geographic Revenue Exposure
- 6.4.4 R&D Intensity
- 6.4.5 Sustainability Maturity
- 6.5 Strategic Developments in Sports Protective Equipment (Last 24 Months)
- 6.5.1 Mergers, Acquisitions & Divestments
- 6.5.2 New Sports Protective Equipment Launches
- 6.5.3 Facility Expansions
- 6.5.4 Strategic Alliances, Joint Ventures & Partnerships
- 6.5.5 Distribution Expansion & Market Entry
- 6.5.6 Sustainability & ESG Initiatives
- 6.6 Competitive Strategy Mapping
- 6.6.1 Leader, Challenger, Follower & Niche Classification
- 6.6.2 Pricing Strategy Comparison
- 6.6.3 Channel Strategy Matrix
Note: Strategic developments are included based on their materiality and the availability of reliable information.
Chapter 7. Global Sports Protective Equipment Market – By Distribution Channel
- 7.1 Segment Overview
- 7.1.1 Volume & Revenue Split by Channel ( & 2032)
- 7.1.2 Channel Mix Evolution (2032)
Chapter 8. Regional Market Analysis – Global Overview
- 8.1 Global Regional Overview
- 8.1.1 Regional Volume Share
- 8.1.2 Regional Revenue Share
- 8.1.3 Regional Volume by Region
- 8.1.4 Regional Revenue by Region
- 8.1.5 Regional Forecast Through 2032
- 8.2 Cross-Regional Segment Analysis
- 8.2.1 By Distribution Channel
- 8.2.2 By Brand/Price Tier
Chapter 9. North America Sports Protective Equipment Market
- 9.1 United States
- 9.2 Canada
- 9.3 Mexico
Chapter 10. Europe Sports Protective Equipment Market
- 10.1 Germany
- 10.2 France
- 10.3 Italy
- 10.4 United Kingdom
- 10.5 Spain
- 10.6 Poland
- 10.7 Russia
- 10.8 Netherlands
- 10.9 Belgium
- 10.10 Sweden
- 10.11 Denmark
- 10.12 Norway
- 10.13 Rest of Europe
Chapter 11. Asia Pacific Sports Protective Equipment Market
- 11.1 China
- 11.2 India
- 11.3 Japan
- 11.4 South Korea
- 11.5 Thailand
- 11.6 Indonesia
- 11.7 Vietnam
- 11.8 Malaysia
- 11.9 Australia
- 11.10 Rest of Asia Pacific
Chapter 12. Latin America Sports Protective Equipment Market
- 12.1 Brazil
- 12.2 Argentina
- 12.3 Colombia
- 12.4 Chile
- 12.5 Rest of Latin America
Chapter 13. Middle East Sports Protective Equipment Market
- 13.1 Saudi Arabia
- 13.2 United Arab Emirates
- 13.3 Turkey
- 13.4 Israel
- 13.5 Iran
- 13.6 Rest of the Middle East
Chapter 14. Africa Sports Protective Equipment Market
- 14.1 South Africa
- 14.2 Egypt
- 14.3 Nigeria
- 14.4 Morocco
- 14.5 Rest of Africa
Chapter 15. Sports Protective Equipment Company Profiles
- 15.1 [Company 01]
- 15.1.1 Company Overview
- 15.1.2 Key Management Personnel
- 15.1.3 Products & Services Portfolio
- 15.1.4 Financial Performance
- 15.1.5 Key Market Focus & Geographic Presence
- 15.1.6 Recent Developments & Strategic Initiatives
Note: The company profile list is preliminary and may change based on research findings, market developments, data availability, and client requirements.
Chapter 16. Appendices
- Appendix A – List of Abbreviations & Acronyms
- Appendix B – Industry Classification Code Reference – Full Series
- Appendix C – Production & Capacity Data Tables
- Appendix D – End-Use & Demand Base Tables
- Appendix E – Consumption & Replacement Rate Assumptions
- Appendix F – ASP Reference Tables
- Appendix G – Manufacturing & Facility Database
- Appendix H – Import-Export Data Tables
- Appendix I – Regulatory Summary Tables
- Appendix J – Primary Research Participant List (Anonymized)
- Appendix K – Primary Research Questionnaire Framework
- Appendix L – Data Sources & Bibliography
- Appendix M – Market Size Divergence & Source Comparison
Chapter 17. Research Methodology
- 17.1 Research Framework & Philosophy
- 17.2 Secondary Research – Sources, Hierarchy & Data Extraction
- 17.3 Data Modeling – Bottom-Up & Top-Down Market Sizing
- 17.4 Primary Research – Stakeholder Framework, LOI & Sample Sizes
- 17.5 Forecast Methodology – Regression, Scenario & Sensitivity Analysis
- 17.6 Quality Control – Four-Layer Validation Framework
- 17.7 Limitations & Standard Assumptions
- 17.8 Disclaimer
