
Market Overview
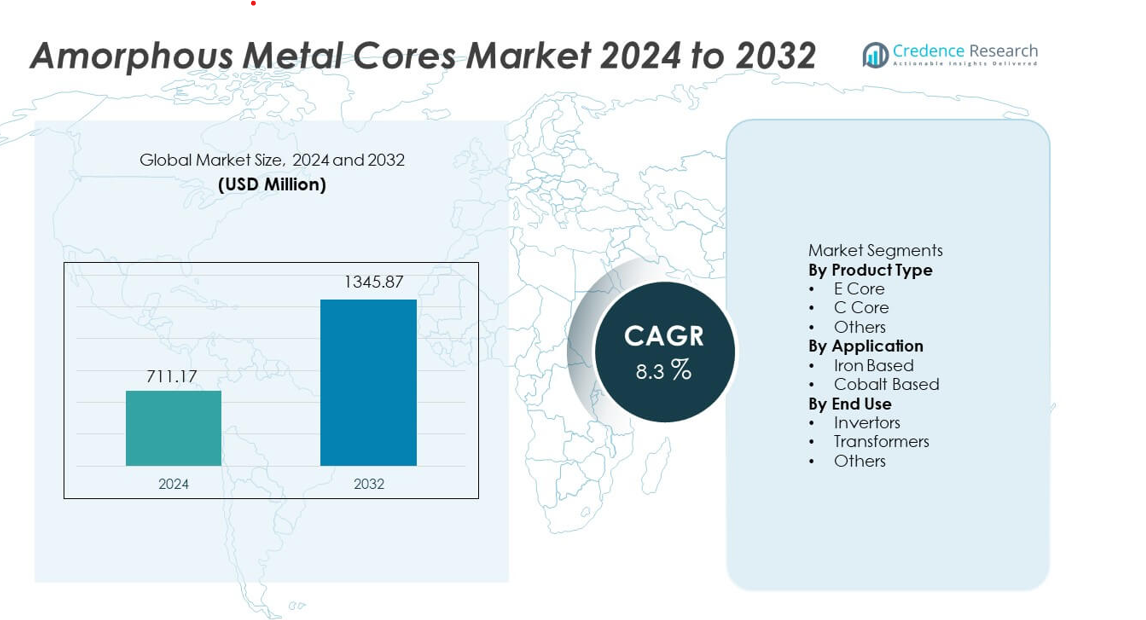
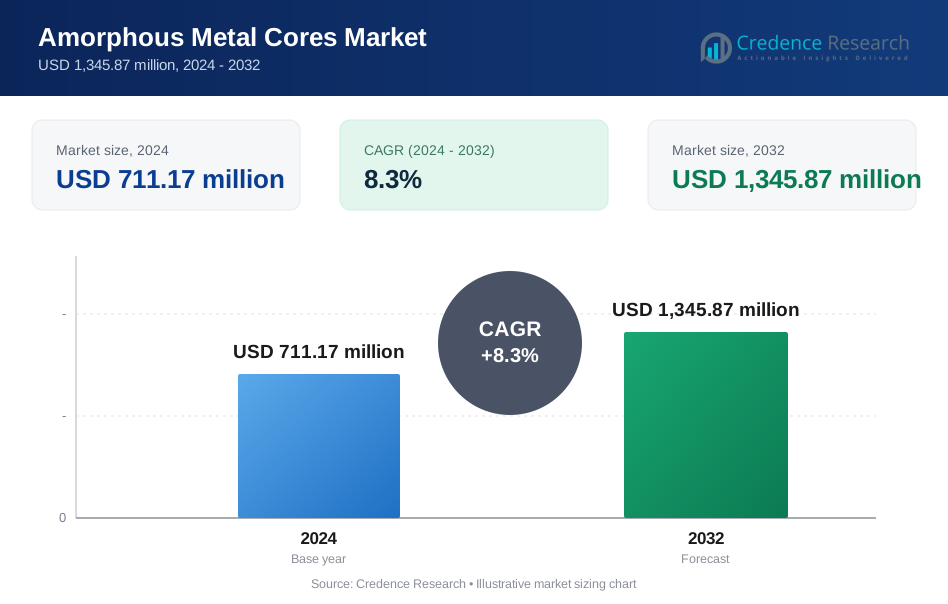
The Amorphous Metal Cores market reached USD 711.17 million in 2024 and is projected to hit USD 1,345.87 million by 2032, driven by a CAGR of 8.3% during the forecast period.
| REPORT ATTRIBUTE | DETAILS |
|---|---|
| Historical Period | 2020-2023 |
| Base Year | 2024 |
| Forecast Period | 2025-2032 |
| Amorphous Metal Cores Market Size 2024 | USD 711.17 million |
| Amorphous Metal Cores Market, CAGR | 8.3% |
| Amorphous Metal Cores Market Size 2032 | USD 1,345.87 million |
The Amorphous Metal Cores market features major players such as Hitachi Metals, Metglas, AT&M, VACUUMSCHMELZE, China Amorphous Technology, Zhaojing Incorporated, Qingdao Yunlu Advanced Materials, CG Power, ATI, and Fuji Electric, all of which focus on advanced alloy development and efficient ribbon processing to serve high-performance transformer and inverter applications. Asia Pacific leads the global market with a 34% share, supported by strong manufacturing capacity, expanding grid modernization, and rising renewable energy deployment. North America and Europe follow with significant adoption driven by strict efficiency regulations and ongoing transformer upgrades across utility and industrial networks.
Market Insights
- The Amorphous Metal Cores market reached USD 711.17 million in 2024 and will hit USD 1,345.87 million by 2032 at a CAGR of 8.3%, supported by rising adoption of low-loss transformer cores.
- Strong demand for energy-efficient transformers drives growth, with E Core holding 46% share and Transformers leading end use with 62% share as utilities prioritize reduced no-load losses and compliance with efficiency norms.
- Key trends include wider use of amorphous alloys in smart grids, EV charging systems, and renewable inverters, supported by innovations in thin-ribbon processing and enhanced magnetic stability.
- Market competition intensifies as players like Hitachi Metals, Metglas, AT&M, and VAC expand production capacity and pursue alloy improvements, while higher material and processing costs remain major restraints for price-sensitive regions.
- Asia Pacific leads with 34% share, followed by North America at 27% and Europe at 24%, driven by grid modernization, renewable expansion, and strict energy-efficiency policies.
Market Segmentation Analysis:
By Product Type
E Core holds the dominant position with a 46% share in the Amorphous Metal Cores market, driven by strong demand from distribution transformers that need lower core losses and improved efficiency. E Core designs support compact assembly and stable magnetic performance, which appeals to OEMs targeting high-volume electrical systems. C Core follows due to its use in medium-frequency devices that need higher mechanical strength. The Others category grows steadily as niche power electronics adopt customized shapes. Rising grid modernization and energy-efficient transformer upgrades continue to strengthen demand for E Core products across industrial and utility sectors.
- For instance, Hitachi Metals developed an E-core material with core loss values of 0.23 W/kg at 1.4 T, enabling high-efficiency distribution transformer production at scale. Metglas expanded its E-core portfolio using its 2605SA1 alloy, which supports transformer designs that reach 1.56 Tesla saturation flux density.
By Application
Iron-Based amorphous cores lead the market with a 58% share, supported by broad adoption in power distribution and renewable energy systems. These cores offer low hysteresis loss and strong thermal stability, which helps manufacturers deliver high-efficiency transformers with lower operational costs. Cobalt-Based cores hold a smaller share due to higher material costs but gain traction in precision electronics that need stable magnetic performance across wide temperature ranges. Rising deployment of smart transformers and sustained focus on loss-reduction targets continue to push Iron-Based core adoption across major markets.
- For instance, Metglas Iron-Based AMCC cores record very low hysteresis loss, supporting wide use in grid transformers. AT&M supplies Iron-Based ribbons with high tensile strength, improving durability in renewable power electronics.
By End Use
Transformers remain the leading end-use segment with a 62% share, supported by large-scale installation of distribution and power transformers in industrial, commercial, and utility networks. Amorphous cores help reduce no-load losses and support national energy-efficiency targets, making them a preferred choice for grid upgrades. Invertors follow as renewable energy and electric vehicle systems integrate high-frequency components that use amorphous materials for better switching performance. The Others segment grows in specialized power electronics. Ongoing investment in smart grids and energy-efficient infrastructure continues to strengthen transformer-related demand.
Key Growth Drivers
Rising Demand for Energy-Efficient Transformers
Rising adoption of energy-efficient transformers drives strong growth as utilities aim to reduce power losses across distribution networks. Amorphous metal cores offer lower hysteresis loss and improve overall efficiency, helping utilities meet stricter energy-saving standards. Government-led grid modernization programs further boost installation of high-efficiency transformers across urban and rural regions. Manufacturers invest in advanced core designs to support compact, lightweight units with improved thermal behavior. Expanding renewable power integration also increases the use of low-loss transformers, strengthening long-term demand for amorphous materials.
- For instance, VACUUMSCHMELZE developed ribbon materials with thermal stability up to 155°C, supporting long-duration operation in renewable energy-connected transformers.
Expansion of Smart Grid and Power Infrastructure
Investments in smart grid projects support market expansion as countries upgrade aging power infrastructure. Amorphous metal cores help improve transformer performance, enabling accurate load handling and reduced idle losses in automated grid systems. Increased deployment of digital substations and advanced metering raises the need for efficient distribution equipment. Utilities focus on lowering operational costs, which accelerates the shift toward amorphous-based solutions. Growing electrification in industrial and commercial sectors strengthens transformer demand, reinforcing steady adoption across large-scale infrastructure programs.
- For instance, China Amorphous Technology supplies amorphous ribbons with high magnetic permeability, meeting stability and low-loss requirements for smart grid transformers.
Growth in Power Electronics and Renewable Systems
Rising deployment of inverters and converters in solar, wind, and EV charging systems boosts demand for amorphous cores. These materials support high-frequency operation and enhance magnetic stability, helping manufacturers deliver compact and efficient power electronics. The renewable sector benefits from reduced heat generation and improved switching performance in inverter systems. Increasing electrification of transportation creates new opportunities for advanced core materials. As power electronics continue to scale, manufacturers integrate amorphous designs to meet efficiency targets and reduce long-term service costs.
Key Trends & Opportunities
Integration of Advanced Alloy Compositions
Producers develop refined alloy formulations to enhance magnetic performance, corrosion resistance, and thermal efficiency. Emerging iron-based and hybrid compositions offer lower core losses, which supports next-generation transformers and high-frequency devices. Manufacturers explore thin-ribbon technologies to achieve consistent output for mass production. These innovations open opportunities across smart grids, renewable installations, and fast-charging systems. Growing demand for durable and sustainable materials pushes suppliers to invest in scalable alloy development and automated production lines.
- For instance, Hitachi Metals’ FINEMET alloy achieves a coercivity of 2 A/m, supporting stable magnetic behavior in high-frequency systems.
Increasing Use of Amorphous Cores in EV and Industrial Applications
Electrification in automotive and industrial sectors creates new growth avenues as amorphous cores deliver stable behavior in high-load and high-frequency environments. EV onboard chargers, DC-DC converters, and motor drive systems adopt these materials to improve efficiency and reduce heat generation. Industrial automation also drives use in precision power supplies and control systems. As industries adopt digital and high-density equipment, demand rises for materials that support compact design and long service life. This trend strengthens supplier opportunities in emerging high-performance segments.
- For instance, Zhaojing Incorporated delivers high-frequency amorphous components for onboard chargers that withstand continuous operation temperatures, supporting long-term EV performance requirements.
Key Challenges
High Material and Processing Costs
The market faces cost pressures due to complex production steps such as rapid solidification, precision annealing, and thin-ribbon shaping. These processes raise unit costs compared with traditional silicon steel cores, limiting adoption among price-sensitive users. Manufacturers must balance quality improvements with cost reduction to stay competitive. Limited availability of high-grade alloys increases procurement challenges for smaller producers. Cost constraints remain a barrier to scaling adoption in regions where low-cost transformer solutions dominate.
Limited Supply Chain and Manufacturing Capacity
Supply chain gaps hinder market growth as amorphous alloy production depends on specialized equipment and skilled processing. Many regions lack local manufacturing capacity, increasing reliance on imports and extending delivery timelines. Fluctuations in raw material supply can disrupt production schedules for transformer OEMs. Smaller utilities face challenges in procurement, delaying infrastructure upgrades. Expanding regional manufacturing, improving logistics, and securing raw material sources remain critical to overcoming current capacity limitations.
Regional Analysis
North America
North America holds a 27% share of the Amorphous Metal Cores market, driven by rapid upgrades in distribution networks and strong adoption of energy-efficient transformers. Utilities invest in modern grid systems that improve load management and reduce idle losses. Rising installation of renewable energy projects further supports demand for high-performance cores with lower hysteresis loss. The U.S. leads the region due to strict energy-efficiency standards and strong transformer replacement cycles. Growth also benefits from increased use of amorphous materials in EV charging infrastructure and industrial power systems, strengthening long-term market expansion.
Europe
Europe accounts for a 24% share, supported by strict regulatory standards focused on reducing power losses in transmission and distribution systems. Countries adopt amorphous-core transformers to meet climate and energy-efficiency mandates across industrial and commercial sectors. The region also benefits from strong investments in renewable power generation and advanced grid automation. Germany, France, and the U.K. drive demand through continuous upgrades of smart grid infrastructure. The push toward carbon-neutral operations encourages utility companies and manufacturers to shift to materials that offer improved magnetic efficiency and lower lifecycle costs.
Asia Pacific
Asia Pacific leads the market with a 34% share, driven by expanding industrialization, rising electricity consumption, and large-scale grid modernization. China and India invest heavily in high-efficiency transformers to support rapid urban growth and renewable power deployment. Amorphous cores gain traction as governments enforce stricter efficiency norms for new distribution equipment. The region’s strong manufacturing base supports competitive production of amorphous alloys and transformer units. Growing EV charging networks, industrial automation, and digital infrastructure accelerate adoption, making Asia Pacific the fastest-growing regional market with sustained long-term demand.
Latin America
Latin America holds a 9% share, supported by gradual modernization of power networks and increasing need for efficient distribution transformers. Countries such as Brazil and Mexico adopt amorphous-core solutions to reduce technical losses in aging grid systems. Investments in renewable projects, especially solar and wind installations, create additional opportunities for high-efficiency transformer deployment. Market growth benefits from expanding industrial zones that require stable power systems with reduced operational costs. Limited local manufacturing capacity slows adoption, yet rising government focus on energy efficiency strengthens long-term market potential in the region.
Middle East & Africa
The Middle East & Africa region captures a 6% share, driven by ongoing infrastructure expansion and rising electricity demand across commercial and industrial sectors. Gulf countries invest in modern grid systems that support efficient power distribution and reduced losses. Adoption grows in African markets as utilities pursue low-loss transformers to stabilize supply networks. Renewable energy projects, including solar parks, increase the need for amorphous-core transformers that improve efficiency and durability. Despite slower adoption due to cost constraints, the region shows steady progress as modernization programs expand.
Market Segmentations:
By Product Type
- E Core
- C Core
- Others
By Application
- Iron Based
- Cobalt Based
By End Use
- Invertors
- Transformers
- Others
By Geography
- North America
- U.S.
- Canada
- Mexico
- Europe
- Germany
- France
- U.K.
- Italy
- Spain
- Rest of Europe
- Asia Pacific
- China
- Japan
- India
- South Korea
- South-east Asia
- Rest of Asia Pacific
- Latin America
- Brazil
- Argentina
- Rest of Latin America
- Middle East & Africa
- GCC Countries
- South Africa
- Rest of the Middle East and Africa
Competitive Landscape
Competitive landscape features leading companies such as Hitachi Metals, AT&M, Metglas, VACUUMSCHMELZE, China Amorphous Technology, Zhaojing Incorporated, Qingdao Yunlu Advanced Materials, CG Power and Industrial Solutions, ATI, and Fuji Electric. These manufacturers focus on high-efficiency amorphous alloy production, advanced ribbon processing, and improved annealing technologies to meet rising demand from transformer and inverter OEMs. Leading players expand production capacity and invest in thin-ribbon innovation to lower core losses and enhance magnetic stability. Partnerships with utilities and transformer manufacturers strengthen regional presence, while competitive pricing and supply chain reliability remain key differentiators. Companies also pursue sustainability goals by improving energy-efficient processing and reducing material waste. Rising demand for smart grids, renewable systems, and EV infrastructure pushes firms to accelerate R&D for next-generation high-frequency cores.
Key Player Analysis
- Hitachi Metals, Ltd.
- Advanced Technology & Materials Co., Ltd. (AT&M)
- China Amorphous Technology Co., Ltd.
- Metglas, Inc.
- VACUUMSCHMELZE GmbH & Co. KG
- Zhaojing Incorporated
- Qingdao Yunlu Advanced Materials
- CG Power and Industrial Solutions
- Allegheny Technologies Incorporated (ATI)
- Fuji Electric Co., Ltd.
Recent Developments
- In 2024, VACUUMSCHMELZE GmbH & Co. KG continued strengthening its supply of cores for energy-efficient transformer applications, a market which is growing globally. The company promoted its VITROPERM® alloy series, a nanocrystalline material, for low-loss magnetic components such as current transformers, common-mode chokes, and medium-frequency transformers.
- In 2024, Advanced Technology & Materials Co., Ltd. (AT&M) remained a key participant in the global amorphous core industry. The firm supported production of amorphous ribbon materials for distribution transformers.
- In March 2023, Metglas, Inc. announced a major expansion of its HB1M amorphous steel production line in Conway, South Carolina. The upgrade included installation of the world’s largest amorphous-metal casting line to meet rising transformer-grade core demand.
Report Coverage
The research report offers an in-depth analysis based on Product Type, Application, End Use and Geography. It details leading market players, providing an overview of their business, product offerings, investments, revenue streams, and key applications. Additionally, the report includes insights into the competitive environment, SWOT analysis, current market trends, as well as the primary drivers and constraints. Furthermore, it discusses various factors that have driven market expansion in recent years. The report also explores market dynamics, regulatory scenarios, and technological advancements that are shaping the industry. It assesses the impact of external factors and global economic changes on market growth. Lastly, it provides strategic recommendations for new entrants and established companies to navigate the complexities of the market.
Future Outlook
- Demand for high-efficiency transformers will rise as utilities upgrade distribution networks.
- Adoption of amorphous cores in EV charging and renewable systems will expand steadily.
- Advanced alloy formulations will improve magnetic stability and reduce core losses further.
- Manufacturers will increase production capacity to meet rising global transformer demand.
- Smart grid projects will accelerate installation of low-loss transformers across major regions.
- Power electronics growth will boost use of amorphous materials in high-frequency devices.
- Regional suppliers will invest in localized manufacturing to reduce import dependence.
- Automation and precision processing will enhance ribbon quality and lower production costs.
- Adoption in emerging economies will grow as governments tighten efficiency standards.
- Collaboration between OEMs and material producers will speed development of next-generation amorphous cores.
Request a Free Sample
Fill in your details and we'll send you a free sample report.
- Sample data tables & charts
- Research methodology
Need a Custom Version of This Report?
Tailor the scope, geography, or segments to your exact requirements.
- Custom geography or segment scope
- Direct access to our analyst team
Frequently Asked Questions
What is the current market size for the Amorphous Metal Cores market, and what is its projected size in 2032?
At what Compound Annual Growth Rate is the Amorphous Metal Cores market projected to grow between 2025 and 2032?
Which Amorphous Metal Cores market segment held the largest share in 2024?
What are the primary factors fueling the growth of the Amorphous Metal Cores market?
Who are the leading companies in the Amorphous Metal Cores market?
Table of Content
Chapter 1. Report Introduction
- 1.1 Report Description & Purpose
- 1.1.1 Report Title & Market Definition
- 1.1.2 Unique Selling Propositions (USP) & Key Differentiators
- 1.1.3 Value Proposition for Stakeholders
- 1.2 Research Objectives
- 1.2.1 Market Sizing Objectives (Volume & Revenue)
- 1.2.2 Segmentation Objectives
- 1.2.3 Competitive Intelligence Objectives
- 1.2.4 Forecast & Scenario Objectives
- 1.3 Report Scope
- 1.3.1 Amorphous Metal Cores Scope – Types & Subtypes Covered
- 1.3.2 Geographic Scope – Regions & Countries Covered
- 1.3.3 Historical Period, Base Year & Forecast Period (2024; forecast to 2032)
- 1.3.4 Inclusions & Exclusions
- 1.4 HS Code & Classification Framework
- 1.5 Currency, Units & Pricing Basis
- 1.6 Target Stakeholders
- 1.7 Limitations & Assumptions
Chapter 2. Executive Summary
- 2.1 Global Amorphous Metal Cores Market Snapshot
- 2.1.1 Market Size – Historical (2024) & Forecast (2024-2032) (2024: USD 711.17 million → 2032: USD 1,345.87 million)
- 2.1.2 Volume & Revenue – Global Totals
- 2.1.3 Key Market Highlights – Top Five Facts
- 2.2 Amorphous Metal Cores Market Segmentation Snapshot
- 2.2.1 Market Split by Region – 2024 vs. 2032
- 2.3 Competitive Snapshot
- 2.3.1 Top 10 Players by Revenue Share – 2024
- 2.3.2 Top 10 Players by Volume Share – 2024
- 2.3.3 Recent Strategic Developments (18-Month Summary)
- 2.4 Key Investment Highlights & Strategic Conclusions
Chapter 3. Amorphous Metal Cores Market Dynamics & Industry Analysis
- 3.1 Market Overview & Context
- 3.1.1 Amorphous Metal Cores Market Position in the Broader Automotive Value Chain
- 3.1.2 OEM vs. Replacement Market Dynamics
- 3.1.3 Market Maturity & Development Stage by Region
- 3.2 Amorphous Metal Cores Market Drivers
- 3.3 Amorphous Metal Cores Market Restraints & Challenges
- 3.4 Amorphous Metal Cores Market Opportunities
- 3.5 Porter's Five Forces Analysis
- 3.5.1 Threat of New Entrants
- 3.5.2 Bargaining Power of Suppliers
- 3.5.3 Bargaining Power of Buyers
- 3.5.4 Threat of Substitutes
- 3.5.5 Competitive Rivalry – Intensity Assessment
- 3.6 Amorphous Metal Cores Value Chain Analysis
- 3.6.1 Upstream – Raw Material/Input Suppliers
- 3.6.1.1 Raw Material/Input 1
- 3.6.1.2 Raw Material/Input 2
- 3.6.1.3 Raw Material/Input 3
- 3.6.2 Midstream – Production/Manufacturing/Service Delivery
- 3.6.2.1 Production/Process Overview
- 3.6.2.2 Key Facility Locations & Capacity by Manufacturer
- 3.6.3 Downstream – Distribution & End Consumer
- 3.6.3.1 Primary Channel – B2B/OEM
- 3.6.3.2 Secondary Channels – Dealer, Retail, Online, Direct
- 3.6.4 Value Chain Profitability Analysis
- 3.6.1 Upstream – Raw Material/Input Suppliers
- 3.7 PESTEL Analysis
- 3.7.1 Political Factors
- 3.7.2 Economic Factors
- 3.7.3 Social Factors
- 3.7.4 Technological Factors
- 3.7.5 Environmental Factors
- 3.7.6 Legal Factors
- 3.8 Amorphous Metal Cores Supply Chain Analysis
- 3.8.1 Raw Material/Input Supply Risk Assessment
- 3.8.2 Manufacturing Concentration Risk (Geographic Exposure)
- 3.8.3 Trade Disruption Impact Analysis
- 3.9 Regulatory & Policy Landscape
Note: The regulatory and policy landscape section covers regulations based on their applicability to the market, Amorphous Metal Cores category, geography, and scope of the study. Only regulatory frameworks with a material impact on operations, compliance, trade, sustainability, or market access are analyzed in detail.
Chapter 4. Key Investment Pockets & Opportunity Analysis
- 4.1 Amorphous Metal Cores Market Attractiveness Analysis
- 4.1.1 By Region – Investment Attractiveness Matrix (Volume × CAGR)
- 4.2 Absolute Revenue Growth Opportunity
- 4.2.1 By Region – Absolute USD Growth Through 2032
- 4.3 Incremental Volume Opportunity
- 4.3.1 By Region – Incremental Volume Through 2032
- 4.3.2 Segment – Incremental Volume
- 4.4 Emerging Submarket Opportunity Deep Dive (Subject to Applicability)
- 4.5 Emerging Market Opportunity Scorecards
- 4.5.1 United States
- 4.5.2 Europe
- 4.5.3 Asia
- 4.5.4 Middle East & Africa
Note: Emerging Market Opportunity Scorecards will be included based on relevance and strategic importance. Regions listed are indicative and may vary depending on data availability and market dynamics.
Chapter 5. Amorphous Metal Cores Import-Export Analysis & Trade Flows
- 5.1 Global Trade Overview
- 5.1.1 Global Export Value by Country (2024)
- 5.1.2 Global Export Volume by Country (2024)
- 5.1.3 Global Import Value by Country (2024)
- 5.1.4 Global Import Volume by Country (2024)
- 5.1.5 Net Trade Balance by Country (2024)
- 5.2 Export Analysis – Segment
- 5.2.1 Type 1 (HS Code)
- 5.2.2 Type 2 (HS Code)
- 5.2.3 Type 3 (HS Code)
- 5.2.4 Type 4 (HS Code)
- 5.2.5 Type 5 (HS Code)
- 5.3 Import Analysis – Segment
- 5.3.1 Type 1 (HS Code)
- 5.3.2 Type 2 (HS Code)
- 5.3.3 Type 3 (HS Code)
- 5.3.4 Type 4 (HS Code)
- 5.3.5 Type 5 (HS Code)
- 5.4 Average Unit Trade Prices
- 5.4.1 Average Export Price – Segment & Country
- 5.4.2 Average Import Price – Segment & Source Country
- 5.4.3 Price Trends (2024)
- 5.5 Key Trade Route Analysis
- 5.5.1 Trade Route 1
- 5.5.2 Trade Route 2
- 5.5.3 Trade Route 3
- 5.5.4 Trade Route 4
- 5.5.5 Trade Route 5
- 5.6 Trade Policy Impact Assessment
- 5.6.1 US Anti-Dumping & Section 301 Tariffs
- 5.6.2 EU Customs Union Impact
- 5.6.3 Major Free Trade Agreements
- 5.6.4 USMCA Rules of Origin
Note: Trade policy analysis will be included only where relevant to the Amorphous Metal Cores market.
Chapter 6. Competitive Landscape & Company Benchmarking
- 6.1 Amorphous Metal Cores Market Concentration & Structure
- 6.1.1 Herfindahl-Hirschman Index (HHI) – vs. 2024
- 6.1.2 Tier 1, Tier 2 & Tier 3 Market Structure
- 6.1.3 Global, Regional & Local Player Dynamics
- 6.2 Amorphous Metal Cores Market Share Analysis – 2024
- 6.2.1 Global Revenue Share by Company
- 6.2.2 Global Volume Share by Company
- 6.2.3 Regional Revenue Share
- 6.2.4 Market Share Evolution ( vs. 2024)
- 6.2.5 OEM Segment Share by Company
- 6.2.6 Replacement Segment Share by Company
- 6.3 Production/Delivery Capacity & Facility Analysis
- 6.3.1 Global Installed Capacity
- 6.3.2 Capacity Utilization Rates
- 6.3.3 Production/Output Volume
- 6.3.4 Facility Locations & Capacity Map
- 6.3.5 Planned Capacity Additions
- 6.4 Amorphous Metal Cores Competitive Benchmarking Matrix
- 6.4.1 Revenue, Volume, CAGR & Profitability Comparison
- 6.4.2 Channel Revenue Mix
- 6.4.3 Geographic Revenue Exposure
- 6.4.4 R&D Intensity
- 6.4.5 Sustainability Maturity
- 6.5 Strategic Developments in Amorphous Metal Cores (Last 24 Months)
- 6.5.1 Mergers, Acquisitions & Divestments
- 6.5.2 New Amorphous Metal Cores Launches
- 6.5.3 Facility Expansions
- 6.5.4 Strategic Alliances, Joint Ventures & Partnerships
- 6.5.5 Distribution Expansion & Market Entry
- 6.5.6 Sustainability & ESG Initiatives
- 6.6 Competitive Strategy Mapping
- 6.6.1 Leader, Challenger, Follower & Niche Classification
- 6.6.2 Pricing Strategy Comparison
- 6.6.3 Channel Strategy Matrix
Note: Strategic developments are included based on their materiality and the availability of reliable information.
Chapter 7. Global Amorphous Metal Cores Market – By Distribution Channel
- 7.1 Segment Overview
- 7.1.1 Volume & Revenue Split by Channel (2024 & 2032)
- 7.1.2 Channel Mix Evolution (2024-2032)
Chapter 8. Regional Market Analysis – Global Overview
- 8.1 Global Regional Overview
- 8.1.1 Regional Volume Share
- 8.1.2 Regional Revenue Share
- 8.1.3 Regional Volume by Region
- 8.1.4 Regional Revenue by Region
- 8.1.5 Regional Forecast Through 2032
- 8.2 Cross-Regional Segment Analysis
- 8.2.1 By Distribution Channel
- 8.2.2 By Brand/Price Tier
Chapter 9. North America Amorphous Metal Cores Market
- 9.1 United States
- 9.2 Canada
- 9.3 Mexico
Chapter 10. Europe Amorphous Metal Cores Market
- 10.1 Germany
- 10.2 France
- 10.3 Italy
- 10.4 United Kingdom
- 10.5 Spain
- 10.6 Poland
- 10.7 Russia
- 10.8 Netherlands
- 10.9 Belgium
- 10.10 Sweden
- 10.11 Denmark
- 10.12 Norway
- 10.13 Rest of Europe
Chapter 11. Asia Pacific Amorphous Metal Cores Market
- 11.1 China
- 11.2 India
- 11.3 Japan
- 11.4 South Korea
- 11.5 Thailand
- 11.6 Indonesia
- 11.7 Vietnam
- 11.8 Malaysia
- 11.9 Australia
- 11.10 Rest of Asia Pacific
Chapter 12. Latin America Amorphous Metal Cores Market
- 12.1 Brazil
- 12.2 Argentina
- 12.3 Colombia
- 12.4 Chile
- 12.5 Rest of Latin America
Chapter 13. Middle East Amorphous Metal Cores Market
- 13.1 Saudi Arabia
- 13.2 United Arab Emirates
- 13.3 Turkey
- 13.4 Israel
- 13.5 Iran
- 13.6 Rest of the Middle East
Chapter 14. Africa Amorphous Metal Cores Market
- 14.1 South Africa
- 14.2 Egypt
- 14.3 Nigeria
- 14.4 Morocco
- 14.5 Rest of Africa
Chapter 15. Amorphous Metal Cores Company Profiles
- 15.1 [Company 01]
- 15.1.1 Company Overview
- 15.1.2 Key Management Personnel
- 15.1.3 Products & Services Portfolio
- 15.1.4 Financial Performance
- 15.1.5 Key Market Focus & Geographic Presence
- 15.1.6 Recent Developments & Strategic Initiatives
Note: The company profile list is preliminary and may change based on research findings, market developments, data availability, and client requirements.
Chapter 16. Appendices
- Appendix A – List of Abbreviations & Acronyms
- Appendix B – Industry Classification Code Reference – Full Series
- Appendix C – Production & Capacity Data Tables
- Appendix D – End-Use & Demand Base Tables
- Appendix E – Consumption & Replacement Rate Assumptions
- Appendix F – ASP Reference Tables
- Appendix G – Manufacturing & Facility Database
- Appendix H – Import-Export Data Tables
- Appendix I – Regulatory Summary Tables
- Appendix J – Primary Research Participant List (Anonymized)
- Appendix K – Primary Research Questionnaire Framework
- Appendix L – Data Sources & Bibliography
- Appendix M – Market Size Divergence & Source Comparison
Chapter 17. Research Methodology
- 17.1 Research Framework & Philosophy
- 17.2 Secondary Research – Sources, Hierarchy & Data Extraction
- 17.3 Data Modeling – Bottom-Up & Top-Down Market Sizing
- 17.4 Primary Research – Stakeholder Framework, LOI & Sample Sizes
- 17.5 Forecast Methodology – Regression, Scenario & Sensitivity Analysis
- 17.6 Quality Control – Four-Layer Validation Framework
- 17.7 Limitations & Standard Assumptions
- 17.8 Disclaimer
