
Market Overview
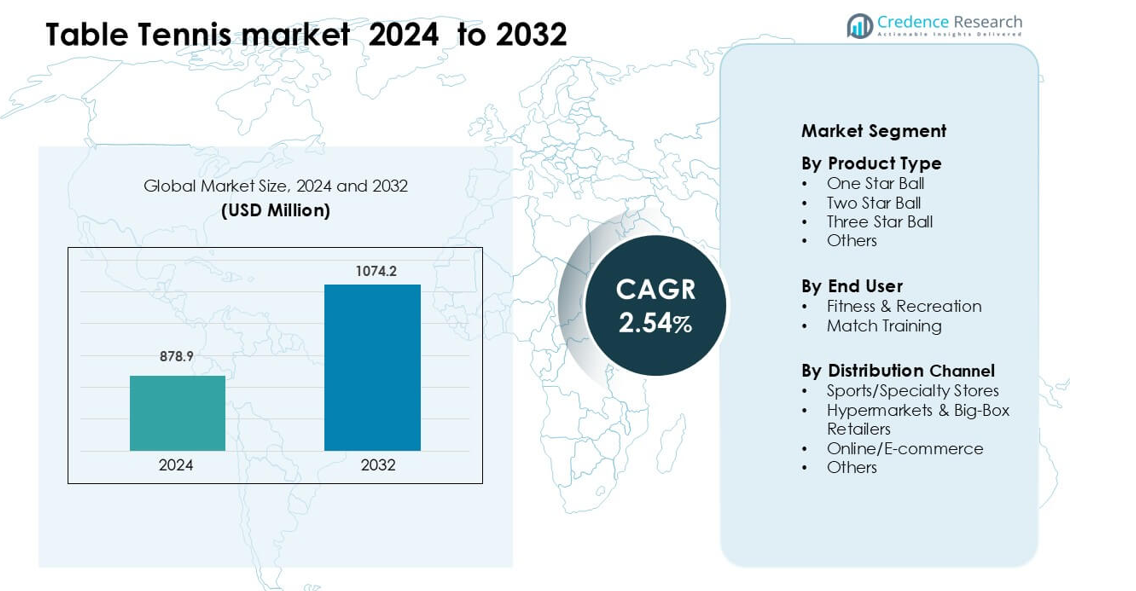
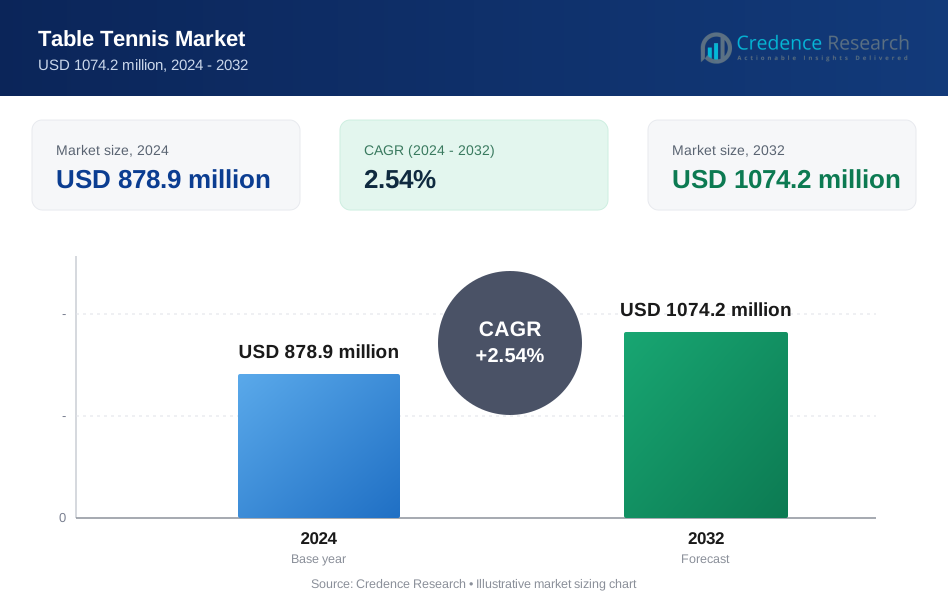
Table Tennis market was valued at USD 878.9 million in 2024 and is anticipated to reach USD 1074.2 million by 2032, growing at a CAGR of 2.54 % during the forecast period.
| REPORT ATTRIBUTE | DETAILS |
|---|---|
| Historical Period | 2020-2023 |
| Base Year | 2024 |
| Forecast Period | 2025-2032 |
| Table Tennis Market Size 2024 | USD 878.9 million |
| Table Tennis Market, CAGR | 2.54% |
| Table Tennis Market Size 2032 | USD 1074.2 million |
The table tennis market is shaped by strong competition among leading brands such as Killerspin LLC, Cornilleau SAS, TIBHAR Tibor Harangozo GmbH, Double Happiness, JOOLA Table Tennis GmbH, Nippon Takkyu Co. Ltd., Donic Schildkrot, Dr Neubauer LTD, Stag International, and Tamasu Co. Ltd. These companies focus on advanced materials, performance-engineered rackets, ITTF-approved balls, and durable tables to meet rising demand from both competitive and recreational users. Asia-Pacific remains the leading region with 34% market share, supported by a deep-rooted sports culture, large player base, and strong manufacturing presence that drives consistent adoption across all product categories.
Market Insights
- Table Tennis market was valued at USD 878.9 million in 2024 and is anticipated to reach USD 1074.2 million by 2032, growing at a CAGR of 2.54 % during the forecast period.
- Demand grows due to rising participation in clubs, schools, and recreational spaces, driving strong sales of three-star balls, which hold 49% share in product type.
- Premium equipment trends strengthen as players prefer ITTF-approved balls, advanced blades, and durable tables, supported by growing online customization options.
- Competition intensifies as Killerspin, Cornilleau, Double Happiness, JOOLA, TIBHAR, and Donic Schildkrot focus on quality materials and wider distribution, while low-cost imports pressure pricing.
- Asia-Pacific leads with 34% share, followed by Europe at 31%, North America at 28%, while match-training end users dominate the segment with 57% share, supported by expanding academies.
Market Segmentation Analysis:
By Product Type
Three-star balls lead this segment with about 49% share in 2024 due to strict ITTF standards and strong use in professional events. Coaches and athletes prefer this grade because the balls offer tighter weight control, stable bounce, and high durability during fast rallies. One-star and two-star balls grow at steady rates as schools and clubs expand training programs. Demand for “others,” including practice balls and training-enhanced variants, rises as beginners seek low-cost options for basic skill development.
- For instance, the Butterfly Three Star R40+ ball, the official ball partner for the ITTF World Championships Finals from 2024 to 2026 (including the Busan 2024, Doha 2025, and London 2026 events), typically weighs 2.7 grams and meets the ITTF’s 40 mm diameter standard, providing players with highly consistent bounce and reliable trajectory in elite-level play
By End User
Match training dominates this segment with nearly 57% share in 2024, driven by rising participation in competitive leagues and structured coaching programs. Training centers adopt premium three-star balls to support precision drills and consistent spin response. Fitness and recreation users continue to expand as table tennis gains popularity as a low-impact indoor sport. Growth in home setups and community centers further boosts recreational demand, especially among new players seeking simple and enjoyable exercise routines.
- For instance, many elite academies use Nittaku Premium 3‑Star 40+ balls that weigh 2.70 g (within ITTF‑tolerance of 2.67–2.77 g) to ensure highly consistent bounce and spin during repeated drill cycles.
By Distribution Channel
Sports and specialty stores hold the dominant position with about 44% share in 2024 due to strong product variety, expert guidance, and high trust among athletes. These outlets stock ITTF-approved balls and advanced training lines, supporting informed purchase decisions. Online channels grow the fastest as e-commerce platforms offer wide availability and bundled training kits. Hypermarkets and big-box retailers maintain steady sales from casual players who prefer convenient access and affordable multi-pack options.
Key Growth Drivers
Rising Participation in Competitive and Recreational Table Tennis
Growing participation across schools, clubs, and organized leagues acts as a major growth driver for the table tennis market. More youth players join district and state-level competitions, which boosts demand for certified balls, premium paddles, and durable tables. Recreational uptake also expands as families adopt table tennis as a simple indoor activity that suits compact spaces. Corporate wellness programs introduce table tennis zones to promote employee fitness, increasing institutional purchases. Urban housing societies set up dedicated play areas, lifting adoption among amateurs. This broad participation mix strengthens year-round product demand across entry-level and professional categories.
- For instance, the ITTF Participation Program saw engagement from 110 member associations by 2024, supporting grassroots development and increasing the need for certified equipment.
Expansion of Training Infrastructure and Coaching Ecosystems
The rapid growth of academies, skill-based coaching centers, and structured training formats drives steady market expansion. Certified coaches guide players through intensive drills, encouraging the use of higher-quality balls, multi-ball training equipment, and robot feeders. National sports bodies promote athlete pipelines through grassroots programs, raising the consumption of three-star balls and advanced rackets. Many cities now offer indoor table tennis venues with modern flooring and lighting, increasing product replacement cycles. This structured environment fuels consistent sales across performance-driven gear as players progress toward competitive benchmarks.
- For instance, SFL Table Tennis Academy, which now has 2+ centers, uses structured multi-stage curricula under certified coaches to train hundreds of young players in footwork, spin control, and reflex drills.
Technological Advancements in Equipment and Materials
Advances in ball material consistency, racket blade engineering, and smart training devices significantly influence market growth. Manufacturers introduce optimized celluloid-free plastic balls with tighter bounce tolerance, appealing to competitive athletes. Sensors embedded in paddles or training robots track ball speed and spin, creating data-driven coaching experiences. Improved table surfaces enhance stability and minimize wear, attracting clubs and sports centers that prioritize long-term durability. These innovations strengthen brand differentiation and support premium pricing, encouraging both professionals and amateurs to upgrade equipment for better performance outcomes.
Key Trends and Opportunities
Shift Toward Premium and ITTF-Certified Products
A key trend shaping the market is the growing preference for premium, competition-grade balls and rackets that meet ITTF requirements. Players across training academies and tournaments seek enhanced spin response and bounce uniformity, driving high adoption of three-star balls. Retailers also expand certification-based segmentation, helping customers make informed choices. This shift improves product quality standards across the market and pushes manufacturers to invest in precision molding, advanced polymers, and strict quality checks to meet rising expectations.
- For instance, Butterfly’s Three‑Star R40+ ball is ITTF-approved and manufactured with a tightly controlled plastic thickness tests by Butterfly show its material maintains consistent wall thickness to ensure stable trajectories and bounce.
Growth of E-commerce and Customized Table Tennis Gear
Online platforms play a significant role in shaping buying behavior as players access global brands, performance-oriented gear, and detailed product comparisons. E-commerce retailers offer value bundles, seasonal discounts, and home delivery advantages, accelerating online penetration. Customization trends also rise as athletes seek personalized paddles, grip textures, blade types, and weight profiles. This trend supports niche manufacturers that specialize in tailored gear and allows brands to build stronger user engagement through direct-to-consumer channels.
- For instance, World of Table Tennis, a major online retailer, offers a Racket Assembly Service (for a charge of ₹300) that lets players customize blade + rubber combinations before checkout.
Key Challenges
Price Sensitivity in Developing Regions
Price remains a major challenge for budget-focused buyers in emerging markets, where training centers and recreational users look for cost-effective gear. High-quality three-star balls, competition-grade tables, and professional paddles can be expensive, pushing many consumers toward low-priced alternatives. This shift often limits adoption of premium products and affects margins for established brands. Balancing cost with performance becomes essential for manufacturers targeting large entry-level segments that dominate volume demand.
Quality Variability and Need for Standardization
Inconsistent product quality among low-cost manufacturers creates a challenge, especially for balls and paddles used in coaching and competition. Variability in roundness, bounce, and durability affects training accuracy and overall gameplay experience. Clubs and coaches often face frequent product replacements because of wear issues and structural inconsistency. This lack of standardization pressures brands to maintain high-precision manufacturing while educating buyers on certified product benefits. Ensuring uniformity remains critical for strengthening user confidence across all market tiers.
Regional Analysis
North America
North America holds about 28% market share in the table tennis market, supported by strong recreational adoption in homes, schools, and community centers. Growing interest in wellness activities boosts purchases of tables and training balls across the U.S. and Canada. Clubs and corporate wellness programs expand indoor play zones, lifting professional-grade equipment demand. Specialty retailers and e-commerce platforms drive consistent product access. Rising participation in local leagues and youth tournaments further supports steady sales of certified three-star balls and premium rackets.
Europe
Europe accounts for roughly 31% market share, making it one of the leading regions due to a well-developed sports culture and organized club structure. Countries such as Germany, France, and Sweden maintain strong competitive ecosystems that fuel steady demand for ITTF-approved equipment. Training academies and national programs support high consumption of three-star balls and advanced paddles. Recreational uptake also grows as table tennis is widely used in fitness centers and schools. Robust retail networks and online channels ensure easy availability across all price segments.
Asia-Pacific
Asia-Pacific dominates the global market with about 34% market share, driven by deep-rooted popularity in China, Japan, South Korea, and India. China’s long-standing leadership in the sport fuels extensive production and consumption of premium training balls and high-performance rackets. Rising urbanization supports home-based recreation and adoption among youth players. Expanding training academies and government-supported sports initiatives lift demand across both entry-level and professional categories. Strong manufacturing presence helps maintain competitive pricing and broad product availability across the region.
Latin America
Latin America holds close to 4% market share, with demand rising steadily across Brazil, Argentina, and Mexico. Growth comes from expanding school sports programs and increasing adoption of indoor recreational activities. Urban fitness centers and community clubs incorporate table tennis zones, supporting demand for mid-range tables and training balls. E-commerce penetration improves product accessibility, especially for amateur players. Although premium equipment adoption remains modest, growing interest in organized tournaments fosters slow but consistent upgrades to certified three-star balls and higher-quality paddles.
Middle East & Africa
The Middle East & Africa region accounts for around 3% market share, driven by rising interest in indoor sports across the UAE, Saudi Arabia, and South Africa. Schools, residential communities, and recreational hubs adopt table tennis as a compact and engaging sport. Growth in sports retail chains improves access to mid-range equipment for new players. Competitive play is still limited, but emerging clubs and corporate events gradually increase demand for better-quality balls and rackets. E-commerce platforms help expand reach in markets with limited specialty stores, supporting steady long-term growth.
Market Segmentations:
By Product Type
- One Star Ball
- Two Star Ball
- Three Star Ball
- Others
By End User
- Fitness & Recreation
- Match Training
By Distribution Channel
- Sports/Specialty Stores
- Hypermarkets & Big-Box Retailers
- Online/E-commerce
- Others
By Geography
- North America
- U.S.
- Canada
- Mexico
- Europe
- Germany
- France
- U.K.
- Italy
- Spain
- Rest of Europe
- Asia Pacific
- China
- Japan
- India
- South Korea
- South-east Asia
- Rest of Asia Pacific
- Latin America
- Brazil
- Argentina
- Rest of Latin America
- Middle East & Africa
- GCC Countries
- South Africa
- Rest of the Middle East and Africa
Competitive Landscape
The competitive landscape of the table tennis market features a mix of global brands and specialized manufacturers that compete through product innovation, material quality, and strong distribution networks. Leading companies such as Killerspin LLC, Cornilleau SAS, TIBHAR Tibor Harangozo GmbH, Double Happiness, JOOLA Table Tennis GmbH, Nippon Takkyu Co. Ltd., Donic Schildkrot, Dr Neubauer LTD, Stag International, and Tamasu Co. Ltd. focus on expanding their product portfolios, including ITTF-approved balls, performance-driven rackets, premium tables, and advanced training gear. Many brands invest in high-precision plastics, optimized blade compositions, and durability-focused engineering to meet rising professional standards. Partnerships with clubs, academies, and national sports bodies strengthen brand visibility, while online retail channels improve global reach. Companies also emphasize customization options and player-centric designs to attract both competitive athletes and recreational users. This diverse competitive environment drives steady innovation and supports continuous improvements in product quality across all market tiers.
Key Player Analysis
- Killerspin LLC (U.S.)
- Cornilleau SAS (France)
- TIBHAR Tibor Harangozo GmbH (Germany)
- Double Happiness (China)
- JOOLA Table Tennis GmbH (Germany)
- Nippon Takkyu Co. Ltd. (Japan)
- Donic Schildkrot (Germany)
- Dr Neubauer LTD (Germany)
- Stag International
- Tamasu Co. Ltd. (Japan)
Recent Developments
- In December 2024, TIBHAR Tibor Harangozo GmbH signed a four-year landmark agreement with the ITTF Foundation to become Global Equipment Partner for flooring at the World Table Tennis for Health Festival from 2025 to 2028, deepening TIBHAR’s role in major international, health-focused table tennis event.
- In 2024, Cornilleau SAS featured its 'Origin' outdoor ping-pong table within its "Play-Style" range, which is highlighted in design media as a piece of designer furniture (by removing the net, it can function as a dining or conference table), reinforcing Cornilleau’s positioning in the premium lifestyle table tennis segment.
Report Coverage
The research report offers an in-depth analysis based on Product Type, End-User, Distribution Channel and Geography. It details leading market players, providing an overview of their business, product offerings, investments, revenue streams, and key applications. Additionally, the report includes insights into the competitive environment, SWOT analysis, current market trends, as well as the primary drivers and constraints. Furthermore, it discusses various factors that have driven market expansion in recent years. The report also explores market dynamics, regulatory scenarios, and technological advancements that are shaping the industry. It assesses the impact of external factors and global economic changes on market growth. Lastly, it provides strategic recommendations for new entrants and established companies to navigate the complexities of the market.
Future Outlook
- Global participation will rise as more schools and clubs add structured table tennis programs.
- Premium three-star balls and ITTF-certified gear will see stronger demand from competitive players.
- Smart training devices and robot-assisted coaching will gain wider adoption in academies.
- Online customization of paddles and accessories will become a major purchase driver.
- E-commerce channels will strengthen their role in global equipment distribution.
- Professional leagues and regional tournaments will expand visibility and boost product upgrades.
- Recreational play will grow as urban families adopt compact indoor sports.
- Material innovation will improve ball durability, racket speed, and table stability.
- Manufacturers will invest in sustainable materials to meet rising eco-friendly preferences.
- Emerging regions will increase spending on mid-range equipment as training infrastructure improves.
Request a Free Sample
Fill in your details and we'll send you a free sample report.
- Sample data tables & charts
- Research methodology
Need a Custom Version of This Report?
Tailor the scope, geography, or segments to your exact requirements.
- Custom geography or segment scope
- Direct access to our analyst team
Frequently Asked Questions
What is the current market size for Table Tennis market, and what is its projected size in 2032?
At what Compound Annual Growth Rate is Table Tennis market projected to grow between 2025 and 2032?
Which is the leading region of the market for Table Tennis?
What are the key drivers for the growth of the Table Tennis market?
Which is the end user's major segment in the Table Tennis market?
Table of Content
Chapter 1. Report Introduction
- 1.1 Report Description & Purpose
- 1.1.1 Report Title & Market Definition
- 1.1.2 Unique Selling Propositions (USP) & Key Differentiators
- 1.1.3 Value Proposition for Stakeholders
- 1.2 Research Objectives
- 1.2.1 Market Sizing Objectives (Volume & Revenue) (Volume Where Applicable)
- 1.2.2 Segmentation Objectives
- 1.2.3 Competitive Intelligence Objectives
- 1.2.4 Forecast & Scenario Objectives
- 1.3 Report Scope
- 1.3.1 Table Tennis Scope – Segments & Subsegments Covered
- 1.3.2 Geographic Scope – Regions & Countries Covered
- 1.3.3 Historical Period, Base Year & Forecast Period (2024; forecast to 2032)
- 1.3.4 Inclusions & Exclusions
- 1.4 Industry Classification & Applicable Codes
- 1.5 Currency, Measurement Units & Valuation Basis
- 1.6 Target Stakeholders
- 1.7 Limitations & Assumptions
Chapter 2. Executive Summary
- 2.1 Global Table Tennis Market Snapshot
- 2.1.1 Market Size – Historical (2024) & Forecast (2024-2032) (2024: USD 878.9 million → 2032: USD 1074.2 million)
- 2.1.2 Volume & Revenue – Global Totals (Volume Where Applicable)
- 2.1.3 Key Market Highlights – Top Five Facts
- 2.2 Table Tennis Market Segmentation Snapshot
- 2.2.1 Market Split by Region – 2024 vs. 2032
- 2.3 Competitive Snapshot
- 2.3.1 Top 10 Players by Revenue Share – 2024
- 2.3.2 Top 10 Players by Volume Share – 2024 (Volume Where Applicable)
- 2.3.3 Recent Strategic Developments (18-Month Summary)
- 2.4 Key Investment Highlights & Strategic Conclusions
Chapter 3. Table Tennis Market Dynamics & Industry Analysis
- 3.1 Market Overview & Context
- 3.1.1 Table Tennis Market Position in the Broader Industry Value Chain
- 3.1.2 Demand Structure & Purchasing Dynamics
- 3.1.3 Market Maturity & Development Stage by Region
- 3.2 Table Tennis Market Drivers
- 3.3 Table Tennis Market Restraints & Challenges
- 3.4 Table Tennis Market Opportunities
- 3.5 Porter's Five Forces Analysis
- 3.5.1 Threat of New Entrants
- 3.5.2 Bargaining Power of Suppliers
- 3.5.3 Bargaining Power of Buyers
- 3.5.4 Threat of Substitutes
- 3.5.5 Competitive Rivalry – Intensity Assessment
- 3.6 Table Tennis Value Chain Analysis
- 3.6.1 Upstream – Key Inputs, Resources & Suppliers
- 3.6.1.1 Key Input/Resource 1
- 3.6.1.2 Key Input/Resource 2
- 3.6.1.3 Key Input/Resource 3
- 3.6.2 Midstream – Core Operations & Value Creation
- 3.6.2.1 Operating Model & Process Overview
- 3.6.2.2 Key Operating Locations & Capabilities by Company
- 3.6.3 Downstream – Market Channels & End Users
- 3.6.3.1 Direct Sales & Customer Engagement Channels
- 3.6.3.2 Indirect Sales, Intermediaries & Partner Channels
- 3.6.4 Value Chain Profitability Analysis
- 3.6.1 Upstream – Key Inputs, Resources & Suppliers
- 3.7 PESTEL Analysis
- 3.7.1 Political Factors
- 3.7.2 Economic Factors
- 3.7.3 Social Factors
- 3.7.4 Technological Factors
- 3.7.5 Environmental Factors
- 3.7.6 Legal Factors
- 3.8 Table Tennis Supply Chain Analysis
- 3.8.1 Critical Input & Resource Availability Risk Assessment
- 3.8.2 Supplier & Operational Concentration Risk (Geographic Exposure)
- 3.8.3 Supply & Service Disruption Impact Analysis
- 3.9 Regulatory & Policy Landscape
Note: The regulatory and policy landscape section covers regulations based on their applicability to the market, Table Tennis category, geography, and scope of the study. Only regulatory frameworks with a material impact on operations, compliance, trade, sustainability, or market access are analyzed in detail.
Chapter 4. Key Investment Pockets & Opportunity Analysis
- 4.1 Table Tennis Market Attractiveness Analysis
- 4.1.1 By Region – Investment Attractiveness Matrix (Market Size × CAGR)
- 4.2 Absolute Revenue Growth Opportunity
- 4.2.1 By Region – Absolute Revenue Growth Through 2032
- 4.3 Incremental Demand Opportunity
- 4.3.1 By Region – Incremental Demand Through 2032
- 4.3.2 Segment – Incremental Demand
- 4.4 Emerging Submarket Opportunity Deep Dive (Subject to Applicability)
- 4.5 Priority Market Opportunity Scorecards
- 4.5.1 United States
- 4.5.2 Europe
- 4.5.3 Asia
- 4.5.4 Middle East & Africa
Note: Priority market opportunity scorecards reflect the geographic scope and strategic relevance of the study. Listed markets are indicative and may be adapted to the industry.
Chapter 5. Table Tennis Cross-Border Trade & Market Access Analysis
- 5.1 International Trade & Cross-Border Activity Overview
- 5.1.1 Global Export Value by Country (2024)
- 5.1.2 Global Export Volume by Country (2024) (Volume Where Applicable)
- 5.1.3 Global Import Value by Country (2024)
- 5.1.4 Global Import Volume by Country (2024) (Volume Where Applicable)
- 5.1.5 Net Trade Balance by Country (2024)
- 5.2 Export Analysis – Segment
- 5.2.1 Category 1 (Applicable Classification Code)
- 5.2.2 Category 2 (Applicable Classification Code)
- 5.2.3 Category 3 (Applicable Classification Code)
- 5.2.4 Category 4 (Applicable Classification Code)
- 5.2.5 Category 5 (Applicable Classification Code)
- 5.3 Import Analysis – Segment
- 5.3.1 Category 1 (Applicable Classification Code)
- 5.3.2 Category 2 (Applicable Classification Code)
- 5.3.3 Category 3 (Applicable Classification Code)
- 5.3.4 Category 4 (Applicable Classification Code)
- 5.3.5 Category 5 (Applicable Classification Code)
- 5.4 Cross-Border Pricing & Transaction Benchmarks
- 5.4.1 Export Pricing – Segment & Country
- 5.4.2 Import Pricing – Segment & Source Country
- 5.4.3 Price Trends (2024)
- 5.5 Key Cross-Border Trade & Delivery Routes
- 5.5.1 Cross-Border Trade/Delivery Route 1
- 5.5.2 Cross-Border Trade/Delivery Route 2
- 5.5.3 Cross-Border Trade/Delivery Route 3
- 5.5.4 Cross-Border Trade/Delivery Route 4
- 5.5.5 Cross-Border Trade/Delivery Route 5
- 5.6 Trade Policy & Market Access Impact Assessment
- 5.6.1 Tariff & Non-Tariff Barriers
- 5.6.2 Regional Trade & Economic Integration Frameworks
- 5.6.3 Bilateral & Multilateral Trade Agreements
- 5.6.4 Cross-Border Operating, Licensing & Localization Requirements
Note: This chapter applies where cross-border trade or delivery is relevant to Table Tennis. Goods, services, and digital offerings are assessed using applicable classifications and transaction measures. Import-export volumes, trade balances, and route analyses are included only where meaningful to the market.
Chapter 6. Competitive Landscape & Company Benchmarking
- 6.1 Table Tennis Market Concentration & Structure
- 6.1.1 Herfindahl-Hirschman Index (HHI) – vs. 2024
- 6.1.2 Leading, Mid-Sized & Emerging Player Structure
- 6.1.3 Global, Regional & Local Player Dynamics
- 6.2 Table Tennis Market Share Analysis – 2024
- 6.2.1 Global Revenue Share by Company
- 6.2.2 Global Volume Share by Company (Volume Where Applicable)
- 6.2.3 Regional Revenue Share
- 6.2.4 Market Share Evolution ( vs. 2024)
- 6.2.5 Company Market Share by Key Segment
- 6.2.6 Company Market Share by Customer Group
- 6.3 Operating Scale, Capacity & Infrastructure Analysis
- 6.3.1 Global Operating Scale & Supply Capacity
- 6.3.2 Resource Utilization & Operating Efficiency
- 6.3.3 Output, Service Delivery & Activity Metrics
- 6.3.4 Operating Footprint & Infrastructure Map
- 6.3.5 Planned Operational & Capacity Expansion
- 6.4 Table Tennis Competitive Benchmarking Matrix
- 6.4.1 Revenue, Growth, Profitability & Operating Metric Comparison
- 6.4.2 Channel Revenue Mix
- 6.4.3 Geographic Revenue Exposure
- 6.4.4 R&D Intensity
- 6.4.5 Sustainability Maturity
- 6.5 Strategic Developments in Table Tennis (Last 24 Months)
- 6.5.1 Mergers, Acquisitions & Divestments
- 6.5.2 New Products, Services & Solutions in Table Tennis
- 6.5.3 Operational & Infrastructure Expansions
- 6.5.4 Strategic Alliances, Joint Ventures & Partnerships
- 6.5.5 Distribution Expansion & Market Entry
- 6.5.6 Sustainability & ESG Initiatives
- 6.6 Competitive Strategy Mapping
- 6.6.1 Leader, Challenger, Follower & Niche Classification
- 6.6.2 Pricing Strategy Comparison
- 6.6.3 Channel Strategy Matrix
Note: Strategic developments are included based on their materiality and the availability of reliable information.
Chapter 7. Global Table Tennis Market – By Sales & Delivery Channel
- 7.1 Segment Overview
- 7.1.1 Volume & Revenue Split by Channel (2024 & 2032) (Volume Where Applicable)
- 7.1.2 Channel Mix Evolution (2024-2032)
Chapter 8. Regional Market Analysis – Global Overview
- 8.1 Global Regional Overview
- 8.1.1 Regional Volume Share (Volume Where Applicable)
- 8.1.2 Regional Revenue Share
- 8.1.3 Regional Volume by Region (Volume Where Applicable)
- 8.1.4 Regional Revenue by Region
- 8.1.5 Regional Forecast Through 2032
- 8.2 Cross-Regional Segment Analysis
- 8.2.1 By Sales & Delivery Channel
- 8.2.2 By Competitive Positioning & Price Tier
Chapter 9. North America Table Tennis Market
- 9.1 United States
- 9.2 Canada
- 9.3 Mexico
Chapter 10. Europe Table Tennis Market
- 10.1 Germany
- 10.2 France
- 10.3 Italy
- 10.4 United Kingdom
- 10.5 Spain
- 10.6 Poland
- 10.7 Russia
- 10.8 Netherlands
- 10.9 Belgium
- 10.10 Sweden
- 10.11 Denmark
- 10.12 Norway
- 10.13 Rest of Europe
Chapter 11. Asia Pacific Table Tennis Market
- 11.1 China
- 11.2 India
- 11.3 Japan
- 11.4 South Korea
- 11.5 Thailand
- 11.6 Indonesia
- 11.7 Vietnam
- 11.8 Malaysia
- 11.9 Australia
- 11.10 Rest of Asia Pacific
Chapter 12. Latin America Table Tennis Market
- 12.1 Brazil
- 12.2 Argentina
- 12.3 Colombia
- 12.4 Chile
- 12.5 Rest of Latin America
Chapter 13. Middle East Table Tennis Market
- 13.1 Saudi Arabia
- 13.2 United Arab Emirates
- 13.3 Turkey
- 13.4 Israel
- 13.5 Iran
- 13.6 Rest of the Middle East
Chapter 14. Africa Table Tennis Market
- 14.1 South Africa
- 14.2 Egypt
- 14.3 Nigeria
- 14.4 Morocco
- 14.5 Rest of Africa
Chapter 15. Table Tennis Company Profiles
- 15.1 [Company 01]
- 15.1.1 Company Overview
- 15.1.2 Key Management Personnel
- 15.1.3 Products & Services Portfolio
- 15.1.4 Financial Performance
- 15.1.5 Key Market Focus & Geographic Presence
- 15.1.6 Recent Developments & Strategic Initiatives
Note: The company profile list is preliminary and may change based on research findings, market developments, data availability, and client requirements.
Chapter 16. Appendices
- Appendix A – List of Abbreviations & Acronyms
- Appendix B – Industry Classification Code Reference – Full Series
- Appendix C – Supply, Output & Operating Capacity Data Tables
- Appendix D – End-Use & Demand Base Tables
- Appendix E – Demand, Adoption & Usage Assumptions
- Appendix F – Pricing & Revenue Metric Reference Tables
- Appendix G – Company Operations & Infrastructure Database
- Appendix H – Cross-Border Trade & Activity Data Tables (Where Applicable)
- Appendix I – Regulatory Summary Tables
- Appendix J – Primary Research Participant List (Anonymized)
- Appendix K – Primary Research Questionnaire Framework
- Appendix L – Data Sources & Bibliography
- Appendix M – Market Size Divergence & Source Comparison
Chapter 17. Research Methodology
- 17.1 Research Framework & Philosophy
- 17.2 Secondary Research – Sources, Hierarchy & Data Extraction
- 17.3 Data Modeling – Bottom-Up & Top-Down Market Sizing
- 17.4 Primary Research – Stakeholder Framework, LOI & Sample Sizes
- 17.5 Forecast Methodology – Regression, Scenario & Sensitivity Analysis
- 17.6 Quality Control – Four-Layer Validation Framework
- 17.7 Limitations & Standard Assumptions
- 17.8 Disclaimer
