
Market Overview:
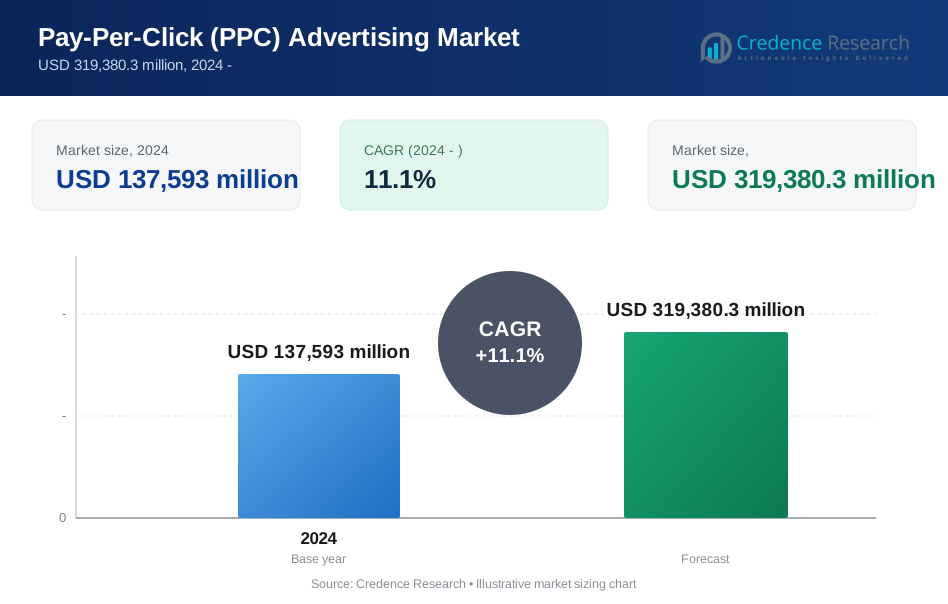
The Pay-per-click (PPC) Advertising Market is projected to grow from USD 137,593 million in 2024 to USD 319,380.3 million by 2032. The market is expected to register a compound annual growth rate of 11.1% from 2024 to 2032. Growth reflects rising digital ad spend and performance-based marketing demand across industries.
| REPORT ATTRIBUTE | DETAILS |
|---|---|
| Historical Period | 2020-2023 |
| Base Year | 2024 |
| Forecast Period | 2025-2032 |
| Pay-Per-Click (PPC) Advertising Market Size 2024 | USD 137,593 million |
| Pay-Per-Click (PPC) Advertising Market, CAGR | 11.1% |
| Pay-Per-Click (PPC) Advertising Market Size 2032 | USD 319,380.3 million |
Strong demand for measurable marketing outcomes drives PPC advertising adoption across sectors. Brands seek precise audience targeting and real-time campaign control. Search engines and social platforms expand ad formats and analytics tools. Mobile usage growth increases click-based ad visibility and conversion rates. E-commerce firms rely on PPC to boost traffic and sales quickly. Automation and AI improve bid management and keyword optimization. Small and mid-sized firms favor PPC due to flexible budgets and faster returns.
North America leads the market due to advanced digital infrastructure and high advertiser maturity. The United States dominates with strong adoption across retail, technology, and services. Europe follows, supported by widespread SME participation and strong online commerce. Asia-Pacific emerges rapidly, driven by rising internet users and mobile-first markets. China and India show strong momentum due to platform innovation and startup growth. Latin America and the Middle East gain traction as digital adoption expands.

Market Insights:
- The market reached USD 137,593 million in 2024 and is projected to reach USD 319,380.3 million by 2032, growing at a CAGR of 11.1%.
- North America leads with about 40% share due to mature adtech, high digital spend, and strong enterprise adoption.
- Europe holds nearly 25% share, supported by strong SME participation, e-commerce growth, and regulatory-driven digital shift.
- Asia-Pacific accounts for around 30% share and remains the fastest-growing region, driven by mobile-first users, e-commerce scale, and SME digitalization.
- By segment, search engine advertising holds about 55% share due to high intent traffic, while mobile devices contribute nearly 60% share due to smartphone-led engagement.
Market Drivers:
Rising Demand For Measurable And Performance-Based Digital Advertising Outcomes
Brands seek clear links between ad spend and business outcomes. PPC enables direct tracking of clicks and conversions. Marketers value budget control and measurable returns. The Pay-per-click (PPC) Advertising Market benefits from this accountability focus. It supports quick campaign adjustments based on performance data. Enterprises reduce wasted spend through keyword precision. Management teams favor channels with transparent metrics. This demand sustains long-term adoption across industries.
- For instance, Google reports that advertisers using automated bidding strategies which are powered by conversion tracking achieve 20–40% better performance compared to manual bidding. Additionally, implementing Performance Max campaigns, which require conversion data to function, delivers an average of 18% more conversions at a similar cost per action.
Growth Of E-Commerce And Digital-First Customer Acquisition Strategies
Online retailers depend on paid search for traffic growth. PPC supports product visibility during purchase intent moments. Digital-native brands rely on fast audience reach. The Pay-per-click (PPC) Advertising Market aligns with online sales cycles. It helps brands compete in crowded digital shelves. Seasonal promotions gain traction through paid listings. Customer acquisition costs remain manageable with optimization. E-commerce expansion keeps demand steady.
- For instance, Amazon's internal data from 2022 indicates that small businesses using Amazon Ads experience a 30% increase in sales. Additionally, Amazon Ads has reported that 35% of surveyed shoppers discover new brands on the platform through its advertising services.
Expansion Of Search Engines And Social Media Advertising Ecosystems
Major platforms expand paid advertising capabilities. Search engines refine keyword and intent matching systems. Social media platforms integrate click-based formats. The Pay-per-click (PPC) Advertising Market gains scale through platform innovation. It supports diverse campaign objectives across channels. Video and display ads widen use cases. Cross-platform reach improves campaign efficiency. Platform growth drives advertiser participation.
Adoption By Small And Mid-Sized Businesses Seeking Scalable Marketing Tools
SMEs prefer flexible and scalable marketing options. PPC allows budget control without long commitments. Campaigns scale with business growth stages. The Pay-per-click (PPC) Advertising Market attracts cost-sensitive advertisers. It supports local and niche targeting needs. SMEs gain visibility against larger brands. Simple setup reduces entry barriers. This segment strengthens market breadth.
Market Trends:
Growing Use Of Automation And Smart Bidding Across Campaign Management
Advertisers adopt automated bidding strategies. Platforms deploy machine learning for bid optimization. Smart tools reduce manual workload. The Pay-per-click (PPC) Advertising Market reflects higher automation use. It improves campaign efficiency and consistency. Advertisers focus more on strategy decisions. Automation supports real-time bid adjustments. This trend reshapes campaign execution models.
- For instance, Google Ads reports that Smart Bidding delivers an average 15% increase in conversions compared with manual bidding.
Shift Toward Audience-Based Targeting Over Keyword-Only Approaches
Advertisers expand beyond keyword targeting methods. Audience data enhances ad relevance. Behavioral insights improve click quality. The Pay-per-click (PPC) Advertising Market adapts to data-driven targeting. It supports remarketing and lookalike audiences. Campaigns reach users across buying stages. Targeting precision improves engagement rates. This shift changes planning frameworks.
- For instance, one case study found that the e-commerce company Nomorerack saw its click-through rates increase as much as 42% when combining multi-product ads with Custom Audiences from their website.
Integration Of PPC With Omnichannel Digital Marketing Strategies
Brands align PPC with SEO and social media. Cross-channel strategies improve message consistency. PPC supports broader funnel objectives. The Pay-per-click (PPC) Advertising Market fits integrated marketing plans. It drives traffic to owned digital assets. Coordination improves attribution accuracy. Marketing teams seek unified performance views. Integration strengthens strategic value.
Rising Importance Of Creative Optimization And Ad Format Innovation
Advertisers test varied ad creatives frequently. Platforms support rich and interactive formats. Visual appeal affects click behavior. The Pay-per-click (PPC) Advertising Market evolves with creative focus. It rewards strong messaging clarity. Dynamic ads personalize user experiences. Creative testing becomes continuous. Format innovation boosts engagement.
Market Challenges Analysis:
Increasing Competition And Rising Cost Pressures Across Key Keywords
High advertiser density increases keyword competition. Popular terms command premium bid prices. Budget efficiency becomes harder to maintain. The Pay-per-click (PPC) Advertising Market faces margin pressure. It challenges small advertisers with limited budgets. Cost volatility complicates planning efforts. Brands need stronger optimization skills. Competitive intensity remains a core challenge.
Data Privacy Regulations And Reduced User Tracking Capabilities
Privacy laws restrict user data access. Third-party cookie limits affect targeting accuracy. Measurement becomes less precise over time. The Pay-per-click (PPC) Advertising Market adapts to compliance demands. It requires new attribution models. Advertisers face reduced audience visibility. Campaign personalization becomes complex. Regulatory shifts increase operational burden.
Market Opportunities:
Expansion In Emerging Digital Markets With Rising Internet Penetration
Developing regions add new online users rapidly. Businesses increase digital ad adoption. PPC offers fast market entry options. The Pay-per-click (PPC) Advertising Market can scale in these regions. It supports local language and geo-targeting. Mobile usage drives click-based engagement. Early adoption builds platform loyalty. Emerging markets offer strong growth scope.
Advancement Of AI-Driven Analytics And Predictive Campaign Insights
AI enhances forecasting and performance analysis. Predictive tools improve budget allocation. Campaign decisions become more data-led. The Pay-per-click (PPC) Advertising Market benefits from analytics progress. It supports proactive strategy planning. Advertisers gain deeper audience insights. Optimization cycles shorten significantly. Technology advances unlock new value.
Market Segmentation Analysis:
By Pricing Model
Bid-based PPC dominates due to flexible budget control and auction transparency. Advertisers adjust bids based on keyword value and competition. This model suits performance-driven campaigns across industries. Flat-rate PPC serves niche needs with predictable costs. Advertisers prefer this option for fixed placements and stable traffic goals. The Pay-per-click (PPC) Advertising Market supports both models to match varied risk profiles. It allows advertisers to balance cost certainty and performance focus.
- For instance, Google’s auction system allows bid updates within minutes, enabling real-time cost optimization.
By Platform
Search engine advertising leads due to high intent-driven traffic. Brands capture users during active purchase searches. Social media advertising expands reach through interest and behavior targeting. Display advertising supports brand visibility across publisher networks. Others, including shopping and remarketing, enhance conversion recovery. The Pay-per-click (PPC) Advertising Market benefits from platform diversity. It enables advertisers to align formats with campaign goals.
By Device
Desktop and laptops support detailed research and high-value conversions. Enterprises rely on this segment for B2B and complex purchases. Mobile shows strong growth due to app usage and local searches. Tablets serve specific user groups with moderate engagement levels. The Pay-per-click (PPC) Advertising Market adapts campaigns by device type. It improves relevance through device-based optimization strategies.
Segmentation:
- By Pricing Model
- Bid-based PPC
- Flat-rate PPC
- By Platform
- Search Engine Advertising
- Social Media Advertising
- Display Advertising
- Others (Shopping, Remarketing)
- By Device
- Desktop and Laptops
- Mobile
- Tablets
- By Region
- North America
- U.S.
- Canada
- Mexico
- Europe
- Germany
- France
- U.K.
- Italy
- Spain
- Rest of Europe
- Asia Pacific
- China
- Japan
- India
- South Korea
- South-east Asia
- Rest of Asia Pacific
- Latin America
- Brazil
- Argentina
- Rest of Latin America
- Middle East & Africa
- GCC Countries
- South Africa
- Rest of the Middle East and Africa
- North America
Regional Analysis:
North America And Europe: Mature Digital Ecosystems With High PPC Penetration
North America holds the largest share of the Pay-per-click (PPC) Advertising Market, with digital ad spending in the region contributing roughly 40% of global online advertising value, supported by high internet penetration and advanced adtech adoption. It benefits from strong participation by large enterprises and SMEs across retail, technology, and services. The United States leads in PPC spend, supported by robust e-commerce activity and sophisticated performance marketing strategies. Europe accounts for around 25% of global digital ad spending, driven by markets such as the U.K., Germany, and France. Regional growth reflects strong regulatory oversight, rising programmatic adoption, and steady migration from traditional media to digital channels. It shows high platform diversity and strong use of search, social, and display formats.
Asia-Pacific: Fast-Growing PPC Hub With Strong Mobile And E-Commerce Momentum
Asia-Pacific represents an estimated 25–30% share of global digital advertising spend, and the Pay-per-click (PPC) Advertising Market gains strong momentum from this base. China, India, Japan, and South Korea anchor growth through large online populations and mobile-first usage patterns. Regional advertisers invest heavily in search and shopping ads to capture e-commerce traffic. Local platforms and super-app ecosystems widen inventory and targeting options. Mobile PPC dominates due to extensive smartphone penetration and app-centric consumer journeys. It benefits from rapid digitalization of SMEs, government support for online business, and rising cross-border e-commerce flows. Regional competition among global and local platforms intensifies innovation in ad formats.
Latin America And Middle East & Africa: Emerging Regions With Expanding Digital Spend
Latin America contributes a smaller but growing share, estimated around 5–7% of global digital ad spending, led by Brazil and Mexico. Advertisers in these markets increase PPC budgets to support marketplace-led retail and fintech adoption. The Pay-per-click (PPC) Advertising Market in the Middle East and Africa accounts for a low- to mid-single-digit share of global spend but shows strong upside. Rising internet penetration, young digital-native populations, and smart city initiatives support higher online ad usage. Regional brands and governments embrace search and social PPC for outreach, tourism, and services promotion. It gains support from improving payment infrastructure and expansion of global platforms into local languages and formats.
Key Player Analysis:
- Google LLC (Alphabet Inc.)
- Microsoft Corporation (Bing)
- Meta Platforms, Inc.
- Baidu, Inc.
Competitive Analysis:
The Pay-per-click (PPC) Advertising Market shows high concentration around global digital platforms with strong technology depth. Google and Microsoft lead search-based PPC through advanced auction systems and analytics tools. Meta and Amazon strengthen competition through social and commerce-driven ad formats. It reflects strong platform differentiation based on data scale and user intent access. Leading players invest in automation, AI tools, and advertiser usability. Entry barriers remain high due to infrastructure and data requirements. Competition centers on performance accuracy, reach quality, and campaign optimization depth. Platform innovation sustains long-term leadership positions.
Recent Developments:
- In October 2025, Google confirmed the testing and rollout of "AI Mode" for Google Ads, a new placement allowing ads to appear within deep, conversational search results. As part of its 2025 updates, Google also introduced "AI Max," a campaign upgrade designed to blend reasoning capabilities with automated asset generation. This update allows advertisers to reach users asking complex, multi-step questions where traditional keyword targeting often falls short. Additionally, in September 2025, Google rolled out enhanced reporting features for Performance Max campaigns, finally giving advertisers visibility into asset-level performance and search partner breakdowns.
- In September 2025, Microsoft Advertising globally launched "Supplemental Feeds," a verified feature designed to streamline inventory management for retail advertisers. This update allows merchants to modify specific product attributes such as price, description, or custom labels without needing to re-upload their entire primary data feed. The tool was released to help advertisers react faster to market changes, such as flash sales or inventory shifts, by acting as an override layer that instantly updates ad content across the Microsoft Audience Network.
- In November 2025, Meta Platforms released "Partnership Ads 2.0" (formerly Branded Content Ads) alongside a new Creator Marketplace API. These verified updates give brands more granular control, such as the ability to toggle their brand name’s visibility in the ad header when collaborating with creators. Furthermore, Meta integrated "Andromeda AI" into its Advantage+ suite, a new automated testing tool that optimizes creative elements like headlines and aspect ratios in real-time to improve performance across Facebook and Instagram Reels.
Report Coverage:
The research report offers an in-depth analysis based on pricing model, platform type, and device usage. It details leading market players, providing an overview of their business, product offerings, investments, revenue streams, and key applications. Additionally, the report includes insights into the competitive environment, SWOT analysis, current market trends, as well as the primary drivers and constraints. Furthermore, it discusses various factors that have driven market expansion in recent years. The report also explores market dynamics, regulatory scenarios, and technological advancements that are shaping the industry. It assesses the impact of external factors and global economic changes on market growth. Lastly, it provides strategic recommendations for new entrants and established companies to navigate the complexities of the market.
Future Outlook:
- PPC adoption will rise with deeper digital commerce penetration.
- Automation will reshape bid and budget management practices.
- AI tools will improve targeting precision and conversion rates.
- Mobile-first campaigns will gain stronger budget allocation.
- Cross-platform campaign integration will become standard practice.
- Privacy-led targeting methods will gain importance.
- SME participation will expand through simplified ad tools.
- Creative testing will drive higher engagement outcomes.
- Emerging markets will attract increased advertiser focus.
- Platform competition will intensify through feature innovation.
Request a Free Sample
Fill in your details and we'll send you a free sample report.
- Sample data tables & charts
- Research methodology
Need a Custom Version of This Report?
Tailor the scope, geography, or segments to your exact requirements.
- Custom geography or segment scope
- Direct access to our analyst team
Frequently Asked Questions
What is the current market size for Pay-per-click (PPC) Advertising Market, and what is its projected size in 2032?
At what Compound Annual Growth Rate is the Pay-per-click (PPC) Advertising Market projected to grow between 2025 and 2032?
Which Pay-per-click (PPC) Advertising Market segment held the largest share in 2024?
What are the primary factors fueling the growth of the Pay-per-click (PPC) Advertising Market?
Who are the leading companies in the Pay-per-click (PPC) Advertising Market?
Which region commanded the largest share of the Pay-per-click (PPC) Advertising Market in 2024?
Table of Content
Chapter 1. Report Introduction
- 1.1 Report Description & Purpose
- 1.1.1 Report Title & Market Definition
- 1.1.2 Unique Selling Propositions (USP) & Key Differentiators
- 1.1.3 Value Proposition for Stakeholders
- 1.2 Research Objectives
- 1.2.1 Market Sizing Objectives (Volume & Revenue) (Volume Where Applicable)
- 1.2.2 Segmentation Objectives
- 1.2.3 Competitive Intelligence Objectives
- 1.2.4 Forecast & Scenario Objectives
- 1.3 Report Scope
- 1.3.1 Pay-Per-Click (PPC) Advertising Scope – Segments & Subsegments Covered
- 1.3.2 Geographic Scope – Regions & Countries Covered
- 1.3.3 Historical Period, Base Year & Forecast Period (2024; forecast to 2032)
- 1.3.4 Inclusions & Exclusions
- 1.4 Industry Classification & Applicable Codes
- 1.5 Currency, Measurement Units & Valuation Basis
- 1.6 Target Stakeholders
- 1.7 Limitations & Assumptions
Chapter 2. Executive Summary
- 2.1 Global Pay-Per-Click (PPC) Advertising Market Snapshot
- 2.1.1 Market Size – Historical (2024) & Forecast (2024-2032) (2024: USD 137,593 million → 2032: USD 319,380.3 million)
- 2.1.2 Volume & Revenue – Global Totals (Volume Where Applicable)
- 2.1.3 Key Market Highlights – Top Five Facts
- 2.2 Pay-Per-Click (PPC) Advertising Market Segmentation Snapshot
- 2.2.1 Market Split by Region – 2024 vs. 2032
- 2.3 Competitive Snapshot
- 2.3.1 Top 10 Players by Revenue Share – 2024
- 2.3.2 Top 10 Players by Volume Share – 2024 (Volume Where Applicable)
- 2.3.3 Recent Strategic Developments (18-Month Summary)
- 2.4 Key Investment Highlights & Strategic Conclusions
Chapter 3. Pay-Per-Click (PPC) Advertising Market Dynamics & Industry Analysis
- 3.1 Market Overview & Context
- 3.1.1 Pay-Per-Click (PPC) Advertising Market Position in the Broader Industry Value Chain
- 3.1.2 Demand Structure & Purchasing Dynamics
- 3.1.3 Market Maturity & Development Stage by Region
- 3.2 Pay-Per-Click (PPC) Advertising Market Drivers
- 3.3 Pay-Per-Click (PPC) Advertising Market Restraints & Challenges
- 3.4 Pay-Per-Click (PPC) Advertising Market Opportunities
- 3.5 Porter's Five Forces Analysis
- 3.5.1 Threat of New Entrants
- 3.5.2 Bargaining Power of Suppliers
- 3.5.3 Bargaining Power of Buyers
- 3.5.4 Threat of Substitutes
- 3.5.5 Competitive Rivalry – Intensity Assessment
- 3.6 Pay-Per-Click (PPC) Advertising Value Chain Analysis
- 3.6.1 Upstream – Key Inputs, Resources & Suppliers
- 3.6.1.1 Key Input/Resource 1
- 3.6.1.2 Key Input/Resource 2
- 3.6.1.3 Key Input/Resource 3
- 3.6.2 Midstream – Core Operations & Value Creation
- 3.6.2.1 Operating Model & Process Overview
- 3.6.2.2 Key Operating Locations & Capabilities by Company
- 3.6.3 Downstream – Market Channels & End Users
- 3.6.3.1 Direct Sales & Customer Engagement Channels
- 3.6.3.2 Indirect Sales, Intermediaries & Partner Channels
- 3.6.4 Value Chain Profitability Analysis
- 3.6.1 Upstream – Key Inputs, Resources & Suppliers
- 3.7 PESTEL Analysis
- 3.7.1 Political Factors
- 3.7.2 Economic Factors
- 3.7.3 Social Factors
- 3.7.4 Technological Factors
- 3.7.5 Environmental Factors
- 3.7.6 Legal Factors
- 3.8 Pay-Per-Click (PPC) Advertising Supply Chain Analysis
- 3.8.1 Critical Input & Resource Availability Risk Assessment
- 3.8.2 Supplier & Operational Concentration Risk (Geographic Exposure)
- 3.8.3 Supply & Service Disruption Impact Analysis
- 3.9 Regulatory & Policy Landscape
Note: The regulatory and policy landscape section covers regulations based on their applicability to the market, Pay-Per-Click (PPC) Advertising category, geography, and scope of the study. Only regulatory frameworks with a material impact on operations, compliance, trade, sustainability, or market access are analyzed in detail.
Chapter 4. Key Investment Pockets & Opportunity Analysis
- 4.1 Pay-Per-Click (PPC) Advertising Market Attractiveness Analysis
- 4.1.1 By Region – Investment Attractiveness Matrix (Market Size × CAGR)
- 4.2 Absolute Revenue Growth Opportunity
- 4.2.1 By Region – Absolute Revenue Growth Through 2032
- 4.3 Incremental Demand Opportunity
- 4.3.1 By Region – Incremental Demand Through 2032
- 4.3.2 Segment – Incremental Demand
- 4.4 Emerging Submarket Opportunity Deep Dive (Subject to Applicability)
- 4.5 Priority Market Opportunity Scorecards
- 4.5.1 United States
- 4.5.2 Europe
- 4.5.3 Asia
- 4.5.4 Middle East & Africa
Note: Priority market opportunity scorecards reflect the geographic scope and strategic relevance of the study. Listed markets are indicative and may be adapted to the industry.
Chapter 5. Pay-Per-Click (PPC) Advertising Cross-Border Trade & Market Access Analysis
- 5.1 International Trade & Cross-Border Activity Overview
- 5.1.1 Global Export Value by Country (2024)
- 5.1.2 Global Export Volume by Country (2024) (Volume Where Applicable)
- 5.1.3 Global Import Value by Country (2024)
- 5.1.4 Global Import Volume by Country (2024) (Volume Where Applicable)
- 5.1.5 Net Trade Balance by Country (2024)
- 5.2 Export Analysis – Segment
- 5.2.1 Category 1 (Applicable Classification Code)
- 5.2.2 Category 2 (Applicable Classification Code)
- 5.2.3 Category 3 (Applicable Classification Code)
- 5.2.4 Category 4 (Applicable Classification Code)
- 5.2.5 Category 5 (Applicable Classification Code)
- 5.3 Import Analysis – Segment
- 5.3.1 Category 1 (Applicable Classification Code)
- 5.3.2 Category 2 (Applicable Classification Code)
- 5.3.3 Category 3 (Applicable Classification Code)
- 5.3.4 Category 4 (Applicable Classification Code)
- 5.3.5 Category 5 (Applicable Classification Code)
- 5.4 Cross-Border Pricing & Transaction Benchmarks
- 5.4.1 Export Pricing – Segment & Country
- 5.4.2 Import Pricing – Segment & Source Country
- 5.4.3 Price Trends (2024)
- 5.5 Key Cross-Border Trade & Delivery Routes
- 5.5.1 Cross-Border Trade/Delivery Route 1
- 5.5.2 Cross-Border Trade/Delivery Route 2
- 5.5.3 Cross-Border Trade/Delivery Route 3
- 5.5.4 Cross-Border Trade/Delivery Route 4
- 5.5.5 Cross-Border Trade/Delivery Route 5
- 5.6 Trade Policy & Market Access Impact Assessment
- 5.6.1 Tariff & Non-Tariff Barriers
- 5.6.2 Regional Trade & Economic Integration Frameworks
- 5.6.3 Bilateral & Multilateral Trade Agreements
- 5.6.4 Cross-Border Operating, Licensing & Localization Requirements
Note: This chapter applies where cross-border trade or delivery is relevant to Pay-Per-Click (PPC) Advertising. Goods, services, and digital offerings are assessed using applicable classifications and transaction measures. Import-export volumes, trade balances, and route analyses are included only where meaningful to the market.
Chapter 6. Competitive Landscape & Company Benchmarking
- 6.1 Pay-Per-Click (PPC) Advertising Market Concentration & Structure
- 6.1.1 Herfindahl-Hirschman Index (HHI) – vs. 2024
- 6.1.2 Leading, Mid-Sized & Emerging Player Structure
- 6.1.3 Global, Regional & Local Player Dynamics
- 6.2 Pay-Per-Click (PPC) Advertising Market Share Analysis – 2024
- 6.2.1 Global Revenue Share by Company
- 6.2.2 Global Volume Share by Company (Volume Where Applicable)
- 6.2.3 Regional Revenue Share
- 6.2.4 Market Share Evolution ( vs. 2024)
- 6.2.5 Company Market Share by Key Segment
- 6.2.6 Company Market Share by Customer Group
- 6.3 Operating Scale, Capacity & Infrastructure Analysis
- 6.3.1 Global Operating Scale & Supply Capacity
- 6.3.2 Resource Utilization & Operating Efficiency
- 6.3.3 Output, Service Delivery & Activity Metrics
- 6.3.4 Operating Footprint & Infrastructure Map
- 6.3.5 Planned Operational & Capacity Expansion
- 6.4 Pay-Per-Click (PPC) Advertising Competitive Benchmarking Matrix
- 6.4.1 Revenue, Growth, Profitability & Operating Metric Comparison
- 6.4.2 Channel Revenue Mix
- 6.4.3 Geographic Revenue Exposure
- 6.4.4 R&D Intensity
- 6.4.5 Sustainability Maturity
- 6.5 Strategic Developments in Pay-Per-Click (PPC) Advertising (Last 24 Months)
- 6.5.1 Mergers, Acquisitions & Divestments
- 6.5.2 New Products, Services & Solutions in Pay-Per-Click (PPC) Advertising
- 6.5.3 Operational & Infrastructure Expansions
- 6.5.4 Strategic Alliances, Joint Ventures & Partnerships
- 6.5.5 Distribution Expansion & Market Entry
- 6.5.6 Sustainability & ESG Initiatives
- 6.6 Competitive Strategy Mapping
- 6.6.1 Leader, Challenger, Follower & Niche Classification
- 6.6.2 Pricing Strategy Comparison
- 6.6.3 Channel Strategy Matrix
Note: Strategic developments are included based on their materiality and the availability of reliable information.
Chapter 7. Global Pay-Per-Click (PPC) Advertising Market – By Sales & Delivery Channel
- 7.1 Segment Overview
- 7.1.1 Volume & Revenue Split by Channel (2024 & 2032) (Volume Where Applicable)
- 7.1.2 Channel Mix Evolution (2024-2032)
Chapter 8. Regional Market Analysis – Global Overview
- 8.1 Global Regional Overview
- 8.1.1 Regional Volume Share (Volume Where Applicable)
- 8.1.2 Regional Revenue Share
- 8.1.3 Regional Volume by Region (Volume Where Applicable)
- 8.1.4 Regional Revenue by Region
- 8.1.5 Regional Forecast Through 2032
- 8.2 Cross-Regional Segment Analysis
- 8.2.1 By Sales & Delivery Channel
- 8.2.2 By Competitive Positioning & Price Tier
Chapter 9. North America Pay-Per-Click (PPC) Advertising Market
- 9.1 United States
- 9.2 Canada
- 9.3 Mexico
Chapter 10. Europe Pay-Per-Click (PPC) Advertising Market
- 10.1 Germany
- 10.2 France
- 10.3 Italy
- 10.4 United Kingdom
- 10.5 Spain
- 10.6 Poland
- 10.7 Russia
- 10.8 Netherlands
- 10.9 Belgium
- 10.10 Sweden
- 10.11 Denmark
- 10.12 Norway
- 10.13 Rest of Europe
Chapter 11. Asia Pacific Pay-Per-Click (PPC) Advertising Market
- 11.1 China
- 11.2 India
- 11.3 Japan
- 11.4 South Korea
- 11.5 Thailand
- 11.6 Indonesia
- 11.7 Vietnam
- 11.8 Malaysia
- 11.9 Australia
- 11.10 Rest of Asia Pacific
Chapter 12. Latin America Pay-Per-Click (PPC) Advertising Market
- 12.1 Brazil
- 12.2 Argentina
- 12.3 Colombia
- 12.4 Chile
- 12.5 Rest of Latin America
Chapter 13. Middle East Pay-Per-Click (PPC) Advertising Market
- 13.1 Saudi Arabia
- 13.2 United Arab Emirates
- 13.3 Turkey
- 13.4 Israel
- 13.5 Iran
- 13.6 Rest of the Middle East
Chapter 14. Africa Pay-Per-Click (PPC) Advertising Market
- 14.1 South Africa
- 14.2 Egypt
- 14.3 Nigeria
- 14.4 Morocco
- 14.5 Rest of Africa
Chapter 15. Pay-Per-Click (PPC) Advertising Company Profiles
- 15.1 [Company 01]
- 15.1.1 Company Overview
- 15.1.2 Key Management Personnel
- 15.1.3 Products & Services Portfolio
- 15.1.4 Financial Performance
- 15.1.5 Key Market Focus & Geographic Presence
- 15.1.6 Recent Developments & Strategic Initiatives
Note: The company profile list is preliminary and may change based on research findings, market developments, data availability, and client requirements.
Chapter 16. Appendices
- Appendix A – List of Abbreviations & Acronyms
- Appendix B – Industry Classification Code Reference – Full Series
- Appendix C – Supply, Output & Operating Capacity Data Tables
- Appendix D – End-Use & Demand Base Tables
- Appendix E – Demand, Adoption & Usage Assumptions
- Appendix F – Pricing & Revenue Metric Reference Tables
- Appendix G – Company Operations & Infrastructure Database
- Appendix H – Cross-Border Trade & Activity Data Tables (Where Applicable)
- Appendix I – Regulatory Summary Tables
- Appendix J – Primary Research Participant List (Anonymized)
- Appendix K – Primary Research Questionnaire Framework
- Appendix L – Data Sources & Bibliography
- Appendix M – Market Size Divergence & Source Comparison
Chapter 17. Research Methodology
- 17.1 Research Framework & Philosophy
- 17.2 Secondary Research – Sources, Hierarchy & Data Extraction
- 17.3 Data Modeling – Bottom-Up & Top-Down Market Sizing
- 17.4 Primary Research – Stakeholder Framework, LOI & Sample Sizes
- 17.5 Forecast Methodology – Regression, Scenario & Sensitivity Analysis
- 17.6 Quality Control – Four-Layer Validation Framework
- 17.7 Limitations & Standard Assumptions
- 17.8 Disclaimer
