
Market Overview:
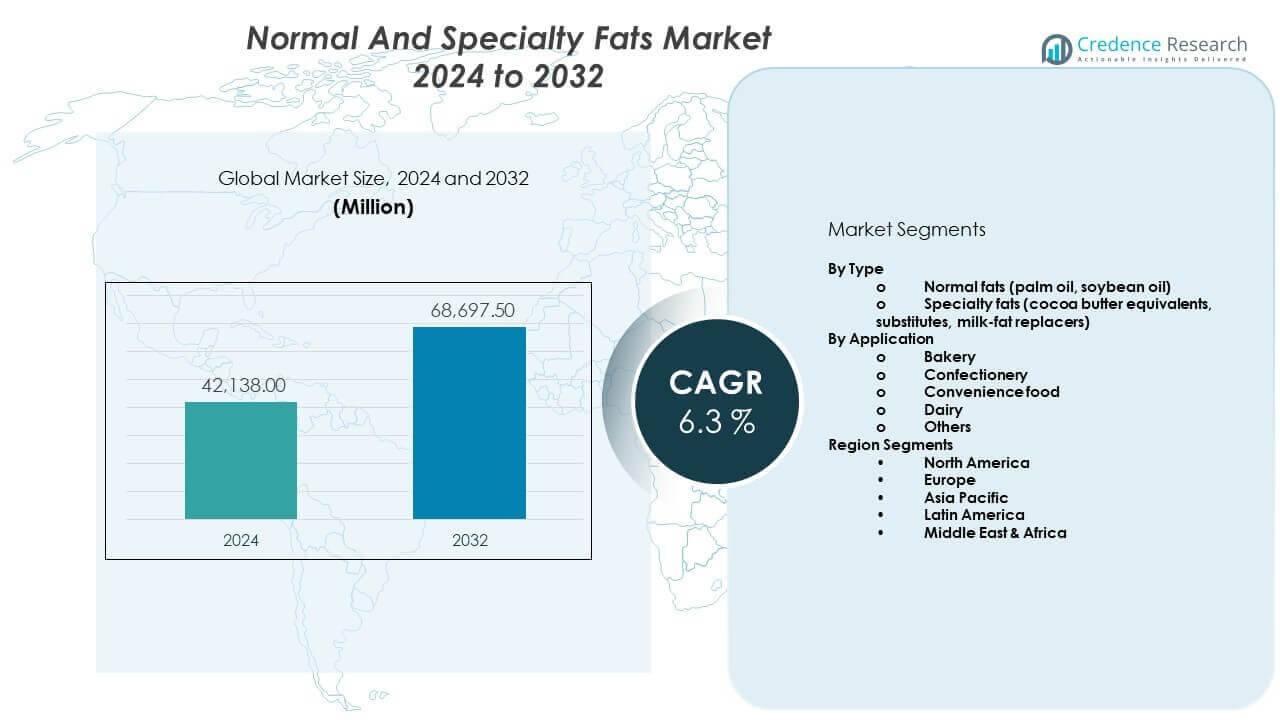
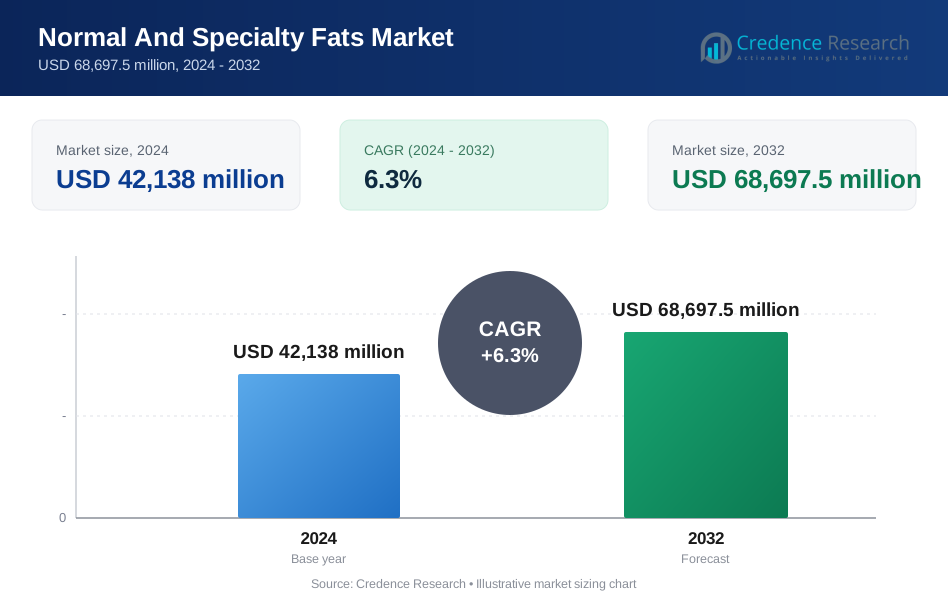
The Normal and specialty fats market is projected to grow from USD 42,138 million in 2024 to USD 68,697.5 million by 2032, registering a CAGR of 6.3% from 2024 to 2032.
| REPORT ATTRIBUTE | DETAILS |
|---|---|
| Historical Period | 2020-2023 |
| Base Year | 2024 |
| Forecast Period | 2025-2032 |
| Normal And Specialty Fats Market Size 2024 | USD 42,138 million |
| Normal And Specialty Fats Market, CAGR | 6.3% |
| Normal And Specialty Fats Market Size 2032 | USD 68,697.5 million |
Market drivers include rising consumption of processed and convenience foods across urban populations. Bakery and confectionery producers rely on specialty fats for consistency, mouthfeel, and heat stability. Foodservice expansion increases demand for frying and shortening fats with improved performance. Health awareness pushes producers to reformulate products with trans-fat-free and low-saturated-fat options. Plant-based food growth also supports demand for functional fat systems. Innovation in enzymatic interesterification improves quality without chemical processing. Strong focus on taste retention sustains long-term adoption.
Europe leads the market due to strong bakery, chocolate, and dairy substitute industries. Western European countries show high use of specialty fats in premium food products. Asia Pacific emerges as a fast-growing region, driven by processed food demand in China and India. Expanding middle-class populations support volume growth. Southeast Asia benefits from palm oil availability and local refining capacity. North America maintains steady demand through packaged foods and foodservice channels. Latin America and the Middle East show rising adoption due to industrial food expansion.
Market Insights:
- The market overview shows growth from USD 42,138 million in 2024 to USD 68,697.5 million by 2032, at a CAGR of 6.3%, driven by processed food and specialty applications.
- Asia Pacific leads with about 32% share due to population scale and palm oil availability, Europe follows with nearly 30% from bakery and confectionery strength, and North America holds around 28% supported by packaged food demand.
- Asia Pacific is also the fastest-growing region, holding about 32% share, supported by urbanization, food processing expansion, and rising convenience food consumption.
- By type, normal fats account for nearly 60% share due to high use in frying and mass food production, while specialty fats hold about 40% driven by confectionery and dairy alternatives.
- By application, bakery and confectionery together contribute around 45% share, while convenience food and dairy account for nearly 40% due to stable industrial demand.
Market Drivers:
Rising Demand From Bakery, Confectionery, And Processed Food Applications
The Normal and specialty fats market benefits from strong bakery and confectionery demand. Manufacturers rely on fats to control texture and mouthfeel. Specialty fats support uniform quality across large batches. Processed food producers prefer stable fat performance. Shelf life expectations drive consistent fat selection. Chocolate makers depend on precise melting behavior. Industrial baking values predictable results. Product consistency remains a key buying factor.
- For instance, Cargill states specialty fats help deliver consistent crumb structure and volume in industrial baking.
Expansion Of Foodservice And Quick Service Restaurant Networks
Foodservice expansion increases demand for high-performance cooking fats. Restaurants need fats with strong heat tolerance. Specialty fats reduce breakdown during repeated frying cycles. Large chains prefer standardized fat specifications. Taste consistency across outlets remains essential. Bulk procurement favors large suppliers. Supply reliability supports long-term contracts. Foodservice growth sustains steady consumption.
- For instance, Nestlé Professional highlights use of stable frying fats to maintain taste consistency across multiple outlets.
Shift Toward Trans-Fat-Free And Reformulated Fat Systems
Regulatory pressure drives removal of trans fats from foods. Producers reformulate recipes using specialty fats. The Normal and specialty fats market supports compliant alternatives. Interesterified fats replace older hydrogenated options. Reformulation protects brand credibility. Sensory quality remains a priority. Shelf stability requirements persist. Reformulation activity supports ongoing demand.
Growth Of Plant-Based And Dairy Alternative Food Categories
Plant-based foods require functional fat systems. Specialty fats help replicate dairy and meat textures. Melt behavior and structure drive fat selection. Vegan product launches increase fat usage. Neutral taste profiles gain importance. Export products need climate stability. Fat systems enable sensory alignment. Alternative foods expand demand scope.
Market Trends:
Increasing Use Of Customized Fat Blends For Specific End Products
Food manufacturers adopt application-specific fat blends. Customized solutions improve production efficiency. Specialty fats align with precise product needs. The Normal and specialty fats market adapts through tailored offerings. Producers enhance formulation expertise. Blends reduce additive dependence. Output consistency improves product quality. Customization strengthens supplier ties.
- For instance, AAK confirms custom fat blends reduce formulation complexity and support consistent output quality.
Growing Focus On Clean Label And Simplified Ingredient Lists
Brands simplify ingredient declarations to build trust. Specialty fats replace multiple functional additives. Clean labels attract health-aware buyers. Natural sourcing gains stronger focus. Palm alternatives receive growing attention. Transparency supports brand positioning. Simple formulations aid compliance. Label clarity shapes purchasing decisions.
- For instance, Nestlé states clean-label fat solutions support simpler formulations in processed foods.
Advancement In Enzymatic And Physical Processing Technologies
Manufacturers adopt enzymatic interesterification processes. These methods avoid harsh chemical catalysts. Process control improves batch accuracy. Trans-fat-free outputs gain reliability. Energy efficiency gains relevance. Equipment upgrades support scale. Quality consistency improves across runs. Technology adoption shapes competition.
Rising Demand For Heat-Stable Fats In Tropical And Export Markets
Export foods require temperature-resistant fat systems. Specialty fats maintain structure in warm climates. Snack and confectionery exports increase steadily. Producers select fats for climate resilience. Melting control supports logistics efficiency. Shelf life expectations rise. Regional climate needs guide formulations. Heat stability becomes essential.
Market Challenges Analysis:
Volatility In Raw Material Supply And Price Stability Risks
The Normal and specialty fats market faces raw material price volatility. Palm, soy, and sunflower oils show supply swings. Weather impacts crop availability. Price shifts affect contract planning. Margin pressure challenges producers. Supply disruptions increase risk exposure. Cost control becomes complex. Sourcing diversification gains importance.
Regulatory Scrutiny And Sustainability Compliance Pressure
Food regulations enforce strict fat composition standards. Sustainability rules influence sourcing choices. Certification raises operational costs. Palm oil scrutiny affects procurement strategies. Traceability needs system upgrades. Compliance adds financial pressure. Smaller firms face higher strain. Regulation shapes long-term planning.
Market Opportunities:
Product Innovation Through Functional And Health-Oriented Fat Solutions
Producers develop fats with improved nutrition profiles. Reduced saturated fat options gain demand. Specialty blends support functional positioning. The Normal and specialty fats market benefits from innovation. Health focus attracts premium buyers. Reformulated fats enable product upgrades. Innovation strengthens competitiveness. Functional demand opens new segments.
Expansion Across Emerging Economies And Local Food Manufacturing Hubs
Emerging economies expand packaged food production. Local bakeries scale industrial output. Specialty fats improve processing efficiency. Urbanization drives convenience food demand. Regional brands seek reliable suppliers. Distribution infrastructure improves access. Local partnerships reduce costs. Emerging markets offer strong growth potential.
Market Segmentation Analysis:
By Type
Normal fats include palm oil and soybean oil, which support large-scale food production. These fats offer cost efficiency and stable supply for everyday applications. Food processors prefer normal fats for frying and basic formulations. Specialty fats include cocoa butter equivalents, substitutes, and milk-fat replacers. These fats support texture control and melting precision. Chocolate and dairy alternative producers rely on specialty formulations. The Normal and specialty fats market balances volume-driven normal fats with value-driven specialty fats.
- For instance, Cargill balances volume-driven oils with value-driven specialty fats for varied food applications.
By Application
Bakery applications use fats to control softness, aeration, and shelf life. Specialty fats improve dough handling and product consistency. Confectionery applications depend on precise melting and snap characteristics. Cocoa butter alternatives support chocolate stability in varied climates. Convenience food producers select fats for heat resistance and processing stability. Dairy applications use milk-fat replacers to manage cost and consistency. Other applications include snacks and sauces, where fats support flavor release and mouthfeel. Each application drives tailored fat selection based on performance needs.
- For instance, AAK reports application-led fat design supports consistent quality across diverse food categories.
Segmentation:
By Type
- Normal fats (palm oil, soybean oil)
- Specialty fats (cocoa butter equivalents, substitutes, milk-fat replacers)
By Application
- Bakery
- Confectionery
- Convenience food
- Dairy
- Others
Region Segments
- North America
- U.S.
- Canada
- Mexico
- Europe
- Germany
- France
- U.K.
- Italy
- Spain
- Rest of Europe
- Asia Pacific
- China
- Japan
- India
- South Korea
- South-east Asia
- Rest of Asia Pacific
- Latin America
- Brazil
- Argentina
- Rest of Latin America
- Middle East & Africa
- GCC Countries
- South Africa
- Rest of the Middle East and Africa
Regional Analysis:
North America And Europe
North America holds around 28% market share due to strong processed food demand. The region relies on normal fats for packaged and convenience foods. Specialty fats support bakery and confectionery innovation. Europe accounts for nearly 30% market share, led by bakery and chocolate industries. Regulatory focus drives trans-fat-free formulations. Specialty fats see high adoption in premium food products. Mature supply chains support stable consumption patterns.
Asia Pacific
Asia Pacific represents about 32% market share and leads global consumption. The Normal and specialty fats market benefits from rising urban populations in this region. China and India drive volume demand through processed and packaged foods. Palm oil availability supports large-scale normal fat usage. Specialty fats gain traction in bakery and confectionery segments. Local food manufacturing capacity expands steadily. Cost-sensitive markets favor scalable fat solutions.
Latin America And Middle East & Africa
Latin America holds nearly 6% market share, supported by growing food processing industries. Brazil and Mexico lead regional demand. Bakery and dairy applications drive steady fat consumption. The Middle East & Africa accounts for about 4% market share. Import dependence shapes sourcing strategies. Confectionery and convenience foods support specialty fat demand. Population growth supports long-term expansion potential.
Key Player Analysis:
- Cargill, Incorporated
- Wilmar International
- Bunge Limited
- AAK AB
- Fuji Oil Holdings Inc.
Competitive Analysis:
The competitive landscape of the Normal and specialty fats market reflects a mix of global agribusiness firms and specialized ingredient producers. Large players focus on scale, supply security, and long-term contracts with food manufacturers. Product portfolios cover both normal fats for volume demand and specialty fats for high-margin applications. Firms invest in formulation expertise to support bakery, confectionery, and dairy alternatives. Cost control remains a key competitive factor. Sustainability sourcing and compliance shape supplier selection. Strategic partnerships with food brands strengthen market position. Innovation in processing methods supports differentiation. It remains moderately consolidated with strong entry barriers.
Recent Developments:
- In 24 Oct 2025, AAK AB announced a strategic joint venture with Malaysia-based Kuala Lumpur Kepong Berhad (KLK) to establish a specialty palm fractions production facility in Pasir Gudang, Malaysia. The joint venture, named Nura Specialty Oils and Fats (Nura), represents a significant strategic investment by AAK, with the company committing approximately SEK 300 million to be implemented over three years. Nura will focus on producing high-purity specialty palm fractions used in the manufacturing of cocoa butter alternatives (CBA), a key growth driver within AAK's Chocolate & Confectionery Fats business. The facility is expected to begin ramping up in 2028 and achieve full operational utilization by 2029. By broadening its supply base and reinforcing upstream integration with a dedicated production facility, Nura will complement AAK's longstanding supplier partnerships in the region, enhance supply chain resilience, and support the company's long-term profitable growth strategy in the specialty fats segment, particularly as demand for sustainable cocoa butter alternatives continues to rise globally.
- Bunge completed its transformational USD 8.2 billion merger with Viterra on July 2, 2025, following regulatory approvals from multiple jurisdictions including India's Competition Commission (July 29, 2024), the European Union (August 6, 2024), and China (2025). This landmark transaction creates one of the world's largest grain and oilseed handling companies, significantly expanding Bunge's capacity in oilseed processing and specialty fats production. The combined entity now operates more than 300 grain storage facilities, over 40 port terminals, and more than 155 processing, refining, and packaging facilities across more than 50 countries, employing over 37,000 people. In March 2024, parallel to progressing the Viterra merger, Bunge also acquired Westfälische Lebensmittelwerke Lindemann GmbH & Co. KG, a leading German supplier of oils and fats to the industrial and artisan bakery markets. The Lindemann acquisition strengthens Bunge's position in Northwestern Europe's bakery segment, allowing it to offer a broader portfolio of high-value specialty fats products and complementing its existing oil and fat business with enhanced capabilities in formula-based solutions for bakers and food manufacturers.
- Fuji Oil Holdings, through its North American subsidiary Blommer Chocolate Company, launched the Elevate product line on June 25, 2024, a breakthrough innovation in specialty chocolate coatings. Elevate represents a new category of cocoa butter equivalent (CBE) technology-based coatings designed specifically for the confectionery industry. The product was meticulously formulated using Fuji Oil's proprietary ingredient technologies to seamlessly integrate with traditional cocoa butter while offering superior bloom resistance, extended shelf life, and maintained visual appeal. Elevate delivers an economically viable alternative to traditional cocoa butter, particularly critical given the global cocoa production decline of 11% in 2024 and the resulting surge in cocoa butter prices. The coatings are engineered to provide a chocolate-like sensory experience with optimal flavor release and meltability, addressing industry challenges without compromising on quality or taste. Blommer showcased Elevate at the National IFT (Institute of Food Technologists) Conference in Chicago from July 15-17, 2024, generating significant interest among chocolatiers, confectioners, bakers, and food manufacturers seeking cost-effective and sustainable alternatives to traditional cocoa-based formulations.
Report Coverage:
The research report offers an in-depth analysis based on By Type and By Application. It details leading market players, providing an overview of their business, product offerings, investments, revenue streams, and key applications. Additionally, the report includes insights into the competitive environment, SWOT analysis, current market trends, as well as the primary drivers and constraints. Furthermore, it discusses various factors that have driven market expansion in recent years. The report also explores market dynamics, regulatory scenarios, and technological advancements that are shaping the industry. It assesses the impact of external factors and global economic changes on market growth. Lastly, it provides strategic recommendations for new entrants and established companies to navigate the complexities of the market.
Future Outlook:
- Demand from bakery and confectionery applications will continue to support steady market expansion.
- Specialty fats will gain wider adoption due to functional and formulation advantages.
- Clean label requirements will influence future product development strategies.
- Growth in plant-based foods will increase the use of tailored fat systems.
- Emerging economies will contribute significantly to volume growth.
- Sustainability sourcing practices will shape supplier selection decisions.
- Customized fat blends will see higher adoption across food applications.
- Technology upgrades will improve processing efficiency and product consistency.
- Foodservice sector demand will maintain stable consumption levels.
- Long-term supply contracts will strengthen relationships between producers and buyers.
Request a Free Sample
Fill in your details and we'll send you a free sample report.
- Sample data tables & charts
- Research methodology
Need a Custom Version of This Report?
Tailor the scope, geography, or segments to your exact requirements.
- Custom geography or segment scope
- Direct access to our analyst team
Frequently Asked Questions
What is the current market size for Normal and specialty fats market, and what is its projected size in 2032?
At what Compound Annual Growth Rate is the Normal and specialty fats market projected to grow between 2025 and 2032?
Which Normal and specialty fats market segment held the largest share in 2024?
What are the primary factors fueling the growth of the Normal and specialty fats market?
Who are the leading companies in the Normal and specialty fats market?
Which region commanded the largest share of the Normal and specialty fats market in 2024?
Table of Content
Chapter 1. Report Introduction
- 1.1 Report Description & Purpose
- 1.1.1 Report Title & Market Definition
- 1.1.2 Unique Selling Propositions (USP) & Key Differentiators
- 1.1.3 Value Proposition for Stakeholders
- 1.2 Research Objectives
- 1.2.1 Market Sizing Objectives (Volume & Revenue)
- 1.2.2 Segmentation Objectives
- 1.2.3 Competitive Intelligence Objectives
- 1.2.4 Forecast & Scenario Objectives
- 1.3 Report Scope
- 1.3.1 Normal And Specialty Fats Scope – Types & Subtypes Covered
- 1.3.2 Geographic Scope – Regions & Countries Covered
- 1.3.3 Historical Period, Base Year & Forecast Period (2024; forecast to 2032)
- 1.3.4 Inclusions & Exclusions
- 1.4 HS Code & Classification Framework
- 1.5 Currency, Units & Pricing Basis
- 1.6 Target Stakeholders
- 1.7 Limitations & Assumptions
Chapter 2. Executive Summary
- 2.1 Global Normal And Specialty Fats Market Snapshot
- 2.1.1 Market Size – Historical (2024) & Forecast (2024-2032) (2024: USD 42,138 million → 2032: USD 68,697.5 million)
- 2.1.2 Volume & Revenue – Global Totals
- 2.1.3 Key Market Highlights – Top Five Facts
- 2.2 Normal And Specialty Fats Market Segmentation Snapshot
- 2.2.1 Market Split by Region – 2024 vs. 2032
- 2.3 Competitive Snapshot
- 2.3.1 Top 10 Players by Revenue Share – 2024
- 2.3.2 Top 10 Players by Volume Share – 2024
- 2.3.3 Recent Strategic Developments (18-Month Summary)
- 2.4 Key Investment Highlights & Strategic Conclusions
Chapter 3. Normal And Specialty Fats Market Dynamics & Industry Analysis
- 3.1 Market Overview & Context
- 3.1.1 Normal And Specialty Fats Market Position in the Broader Automotive Value Chain
- 3.1.2 OEM vs. Replacement Market Dynamics
- 3.1.3 Market Maturity & Development Stage by Region
- 3.2 Normal And Specialty Fats Market Drivers
- 3.3 Normal And Specialty Fats Market Restraints & Challenges
- 3.4 Normal And Specialty Fats Market Opportunities
- 3.5 Porter's Five Forces Analysis
- 3.5.1 Threat of New Entrants
- 3.5.2 Bargaining Power of Suppliers
- 3.5.3 Bargaining Power of Buyers
- 3.5.4 Threat of Substitutes
- 3.5.5 Competitive Rivalry – Intensity Assessment
- 3.6 Normal And Specialty Fats Value Chain Analysis
- 3.6.1 Upstream – Raw Material/Input Suppliers
- 3.6.1.1 Raw Material/Input 1
- 3.6.1.2 Raw Material/Input 2
- 3.6.1.3 Raw Material/Input 3
- 3.6.2 Midstream – Production/Manufacturing/Service Delivery
- 3.6.2.1 Production/Process Overview
- 3.6.2.2 Key Facility Locations & Capacity by Manufacturer
- 3.6.3 Downstream – Distribution & End Consumer
- 3.6.3.1 Primary Channel – B2B/OEM
- 3.6.3.2 Secondary Channels – Dealer, Retail, Online, Direct
- 3.6.4 Value Chain Profitability Analysis
- 3.6.1 Upstream – Raw Material/Input Suppliers
- 3.7 PESTEL Analysis
- 3.7.1 Political Factors
- 3.7.2 Economic Factors
- 3.7.3 Social Factors
- 3.7.4 Technological Factors
- 3.7.5 Environmental Factors
- 3.7.6 Legal Factors
- 3.8 Normal And Specialty Fats Supply Chain Analysis
- 3.8.1 Raw Material/Input Supply Risk Assessment
- 3.8.2 Manufacturing Concentration Risk (Geographic Exposure)
- 3.8.3 Trade Disruption Impact Analysis
- 3.9 Regulatory & Policy Landscape
Note: The regulatory and policy landscape section covers regulations based on their applicability to the market, Normal And Specialty Fats category, geography, and scope of the study. Only regulatory frameworks with a material impact on operations, compliance, trade, sustainability, or market access are analyzed in detail.
Chapter 4. Key Investment Pockets & Opportunity Analysis
- 4.1 Normal And Specialty Fats Market Attractiveness Analysis
- 4.1.1 By Region – Investment Attractiveness Matrix (Volume × CAGR)
- 4.2 Absolute Revenue Growth Opportunity
- 4.2.1 By Region – Absolute USD Growth Through 2032
- 4.3 Incremental Volume Opportunity
- 4.3.1 By Region – Incremental Volume Through 2032
- 4.3.2 Segment – Incremental Volume
- 4.4 Emerging Submarket Opportunity Deep Dive (Subject to Applicability)
- 4.5 Emerging Market Opportunity Scorecards
- 4.5.1 United States
- 4.5.2 Europe
- 4.5.3 Asia
- 4.5.4 Middle East & Africa
Note: Emerging Market Opportunity Scorecards will be included based on relevance and strategic importance. Regions listed are indicative and may vary depending on data availability and market dynamics.
Chapter 5. Normal And Specialty Fats Import-Export Analysis & Trade Flows
- 5.1 Global Trade Overview
- 5.1.1 Global Export Value by Country (2024)
- 5.1.2 Global Export Volume by Country (2024)
- 5.1.3 Global Import Value by Country (2024)
- 5.1.4 Global Import Volume by Country (2024)
- 5.1.5 Net Trade Balance by Country (2024)
- 5.2 Export Analysis – Segment
- 5.2.1 Type 1 (HS Code)
- 5.2.2 Type 2 (HS Code)
- 5.2.3 Type 3 (HS Code)
- 5.2.4 Type 4 (HS Code)
- 5.2.5 Type 5 (HS Code)
- 5.3 Import Analysis – Segment
- 5.3.1 Type 1 (HS Code)
- 5.3.2 Type 2 (HS Code)
- 5.3.3 Type 3 (HS Code)
- 5.3.4 Type 4 (HS Code)
- 5.3.5 Type 5 (HS Code)
- 5.4 Average Unit Trade Prices
- 5.4.1 Average Export Price – Segment & Country
- 5.4.2 Average Import Price – Segment & Source Country
- 5.4.3 Price Trends (2024)
- 5.5 Key Trade Route Analysis
- 5.5.1 Trade Route 1
- 5.5.2 Trade Route 2
- 5.5.3 Trade Route 3
- 5.5.4 Trade Route 4
- 5.5.5 Trade Route 5
- 5.6 Trade Policy Impact Assessment
- 5.6.1 US Anti-Dumping & Section 301 Tariffs
- 5.6.2 EU Customs Union Impact
- 5.6.3 Major Free Trade Agreements
- 5.6.4 USMCA Rules of Origin
Note: Trade policy analysis will be included only where relevant to the Normal And Specialty Fats market.
Chapter 6. Competitive Landscape & Company Benchmarking
- 6.1 Normal And Specialty Fats Market Concentration & Structure
- 6.1.1 Herfindahl-Hirschman Index (HHI) – vs. 2024
- 6.1.2 Tier 1, Tier 2 & Tier 3 Market Structure
- 6.1.3 Global, Regional & Local Player Dynamics
- 6.2 Normal And Specialty Fats Market Share Analysis – 2024
- 6.2.1 Global Revenue Share by Company
- 6.2.2 Global Volume Share by Company
- 6.2.3 Regional Revenue Share
- 6.2.4 Market Share Evolution ( vs. 2024)
- 6.2.5 OEM Segment Share by Company
- 6.2.6 Replacement Segment Share by Company
- 6.3 Production/Delivery Capacity & Facility Analysis
- 6.3.1 Global Installed Capacity
- 6.3.2 Capacity Utilization Rates
- 6.3.3 Production/Output Volume
- 6.3.4 Facility Locations & Capacity Map
- 6.3.5 Planned Capacity Additions
- 6.4 Normal And Specialty Fats Competitive Benchmarking Matrix
- 6.4.1 Revenue, Volume, CAGR & Profitability Comparison
- 6.4.2 Channel Revenue Mix
- 6.4.3 Geographic Revenue Exposure
- 6.4.4 R&D Intensity
- 6.4.5 Sustainability Maturity
- 6.5 Strategic Developments in Normal And Specialty Fats (Last 24 Months)
- 6.5.1 Mergers, Acquisitions & Divestments
- 6.5.2 New Normal And Specialty Fats Launches
- 6.5.3 Facility Expansions
- 6.5.4 Strategic Alliances, Joint Ventures & Partnerships
- 6.5.5 Distribution Expansion & Market Entry
- 6.5.6 Sustainability & ESG Initiatives
- 6.6 Competitive Strategy Mapping
- 6.6.1 Leader, Challenger, Follower & Niche Classification
- 6.6.2 Pricing Strategy Comparison
- 6.6.3 Channel Strategy Matrix
Note: Strategic developments are included based on their materiality and the availability of reliable information.
Chapter 7. Global Normal And Specialty Fats Market – By Distribution Channel
- 7.1 Segment Overview
- 7.1.1 Volume & Revenue Split by Channel (2024 & 2032)
- 7.1.2 Channel Mix Evolution (2024-2032)
Chapter 8. Regional Market Analysis – Global Overview
- 8.1 Global Regional Overview
- 8.1.1 Regional Volume Share
- 8.1.2 Regional Revenue Share
- 8.1.3 Regional Volume by Region
- 8.1.4 Regional Revenue by Region
- 8.1.5 Regional Forecast Through 2032
- 8.2 Cross-Regional Segment Analysis
- 8.2.1 By Distribution Channel
- 8.2.2 By Brand/Price Tier
Chapter 9. North America Normal And Specialty Fats Market
- 9.1 United States
- 9.2 Canada
- 9.3 Mexico
Chapter 10. Europe Normal And Specialty Fats Market
- 10.1 Germany
- 10.2 France
- 10.3 Italy
- 10.4 United Kingdom
- 10.5 Spain
- 10.6 Poland
- 10.7 Russia
- 10.8 Netherlands
- 10.9 Belgium
- 10.10 Sweden
- 10.11 Denmark
- 10.12 Norway
- 10.13 Rest of Europe
Chapter 11. Asia Pacific Normal And Specialty Fats Market
- 11.1 China
- 11.2 India
- 11.3 Japan
- 11.4 South Korea
- 11.5 Thailand
- 11.6 Indonesia
- 11.7 Vietnam
- 11.8 Malaysia
- 11.9 Australia
- 11.10 Rest of Asia Pacific
Chapter 12. Latin America Normal And Specialty Fats Market
- 12.1 Brazil
- 12.2 Argentina
- 12.3 Colombia
- 12.4 Chile
- 12.5 Rest of Latin America
Chapter 13. Middle East Normal And Specialty Fats Market
- 13.1 Saudi Arabia
- 13.2 United Arab Emirates
- 13.3 Turkey
- 13.4 Israel
- 13.5 Iran
- 13.6 Rest of the Middle East
Chapter 14. Africa Normal And Specialty Fats Market
- 14.1 South Africa
- 14.2 Egypt
- 14.3 Nigeria
- 14.4 Morocco
- 14.5 Rest of Africa
Chapter 15. Normal And Specialty Fats Company Profiles
- 15.1 [Company 01]
- 15.1.1 Company Overview
- 15.1.2 Key Management Personnel
- 15.1.3 Products & Services Portfolio
- 15.1.4 Financial Performance
- 15.1.5 Key Market Focus & Geographic Presence
- 15.1.6 Recent Developments & Strategic Initiatives
Note: The company profile list is preliminary and may change based on research findings, market developments, data availability, and client requirements.
Chapter 16. Appendices
- Appendix A – List of Abbreviations & Acronyms
- Appendix B – Industry Classification Code Reference – Full Series
- Appendix C – Production & Capacity Data Tables
- Appendix D – End-Use & Demand Base Tables
- Appendix E – Consumption & Replacement Rate Assumptions
- Appendix F – ASP Reference Tables
- Appendix G – Manufacturing & Facility Database
- Appendix H – Import-Export Data Tables
- Appendix I – Regulatory Summary Tables
- Appendix J – Primary Research Participant List (Anonymized)
- Appendix K – Primary Research Questionnaire Framework
- Appendix L – Data Sources & Bibliography
- Appendix M – Market Size Divergence & Source Comparison
Chapter 17. Research Methodology
- 17.1 Research Framework & Philosophy
- 17.2 Secondary Research – Sources, Hierarchy & Data Extraction
- 17.3 Data Modeling – Bottom-Up & Top-Down Market Sizing
- 17.4 Primary Research – Stakeholder Framework, LOI & Sample Sizes
- 17.5 Forecast Methodology – Regression, Scenario & Sensitivity Analysis
- 17.6 Quality Control – Four-Layer Validation Framework
- 17.7 Limitations & Standard Assumptions
- 17.8 Disclaimer
