
Market Overview:
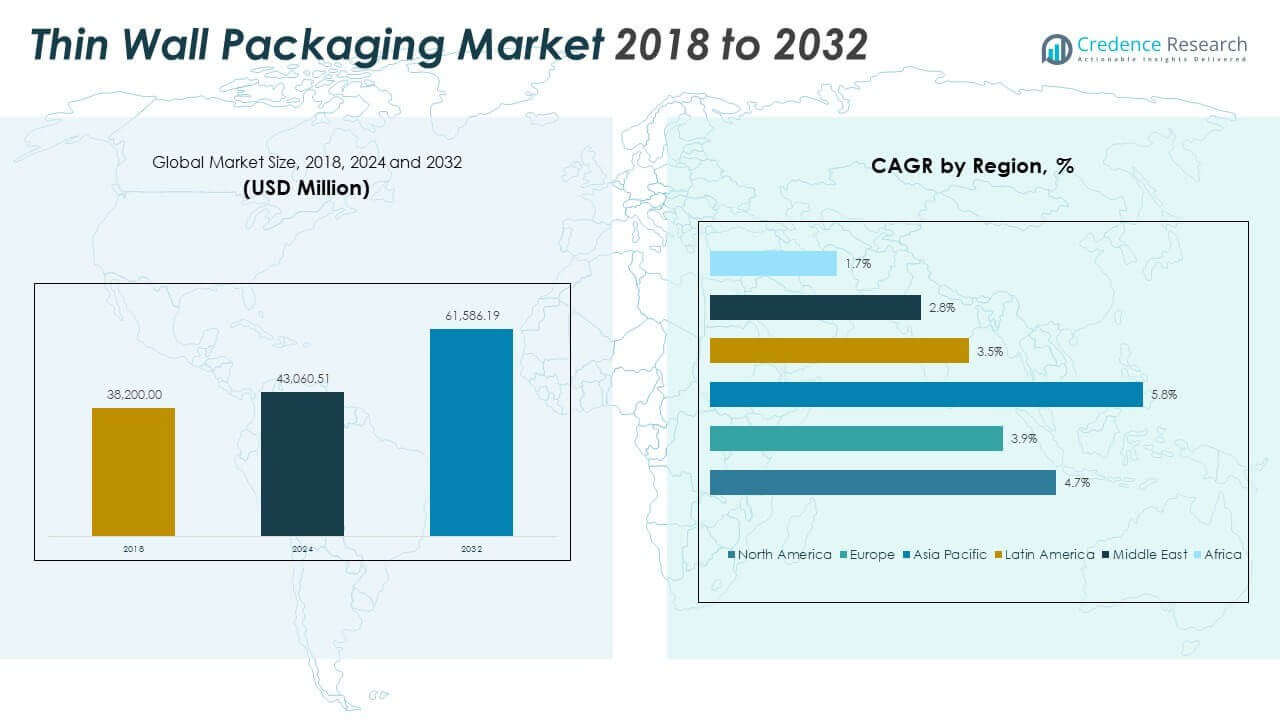
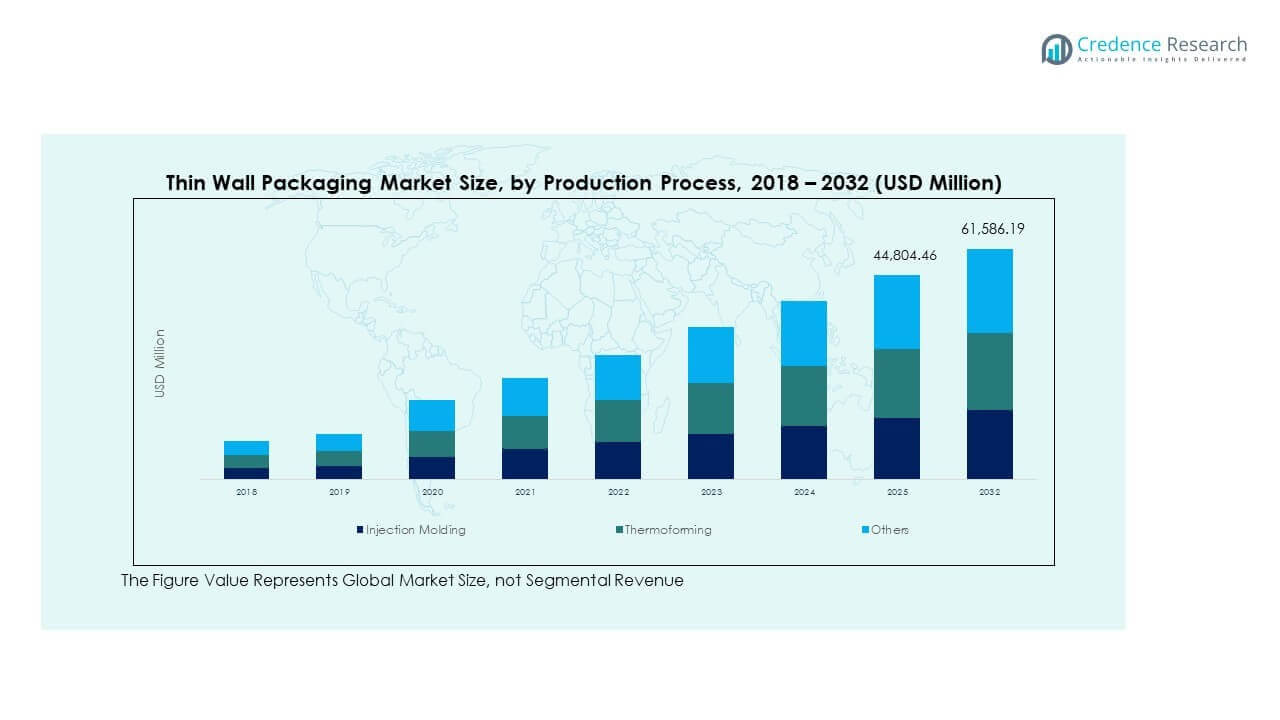
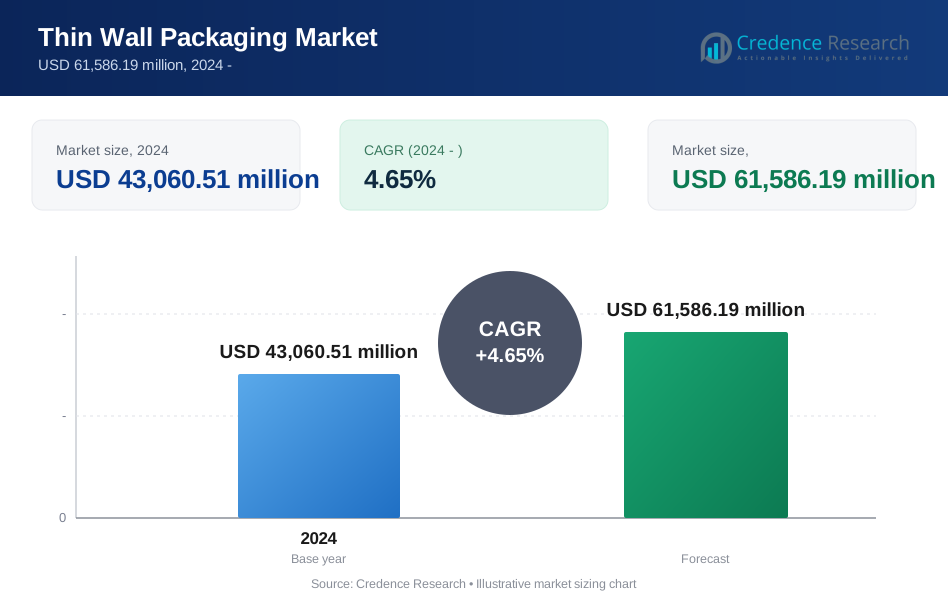
The Global Thin Wall Packaging Market size was valued at USD 38,200.00 million in 2018 to USD 43,060.51 million in 2024 and is anticipated to reach USD 61,586.19 million by 2032, at a CAGR of 4.65% during the forecast period.
| REPORT ATTRIBUTE | DETAILS |
|---|---|
| Historical Period | 2020-2023 |
| Base Year | 2024 |
| Forecast Period | 2025-2032 |
| Thin Wall Packaging Market Size 2024 | USD 43,060.51 million |
| Thin Wall Packaging Market, CAGR | 4.65% |
| Thin Wall Packaging Market Size 2032 | USD 61,586.19 million |
Demand rises due to lightweight packaging needs across food, dairy, and ready meals. Brand owners prefer thin wall formats to cut material use and logistics costs. Process innovation improves strength while reducing resin consumption. High-speed injection molding supports large-scale production efficiency. Urban lifestyles increase demand for single-serve and convenience packaging. Retailers push for shelf appeal and consistent quality. Sustainability goals drive downgauging without performance loss. Recyclable polymers gain wider acceptance across applications. Cost control remains a key purchase driver for converters and brand owners.
Europe and North America lead due to advanced packaging technology adoption. Strong food processing industries support steady demand in these regions. Asia Pacific shows rapid growth from urbanization and rising packaged food use. China and India benefit from expanding middle-class consumption. Southeast Asia gains traction through retail modernization. Latin America grows with improved cold chain infrastructure. Middle East demand rises from food service expansion. Africa remains emerging with gradual shifts toward packaged food formats. Regional growth reflects income levels, consumption habits, and manufacturing capacity.
Market Insights:
- The market reached USD 38,200.00 million in 2018, USD 43,060.51 million in 2024, and USD 61,586.19 million by 2032, at a 4.65% CAGR.
- North America led with 36.1% share due to automation and strong food processing, followed by Asia Pacific at 28.0% and Europe at 25.8% from scale and regulation.
- Asia Pacific was the fastest-growing region with 28.0% share, driven by urbanization, packaged food growth, and capacity expansion in China and India.
- Injection molding dominated production with about 68% share, supported by speed, precision, and high-volume food packaging demand.
- Thermoforming held nearly 24% share, while other processes accounted for around 8%, serving trays and niche formats.
Market Drivers:
Rising Demand For Lightweight And Cost-Efficient Food Packaging Solutions
The Global Thin Wall Packaging Market benefits from strong demand in food and dairy sectors. Lightweight packs reduce material usage and freight costs. Brand owners prefer thinner formats to improve margin control. Retail chains demand uniform containers for shelf efficiency. Food processors value fast cycle packaging for high-volume output. Urban lifestyles increase reliance on ready-to-eat meals. Single-serve packaging supports portion control trends. Manufacturers focus on cost efficiency without quality loss.
- For instance, Berry Global reported resin reduction of up to 15% in thin wall food containers through downgauging programs.
High-Speed Injection Molding Adoption Across Packaging Production Lines
Advanced molding systems drive higher output and precision. Automation reduces labor dependency across large facilities. Consistent wall thickness improves structural reliability. Faster cycle times support mass production needs. Equipment upgrades enhance mold life and productivity. Packaging converters scale operations with predictable quality. Process stability supports global brand requirements. Capital investment aligns with long-term volume growth.
- For instance, Husky Technologies states its HyPET and thin wall systems achieve cycle times below 3 seconds in food packaging lines.
Strong Focus On Material Optimization And Resin Efficiency By Converters
Converters seek thinner designs with stable performance. Material optimization lowers resin consumption per unit. Improved polymer blends support strength retention. Design simulation tools reduce trial errors. Lightweight containers cut warehouse storage costs. Transport efficiency improves across supply chains. Packaging waste reduction aligns with buyer expectations. Operational savings strengthen supplier competitiveness.
Growth Of Packaged Food And Dairy Consumption Across Urban Markets
Packaged food consumption expands with busy lifestyles. Dairy products rely on rigid thin wall containers. Hygiene standards favor sealed plastic formats. Shelf-life stability supports retail distribution. Convenience stores increase packaged food turnover. Food service operators prefer stackable containers. Volume demand supports continuous packaging orders. Consumption trends sustain long-term market growth.
Market Trends:
Shift Toward Smart Mold Design And Precision Tooling Technologies
Toolmakers invest in high-precision mold systems. Smart molds improve consistency across batches. Advanced tooling reduces downtime and scrap rates. Mold design software enhances product accuracy. Precision tools support complex container shapes. Faster mold changeovers improve flexibility. Custom designs strengthen brand differentiation. Technology adoption raises production reliability.
- For instance, Synventive reports scrap reduction above 20% using valve gate control and real-time cavity pressure monitoring.
Growing Preference For Premium Aesthetic And Functional Packaging Designs
Brands focus on visual appeal for consumer impact. Thin wall containers allow smooth surface finishes. Transparent packaging supports product visibility. Matte and textured designs gain attention. Functional lids enhance user convenience. Ergonomic shapes improve handling comfort. Packaging aesthetics influence purchase decisions. Design innovation supports brand positioning.
- For instance, Amcor highlights the use of high-clarity, recycle-ready polypropylene (such as the AmPrima® range) which achieves high transparency and shelf appeal comparable to traditional unrecyclable plastics, while typical food-grade polypropylene maintains a light transmission rate between 85% and 90%.
Increasing Use Of Multi-Cavity Molds For High-Volume Production
Manufacturers deploy multi-cavity molds for scale. Higher cavity counts boost output per cycle. Energy efficiency improves with optimized runs. Production costs decline at larger volumes. Standardized containers support mold replication. Large brands demand consistent global supply. Capacity expansion follows retail growth. Volume efficiency shapes production strategy.
Expansion Of Private Label Packaging Across Retail Channels
Retailers expand private label food offerings. Private brands seek cost-effective packaging. Thin wall formats support competitive pricing. Standard designs reduce tooling complexity. Fast turnaround supports retail promotions. Consistent packaging improves shelf management. Retail-led demand reshapes supplier focus. Private labels strengthen volume stability.
Market Challenges Analysis:
Volatility In Polymer Prices And Supply Chain Disruptions
Polymer price swings affect cost planning. Supply chain disruptions impact resin availability. Import dependency raises procurement risk. Cost volatility pressures profit margins. Short-term contracts increase exposure. Inventory management becomes complex. Smaller converters face higher risk. Pricing instability challenges long-term planning.
Recycling Limitations And Regulatory Pressure On Plastic Packaging
Recycling infrastructure remains uneven across regions. Regulatory scrutiny increases compliance costs. Packaging bans create uncertainty for converters. Material alternatives lack scale readiness. Certification processes add operational burden. Consumer perception challenges plastic usage. Innovation pace must meet policy timelines. Regulatory pressure influences investment decisions.
Market Opportunities:
Development Of Recyclable And Mono-Material Thin Wall Packaging Formats
Recyclable formats gain strong brand interest. Mono-material designs ease recycling processes. Polymer innovation supports circular economy goals. Food-grade recyclables attract premium buyers. Sustainability claims enhance brand trust. Early adopters gain competitive advantage. Regulatory alignment supports faster approvals. Innovation opens new contract opportunities.
Expansion Of Packaged Food Markets In Emerging Economies
Emerging economies show rising packaged food demand. Urbanization increases convenience food adoption. Modern retail expands distribution reach. Local brands seek scalable packaging solutions. Cost-efficient thin wall containers suit price-sensitive markets. Capacity investments support regional growth. Export-oriented production increases demand. Emerging regions offer long-term volume potential.
Market Segmentation Analysis:
By Product Type
The Global Thin Wall Packaging Market shows strong demand across cups, trays, containers, lids, and others. Cups hold wide usage in dairy and ready-to-eat foods due to light weight. Trays support fresh food and takeaway packaging with stackable designs. Containers lead due to versatility across food and non-food uses. Lids play a critical role in sealing and spill prevention. Other product types serve niche storage and specialty needs. Product innovation focuses on strength with reduced material use.
- For instance, RPC Group developed thin wall dairy cups weighing under 5 grams while maintaining top-load strength.
By Application
Food and beverages dominate application demand due to hygiene and convenience needs. Packaged meals and dairy rely on thin wall formats for shelf efficiency. Pharmaceuticals use thin wall packs for unit-dose and secondary packaging. Personal care products adopt thin wall containers for creams and gels. Other applications include household and industrial uses. Application diversity supports stable demand across economic cycles. End-user focus remains on safety and consistency.
By Material
Polypropylene leads due to strength, clarity, and recyclability. Polystyrene supports cost-sensitive applications with rigid performance. Polyethylene offers flexibility and impact resistance for select uses. Other materials address specialty performance needs. Material choice depends on end-use and compliance standards. Resin optimization remains a key focus area.
By Production Process
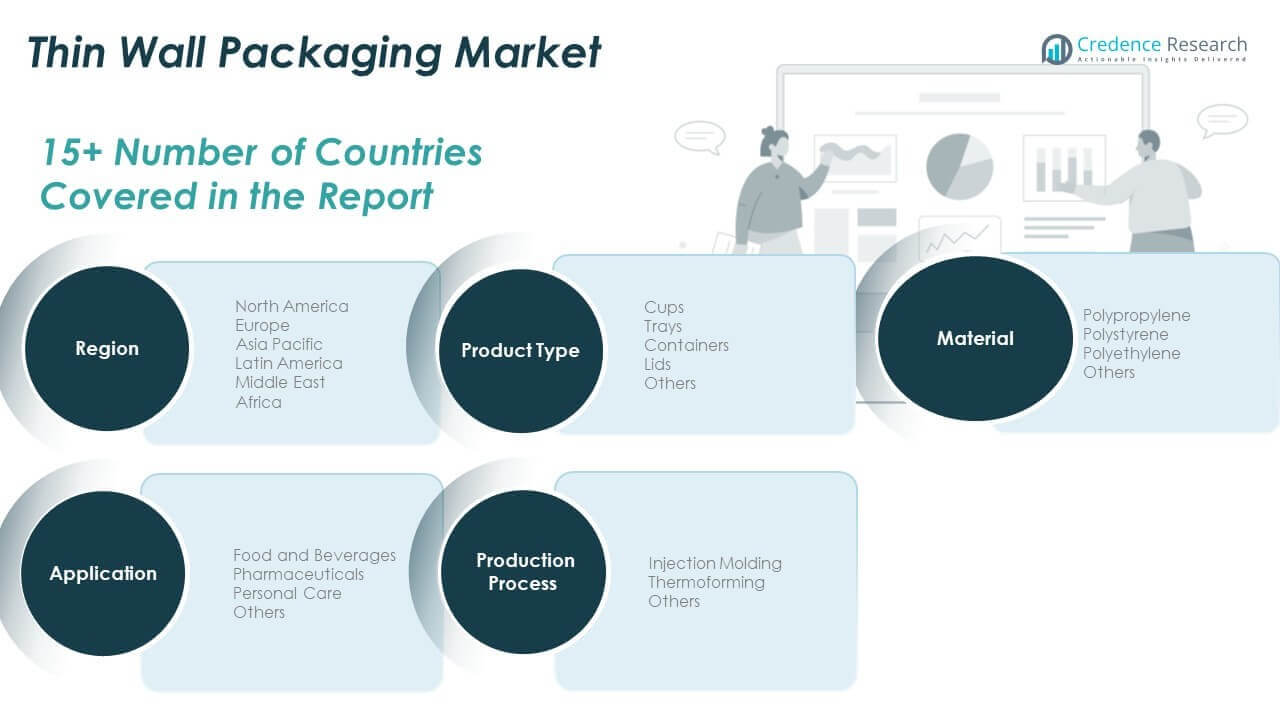
Injection molding dominates due to speed and precision. High-volume output suits mass food packaging. Thermoforming supports trays and shallow containers. Other processes serve low-volume or custom needs. Process selection aligns with scale, cost, and design needs.
Segmentation:
By Product Type- Cups
- Trays
- Containers
- Lids
- Others
- Food and Beverages
- Pharmaceuticals
- Personal Care
- Others
- Polypropylene
- Polystyrene
- Polyethylene
- Others
- Injection Molding
- Thermoforming
- Others
- North America
- U.S.
- Canada
- Mexico
- Europe
- Germany
- France
- U.K.
- Italy
- Spain
- Rest of Europe
- Asia Pacific
- China
- Japan
- India
- South Korea
- South-east Asia
- Rest of Asia Pacific
- Latin America
- Brazil
- Argentina
- Rest of Latin America
- Middle East & Africa
- GCC Countries
- South Africa
- Rest of the Middle East and Africa
Regional Analysis:
North America Regional Outlook
The North America Global Thin Wall Packaging Market size was valued at USD 13,958.28 million in 2018 to USD 15,544.58 million in 2024 and is anticipated to reach USD 22,201.93 million by 2032, at a CAGR of 4.7% during the forecast period. North America holds about 36.1% market share in 2024. The region benefits from advanced packaging automation. Strong food processing supports steady demand. Dairy and ready-meal segments drive volume usage. Retail chains prefer standardized containers. Sustainability targets shape material choices. High-speed molding improves output consistency. The market favors premium and compliant packaging formats.
Europe Regional Outlook
The Europe Global Thin Wall Packaging Market size was valued at USD 10,256.70 million in 2018 to USD 11,121.35 million in 2024 and is anticipated to reach USD 15,042.59 million by 2032, at a CAGR of 3.9% during the forecast period. Europe accounts for nearly 25.8% market share in 2024. The region emphasizes recyclable packaging solutions. Food and dairy brands drive stable consumption. Regulatory focus shapes design standards. Lightweight formats support logistics efficiency. Western Europe leads production capacity. Eastern Europe shows gradual expansion. Innovation supports compliance and cost control.
Asia Pacific Regional Outlook
The Asia Pacific Global Thin Wall Packaging Market size was valued at USD 10,271.98 million in 2018 to USD 12,046.00 million in 2024 and is anticipated to reach USD 18,857.74 million by 2032, at a CAGR of 5.8% during the forecast period. Asia Pacific holds around 28.0% market share in 2024. Rapid urban growth boosts packaged food demand. China and India lead volume consumption. Retail modernization supports packaged formats. Cost-efficient production attracts global brands. Local manufacturers expand capacity. Food service growth strengthens demand. The region remains the fastest-growing market.Latin America Regional Outlook
The Latin America Global Thin Wall Packaging Market size was valued at USD 1,986.40 million in 2018 to USD 2,212.88 million in 2024 and is anticipated to reach USD 2,886.54 million by 2032, at a CAGR of 3.5% during the forecast period. Latin America represents about 5.1% market share in 2024. Brazil leads regional demand. Packaged food adoption supports growth. Retail expansion improves distribution reach. Price sensitivity favors thin wall designs. Local converters scale production. Imports support supply gaps. Demand remains steady across key economies.
Middle East Regional Outlook
The Middle East Global Thin Wall Packaging Market size was valued at USD 1,103.98 million in 2018 to USD 1,140.82 million in 2024 and is anticipated to reach USD 1,416.82 million by 2032, at a CAGR of 2.8% during the forecast period. The region holds nearly 2.6% market share in 2024. Food service expansion drives container demand. Urban lifestyles support convenience packaging. GCC countries lead consumption. Imports meet advanced packaging needs. Local production remains limited. Shelf-life focus supports rigid packaging. Growth remains moderate but stable.
Africa Regional Outlook
The Africa Global Thin Wall Packaging Market size was valued at USD 622.66 million in 2018 to USD 994.87 million in 2024 and is anticipated to reach USD 1,180.56 million by 2032, at a CAGR of 1.7% during the forecast period. Africa accounts for about 2.3% market share in 2024. Packaged food adoption rises steadily. Urban centers drive demand growth. South Africa leads regional usage. Infrastructure limits large-scale production. Imports support market supply. Cost efficiency guides material choices. Long-term potential remains strong.
Key Player Analysis:
- Amcor Limited
- Berry Global Group, Inc.
- RPC Group PLC
- Reynolds Group Holdings Limited
- Paccor GmbH
- Silgan Holdings Inc.
- Greiner Packaging International GmbH
- Mondi Group
- Sonoco Products Company
- Huhtamaki Group
- ALPLA Werke Alwin Lehner GmbH & Co KG
- Coveris Holdings S.A.
- Plastipak Holdings, Inc.
- Constantia Flexibles Group GmbH
- Sealed Air Corporation
- AptarGroup, Inc.
Competitive Analysis:
The Global Thin Wall Packaging Market shows moderate consolidation with strong global and regional players. Leading companies compete through scale, automation, and material efficiency. Product portfolios focus on food-grade containers and high-volume formats. Cost control remains a key competitive lever across regions. Large players benefit from long-term contracts with food brands. Mid-sized firms compete through flexibility and regional reach. Technology upgrades strengthen quality consistency. Sustainability positioning improves buyer preference. Competitive intensity remains steady across core applications.
Recent Developments:
- In May 2025, Greiner Packaging International GmbH launched a fully automated production line for recycled PET (rPET) vials in partnership with nutritional supplement manufacturer Orthomol. This new line, described as unique in Europe, utilizes advanced camera technology and a laminar flow system to inspect and package vials made from food-grade mechanical recyclate. This launch underscores Greiner’s commitment to sustainability and innovation in thin-wall packaging by transitioning high-volume product lines to 100% rPET materials.
- In April 2025, Mondi Group completed the acquisition of the Western European packaging assets of Schumacher Packaging, including two state-of-the-art mega-box plants in Germany. This acquisition adds over 1 billion square meters of capacity to Mondi’s portfolio and expands its corrugated and solid board solutions for eCommerce and FMCG markets. The move is designed to enhance supply security and innovation for customers while reinforcing Mondi’s position as a sustainable packaging leader in Western Europe.
- In April 2025, Amcor Limited completed its merger with Berry Global Group, Inc., creating a global leader in consumer and healthcare packaging solutions. This combination brings together two highly complementary businesses with a unique material science and innovation capability, positioning the new entity to accelerate growth across a broader portfolio of flexible films, containers, and closures. The merger is expected to generate significant value through synergy benefits, estimated at $650 million, and enhances Amcor’s position in attractive categories like high-performance and sustainable packaging.
- In April 2025, Berry Global Group, Inc. finalized its merger with Amcor Limited, a transaction that unites their respective strengths in flexible and rigid packaging to form a comprehensive global packaging giant. Prior to this, in November 2024, Berry Global also completed the spin-off and merger of its Health, Hygiene and Specialties Global Nonwovens and Films business with Glatfelter Corporation, creating a new publicly traded company named Magnera. These strategic moves allow Berry (now part of the combined Amcor entity) to focus intensely on its core consumer packaging franchise.
Report Coverage:
The research report offers an in-depth analysis based on Product Type and Application segments. It details leading market players, providing an overview of their business, product offerings, investments, revenue streams, and key applications. Additionally, the report includes insights into the competitive environment, SWOT analysis, current market trends, as well as the primary drivers and constraints. Furthermore, it discusses various factors that have driven market expansion in recent years. The report also explores market dynamics, regulatory scenarios, and technological advancements that are shaping the industry. It assesses the impact of external factors and global economic changes on market growth. Lastly, it provides strategic recommendations for new entrants and established companies to navigate the complexities of the market.
Future Outlook:
- Demand for lightweight food packaging will remain strong due to cost control needs.
- Injection molding efficiency will improve and support higher production scale.
- Recyclable thin wall formats will gain wider adoption under sustainability goals.
- Private label food packaging will continue to support steady volume growth.
- Asia Pacific will remain the fastest-expanding region with rising packaged food demand.
- Automation will reduce unit production costs across packaging facilities.
- Brand focus on shelf appeal will drive ongoing design innovation.
- Regulatory pressure will increasingly shape material selection decisions.
- Regional manufacturers will expand capacity to meet local demand growth.
- Long-term growth will favor cost-efficient and scalable packaging suppliers.
Request a Free Sample
Fill in your details and we'll send you a free sample report.
- Sample data tables & charts
- Research methodology
Need a Custom Version of This Report?
Tailor the scope, geography, or segments to your exact requirements.
- Custom geography or segment scope
- Direct access to our analyst team
Frequently Asked Questions
What is the current market size for the Global Thin Wall Packaging Market, and what is its projected size in 2032?
At what Compound Annual Growth Rate is the Global Thin Wall Packaging Market projected to grow between 2025 and 2032?
Which Global Thin Wall Packaging Market segment held the largest share in 2024?
What are the primary factors fueling the growth of the Global Thin Wall Packaging Market?
Which region commanded the largest share of the Global Thin Wall Packaging Market in 2024?
Table of Content
Chapter 1. Report Introduction
- 1.1 Report Description & Purpose
- 1.1.1 Report Title & Market Definition
- 1.1.2 Unique Selling Propositions (USP) & Key Differentiators
- 1.1.3 Value Proposition for Stakeholders
- 1.2 Research Objectives
- 1.2.1 Market Sizing Objectives (Volume & Revenue) (Volume Where Applicable)
- 1.2.2 Segmentation Objectives
- 1.2.3 Competitive Intelligence Objectives
- 1.2.4 Forecast & Scenario Objectives
- 1.3 Report Scope
- 1.3.1 Thin Wall Packaging Scope – Segments & Subsegments Covered
- 1.3.2 Geographic Scope – Regions & Countries Covered
- 1.3.3 Historical Period, Base Year & Forecast Period (2024; forecast to 2032)
- 1.3.4 Inclusions & Exclusions
- 1.4 Industry Classification & Applicable Codes
- 1.5 Currency, Measurement Units & Valuation Basis
- 1.6 Target Stakeholders
- 1.7 Limitations & Assumptions
Chapter 2. Executive Summary
- 2.1 Global Thin Wall Packaging Market Snapshot
- 2.1.1 Market Size – Historical (2024) & Forecast (2024-2032) (2024: USD 43,060.51 million → 2032: USD 61,586.19 million)
- 2.1.2 Volume & Revenue – Global Totals (Volume Where Applicable)
- 2.1.3 Key Market Highlights – Top Five Facts
- 2.2 Thin Wall Packaging Market Segmentation Snapshot
- 2.2.1 Market Split by Region – 2024 vs. 2032
- 2.3 Competitive Snapshot
- 2.3.1 Top 10 Players by Revenue Share – 2024
- 2.3.2 Top 10 Players by Volume Share – 2024 (Volume Where Applicable)
- 2.3.3 Recent Strategic Developments (18-Month Summary)
- 2.4 Key Investment Highlights & Strategic Conclusions
Chapter 3. Thin Wall Packaging Market Dynamics & Industry Analysis
- 3.1 Market Overview & Context
- 3.1.1 Thin Wall Packaging Market Position in the Broader Industry Value Chain
- 3.1.2 Demand Structure & Purchasing Dynamics
- 3.1.3 Market Maturity & Development Stage by Region
- 3.2 Thin Wall Packaging Market Drivers
- 3.3 Thin Wall Packaging Market Restraints & Challenges
- 3.4 Thin Wall Packaging Market Opportunities
- 3.5 Porter's Five Forces Analysis
- 3.5.1 Threat of New Entrants
- 3.5.2 Bargaining Power of Suppliers
- 3.5.3 Bargaining Power of Buyers
- 3.5.4 Threat of Substitutes
- 3.5.5 Competitive Rivalry – Intensity Assessment
- 3.6 Thin Wall Packaging Value Chain Analysis
- 3.6.1 Upstream – Key Inputs, Resources & Suppliers
- 3.6.1.1 Key Input/Resource 1
- 3.6.1.2 Key Input/Resource 2
- 3.6.1.3 Key Input/Resource 3
- 3.6.2 Midstream – Core Operations & Value Creation
- 3.6.2.1 Operating Model & Process Overview
- 3.6.2.2 Key Operating Locations & Capabilities by Company
- 3.6.3 Downstream – Market Channels & End Users
- 3.6.3.1 Direct Sales & Customer Engagement Channels
- 3.6.3.2 Indirect Sales, Intermediaries & Partner Channels
- 3.6.4 Value Chain Profitability Analysis
- 3.6.1 Upstream – Key Inputs, Resources & Suppliers
- 3.7 PESTEL Analysis
- 3.7.1 Political Factors
- 3.7.2 Economic Factors
- 3.7.3 Social Factors
- 3.7.4 Technological Factors
- 3.7.5 Environmental Factors
- 3.7.6 Legal Factors
- 3.8 Thin Wall Packaging Supply Chain Analysis
- 3.8.1 Critical Input & Resource Availability Risk Assessment
- 3.8.2 Supplier & Operational Concentration Risk (Geographic Exposure)
- 3.8.3 Supply & Service Disruption Impact Analysis
- 3.9 Regulatory & Policy Landscape
Note: The regulatory and policy landscape section covers regulations based on their applicability to the market, Thin Wall Packaging category, geography, and scope of the study. Only regulatory frameworks with a material impact on operations, compliance, trade, sustainability, or market access are analyzed in detail.
Chapter 4. Key Investment Pockets & Opportunity Analysis
- 4.1 Thin Wall Packaging Market Attractiveness Analysis
- 4.1.1 By Region – Investment Attractiveness Matrix (Market Size × CAGR)
- 4.2 Absolute Revenue Growth Opportunity
- 4.2.1 By Region – Absolute Revenue Growth Through 2032
- 4.3 Incremental Demand Opportunity
- 4.3.1 By Region – Incremental Demand Through 2032
- 4.3.2 Segment – Incremental Demand
- 4.4 Emerging Submarket Opportunity Deep Dive (Subject to Applicability)
- 4.5 Priority Market Opportunity Scorecards
- 4.5.1 United States
- 4.5.2 Europe
- 4.5.3 Asia
- 4.5.4 Middle East & Africa
Note: Priority market opportunity scorecards reflect the geographic scope and strategic relevance of the study. Listed markets are indicative and may be adapted to the industry.
Chapter 5. Thin Wall Packaging Cross-Border Trade & Market Access Analysis
- 5.1 International Trade & Cross-Border Activity Overview
- 5.1.1 Global Export Value by Country (2024)
- 5.1.2 Global Export Volume by Country (2024) (Volume Where Applicable)
- 5.1.3 Global Import Value by Country (2024)
- 5.1.4 Global Import Volume by Country (2024) (Volume Where Applicable)
- 5.1.5 Net Trade Balance by Country (2024)
- 5.2 Export Analysis – Segment
- 5.2.1 Category 1 (Applicable Classification Code)
- 5.2.2 Category 2 (Applicable Classification Code)
- 5.2.3 Category 3 (Applicable Classification Code)
- 5.2.4 Category 4 (Applicable Classification Code)
- 5.2.5 Category 5 (Applicable Classification Code)
- 5.3 Import Analysis – Segment
- 5.3.1 Category 1 (Applicable Classification Code)
- 5.3.2 Category 2 (Applicable Classification Code)
- 5.3.3 Category 3 (Applicable Classification Code)
- 5.3.4 Category 4 (Applicable Classification Code)
- 5.3.5 Category 5 (Applicable Classification Code)
- 5.4 Cross-Border Pricing & Transaction Benchmarks
- 5.4.1 Export Pricing – Segment & Country
- 5.4.2 Import Pricing – Segment & Source Country
- 5.4.3 Price Trends (2024)
- 5.5 Key Cross-Border Trade & Delivery Routes
- 5.5.1 Cross-Border Trade/Delivery Route 1
- 5.5.2 Cross-Border Trade/Delivery Route 2
- 5.5.3 Cross-Border Trade/Delivery Route 3
- 5.5.4 Cross-Border Trade/Delivery Route 4
- 5.5.5 Cross-Border Trade/Delivery Route 5
- 5.6 Trade Policy & Market Access Impact Assessment
- 5.6.1 Tariff & Non-Tariff Barriers
- 5.6.2 Regional Trade & Economic Integration Frameworks
- 5.6.3 Bilateral & Multilateral Trade Agreements
- 5.6.4 Cross-Border Operating, Licensing & Localization Requirements
Note: This chapter applies where cross-border trade or delivery is relevant to Thin Wall Packaging. Goods, services, and digital offerings are assessed using applicable classifications and transaction measures. Import-export volumes, trade balances, and route analyses are included only where meaningful to the market.
Chapter 6. Competitive Landscape & Company Benchmarking
- 6.1 Thin Wall Packaging Market Concentration & Structure
- 6.1.1 Herfindahl-Hirschman Index (HHI) – vs. 2024
- 6.1.2 Leading, Mid-Sized & Emerging Player Structure
- 6.1.3 Global, Regional & Local Player Dynamics
- 6.2 Thin Wall Packaging Market Share Analysis – 2024
- 6.2.1 Global Revenue Share by Company
- 6.2.2 Global Volume Share by Company (Volume Where Applicable)
- 6.2.3 Regional Revenue Share
- 6.2.4 Market Share Evolution ( vs. 2024)
- 6.2.5 Company Market Share by Key Segment
- 6.2.6 Company Market Share by Customer Group
- 6.3 Operating Scale, Capacity & Infrastructure Analysis
- 6.3.1 Global Operating Scale & Supply Capacity
- 6.3.2 Resource Utilization & Operating Efficiency
- 6.3.3 Output, Service Delivery & Activity Metrics
- 6.3.4 Operating Footprint & Infrastructure Map
- 6.3.5 Planned Operational & Capacity Expansion
- 6.4 Thin Wall Packaging Competitive Benchmarking Matrix
- 6.4.1 Revenue, Growth, Profitability & Operating Metric Comparison
- 6.4.2 Channel Revenue Mix
- 6.4.3 Geographic Revenue Exposure
- 6.4.4 R&D Intensity
- 6.4.5 Sustainability Maturity
- 6.5 Strategic Developments in Thin Wall Packaging (Last 24 Months)
- 6.5.1 Mergers, Acquisitions & Divestments
- 6.5.2 New Products, Services & Solutions in Thin Wall Packaging
- 6.5.3 Operational & Infrastructure Expansions
- 6.5.4 Strategic Alliances, Joint Ventures & Partnerships
- 6.5.5 Distribution Expansion & Market Entry
- 6.5.6 Sustainability & ESG Initiatives
- 6.6 Competitive Strategy Mapping
- 6.6.1 Leader, Challenger, Follower & Niche Classification
- 6.6.2 Pricing Strategy Comparison
- 6.6.3 Channel Strategy Matrix
Note: Strategic developments are included based on their materiality and the availability of reliable information.
Chapter 7. Global Thin Wall Packaging Market – By Sales & Delivery Channel
- 7.1 Segment Overview
- 7.1.1 Volume & Revenue Split by Channel (2024 & 2032) (Volume Where Applicable)
- 7.1.2 Channel Mix Evolution (2024-2032)
Chapter 8. Regional Market Analysis – Global Overview
- 8.1 Global Regional Overview
- 8.1.1 Regional Volume Share (Volume Where Applicable)
- 8.1.2 Regional Revenue Share
- 8.1.3 Regional Volume by Region (Volume Where Applicable)
- 8.1.4 Regional Revenue by Region
- 8.1.5 Regional Forecast Through 2032
- 8.2 Cross-Regional Segment Analysis
- 8.2.1 By Sales & Delivery Channel
- 8.2.2 By Competitive Positioning & Price Tier
Chapter 9. North America Thin Wall Packaging Market
- 9.1 United States
- 9.2 Canada
- 9.3 Mexico
Chapter 10. Europe Thin Wall Packaging Market
- 10.1 Germany
- 10.2 France
- 10.3 Italy
- 10.4 United Kingdom
- 10.5 Spain
- 10.6 Poland
- 10.7 Russia
- 10.8 Netherlands
- 10.9 Belgium
- 10.10 Sweden
- 10.11 Denmark
- 10.12 Norway
- 10.13 Rest of Europe
Chapter 11. Asia Pacific Thin Wall Packaging Market
- 11.1 China
- 11.2 India
- 11.3 Japan
- 11.4 South Korea
- 11.5 Thailand
- 11.6 Indonesia
- 11.7 Vietnam
- 11.8 Malaysia
- 11.9 Australia
- 11.10 Rest of Asia Pacific
Chapter 12. Latin America Thin Wall Packaging Market
- 12.1 Brazil
- 12.2 Argentina
- 12.3 Colombia
- 12.4 Chile
- 12.5 Rest of Latin America
Chapter 13. Middle East Thin Wall Packaging Market
- 13.1 Saudi Arabia
- 13.2 United Arab Emirates
- 13.3 Turkey
- 13.4 Israel
- 13.5 Iran
- 13.6 Rest of the Middle East
Chapter 14. Africa Thin Wall Packaging Market
- 14.1 South Africa
- 14.2 Egypt
- 14.3 Nigeria
- 14.4 Morocco
- 14.5 Rest of Africa
Chapter 15. Thin Wall Packaging Company Profiles
- 15.1 [Company 01]
- 15.1.1 Company Overview
- 15.1.2 Key Management Personnel
- 15.1.3 Products & Services Portfolio
- 15.1.4 Financial Performance
- 15.1.5 Key Market Focus & Geographic Presence
- 15.1.6 Recent Developments & Strategic Initiatives
Note: The company profile list is preliminary and may change based on research findings, market developments, data availability, and client requirements.
Chapter 16. Appendices
- Appendix A – List of Abbreviations & Acronyms
- Appendix B – Industry Classification Code Reference – Full Series
- Appendix C – Supply, Output & Operating Capacity Data Tables
- Appendix D – End-Use & Demand Base Tables
- Appendix E – Demand, Adoption & Usage Assumptions
- Appendix F – Pricing & Revenue Metric Reference Tables
- Appendix G – Company Operations & Infrastructure Database
- Appendix H – Cross-Border Trade & Activity Data Tables (Where Applicable)
- Appendix I – Regulatory Summary Tables
- Appendix J – Primary Research Participant List (Anonymized)
- Appendix K – Primary Research Questionnaire Framework
- Appendix L – Data Sources & Bibliography
- Appendix M – Market Size Divergence & Source Comparison
Chapter 17. Research Methodology
- 17.1 Research Framework & Philosophy
- 17.2 Secondary Research – Sources, Hierarchy & Data Extraction
- 17.3 Data Modeling – Bottom-Up & Top-Down Market Sizing
- 17.4 Primary Research – Stakeholder Framework, LOI & Sample Sizes
- 17.5 Forecast Methodology – Regression, Scenario & Sensitivity Analysis
- 17.6 Quality Control – Four-Layer Validation Framework
- 17.7 Limitations & Standard Assumptions
- 17.8 Disclaimer
