
Short AI data hall links keep multimode in demand
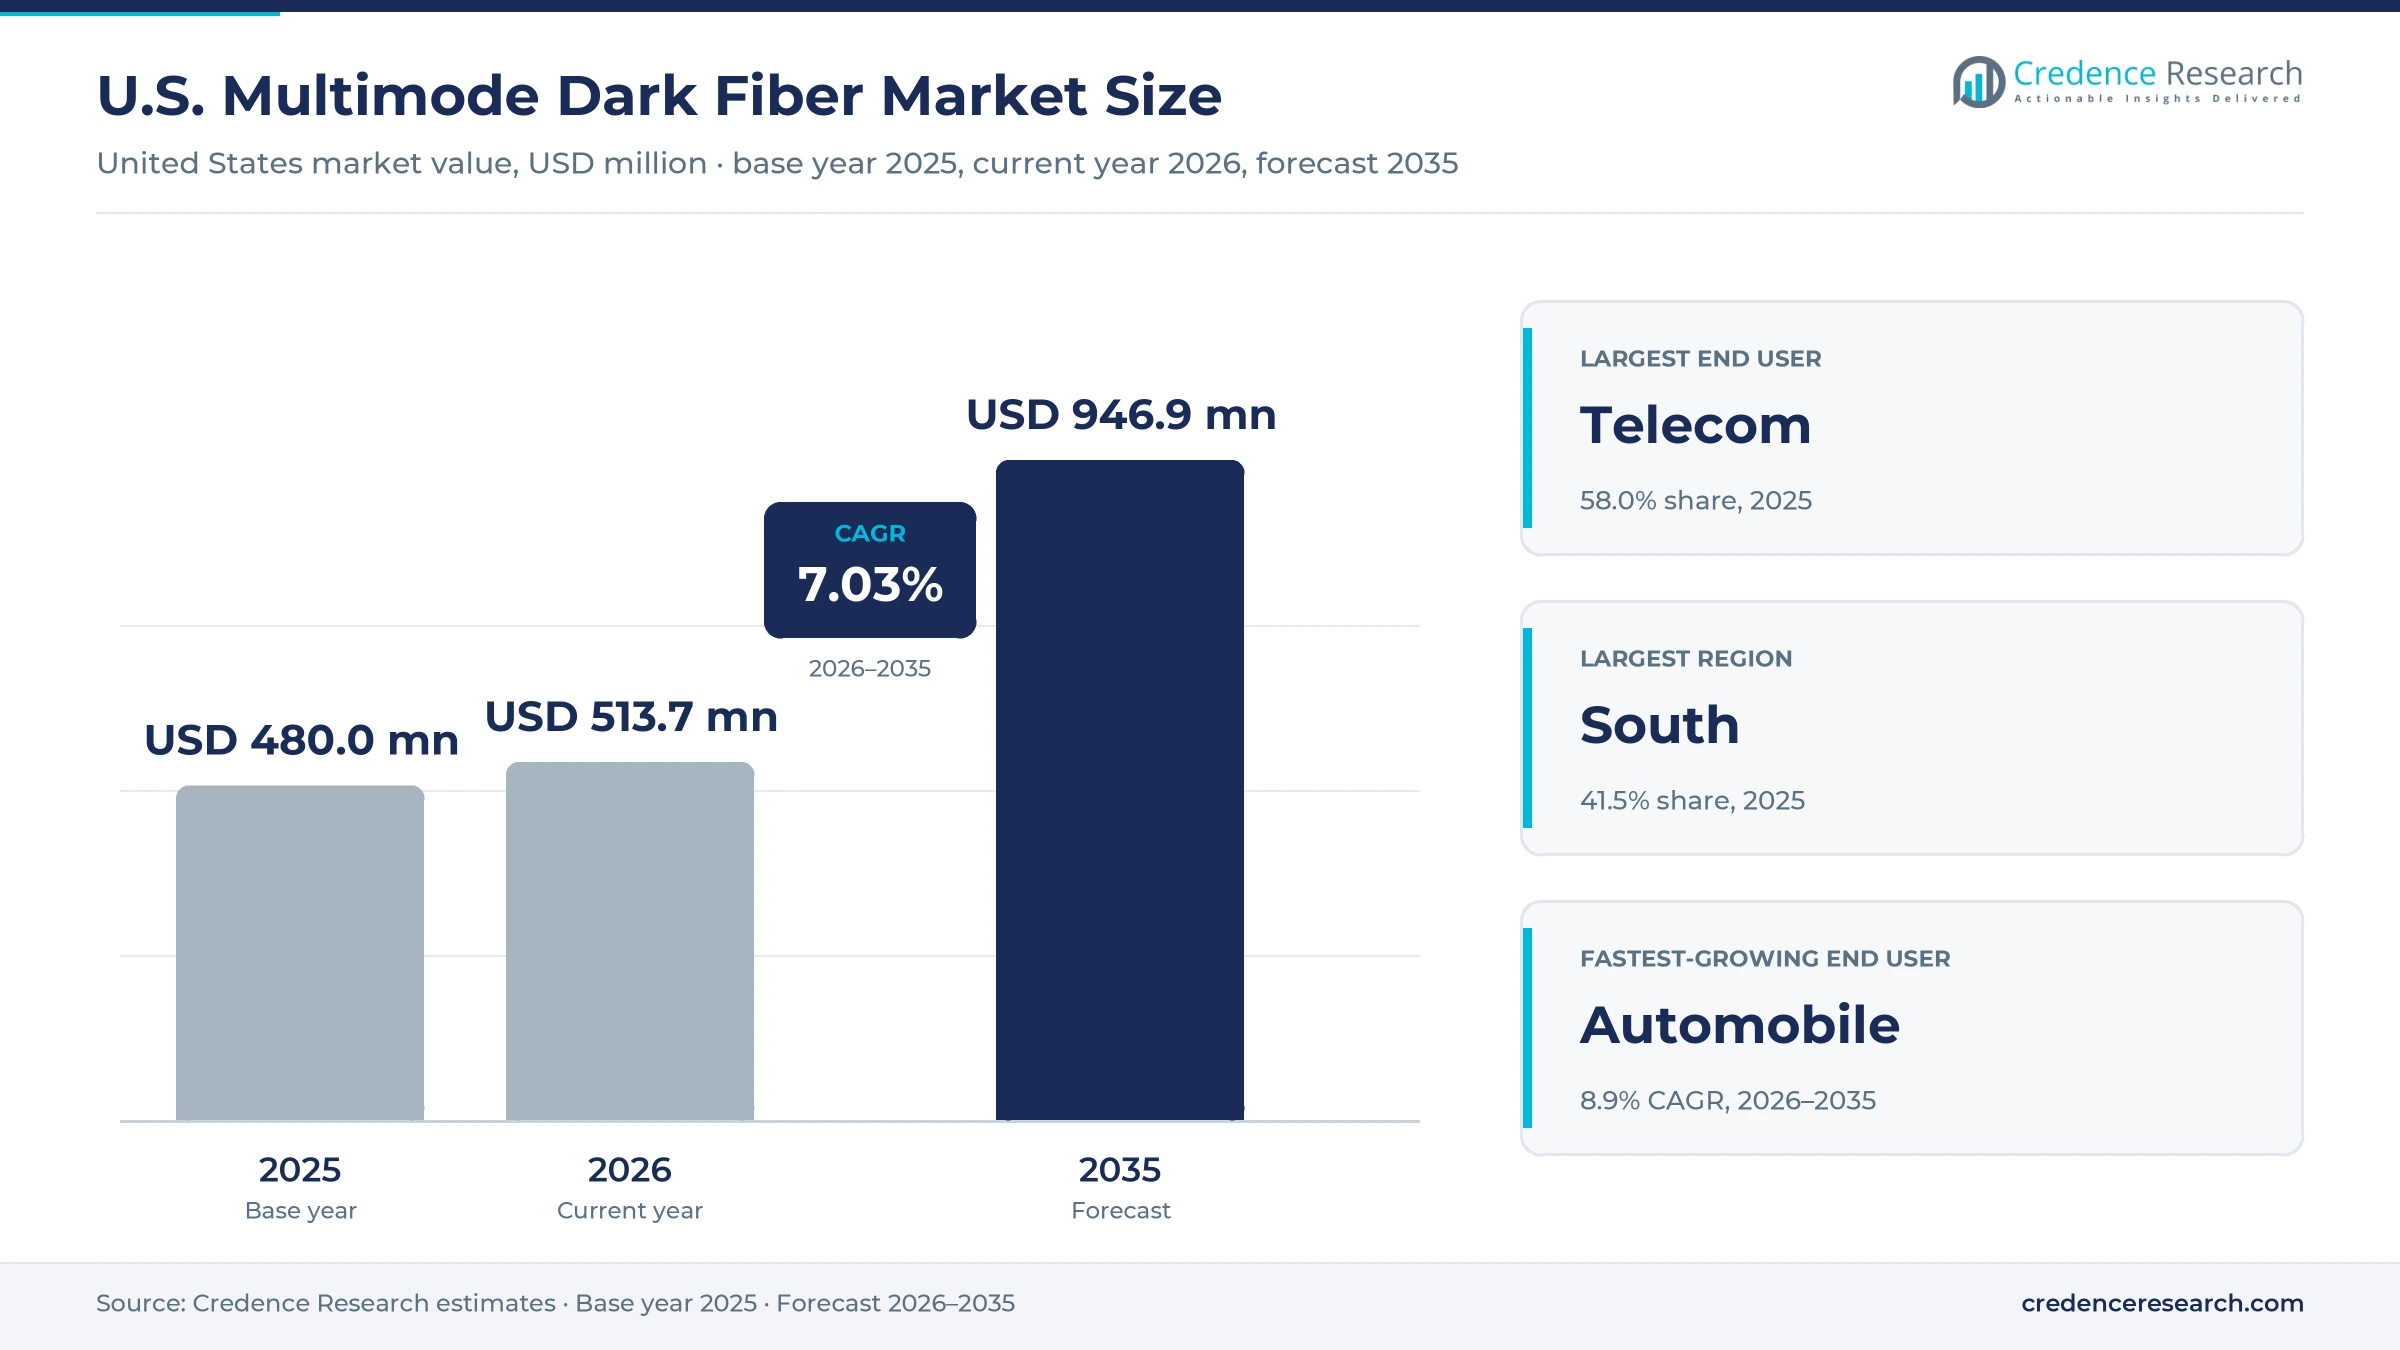
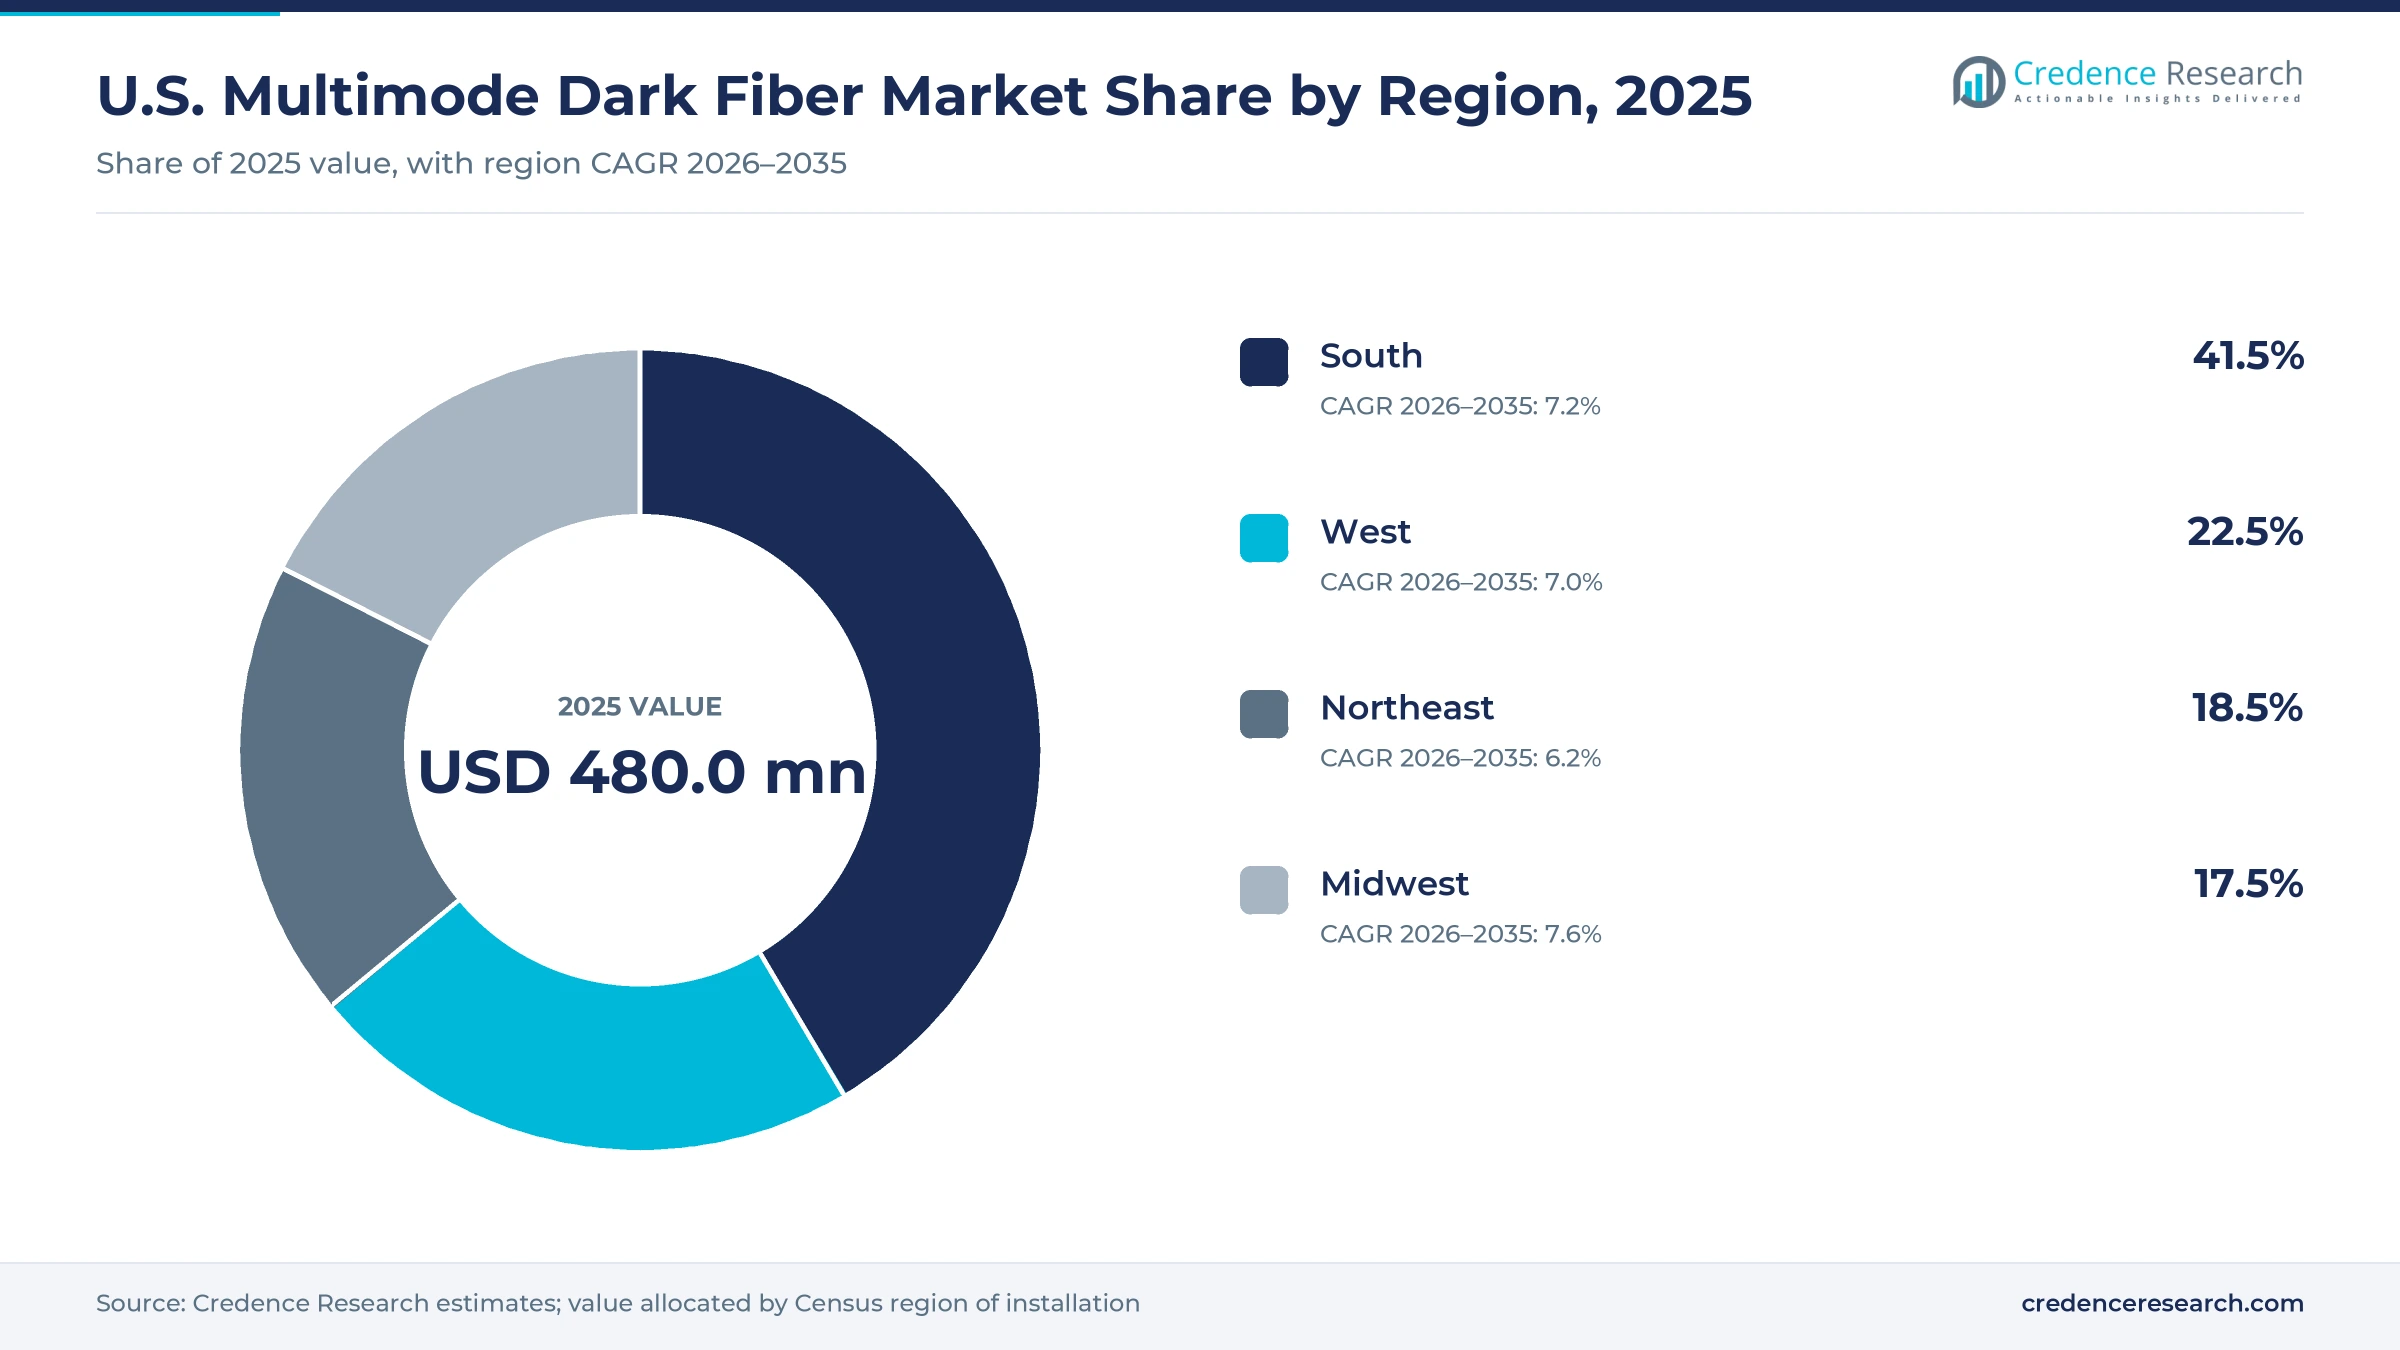
The U.S. multimode dark fiber market was valued at USD 480.0 million in 2025 and is projected to increase from USD 513.7 million in 2026 to USD 946.9 million by 2035, registering a CAGR of 7.03% during 2026–2035. Demand comes from short links of up to about 100 meters inside data halls, enterprise campuses, factories, defense sites and vehicles, where buyers install unlit multimode strands and light them with low-cost laser optics. The South held the largest regional share, 41.5% in 2025, because Northern Virginia, Atlanta and Dallas-Fort Worth host the densest cluster of hyperscale and colocation campuses. The Midwest is the fastest-growing region at 7.6% a year as new campuses rise around Columbus and Chicago. Ownership of the fiber routes that feed these buildings is consolidating, and Zayo completed its purchase of Crown Castle's fiber business in May 2026. Steady substitution by single-mode fiber in colocation cross connects remains the main restraint on multimode value.
Unlit short-reach strands that buyers light themselves make up the count
The market counts spending in the United States on multimode fiber strands supplied unlit, so that the buyer lights them with its own transceivers. It covers leased strands and long-term rights of use on campus and in-building routes, plus multimode cable plant installed dark inside data halls, plants, bases, aircraft and vehicles for private networks. Multimode reach is short by design, and the IEEE 802.3db short-reach standard sets 100 meters on OM4 fiber for 100G to 400G short-reach links.
Single-mode metro and long-haul dark fiber, lit wavelength and Ethernet services, and active optical cables are excluded. Value moves from fiber draw towers and cable plants through distributors and installers to data center operators, enterprises and manufacturers, while fiber lessors supply the routes that connect these buildings. Public sources do not split dark fiber revenue by fiber type, which is the main evidence gap behind the estimates in this report.
U.S. Multimode Dark Fiber Market Insights
- The U.S. multimode dark fiber market rises from USD 480.0 million in 2025 to USD 946.9 million by 2035, a 7.03% CAGR during 2026–2035, as AI data halls add short links.
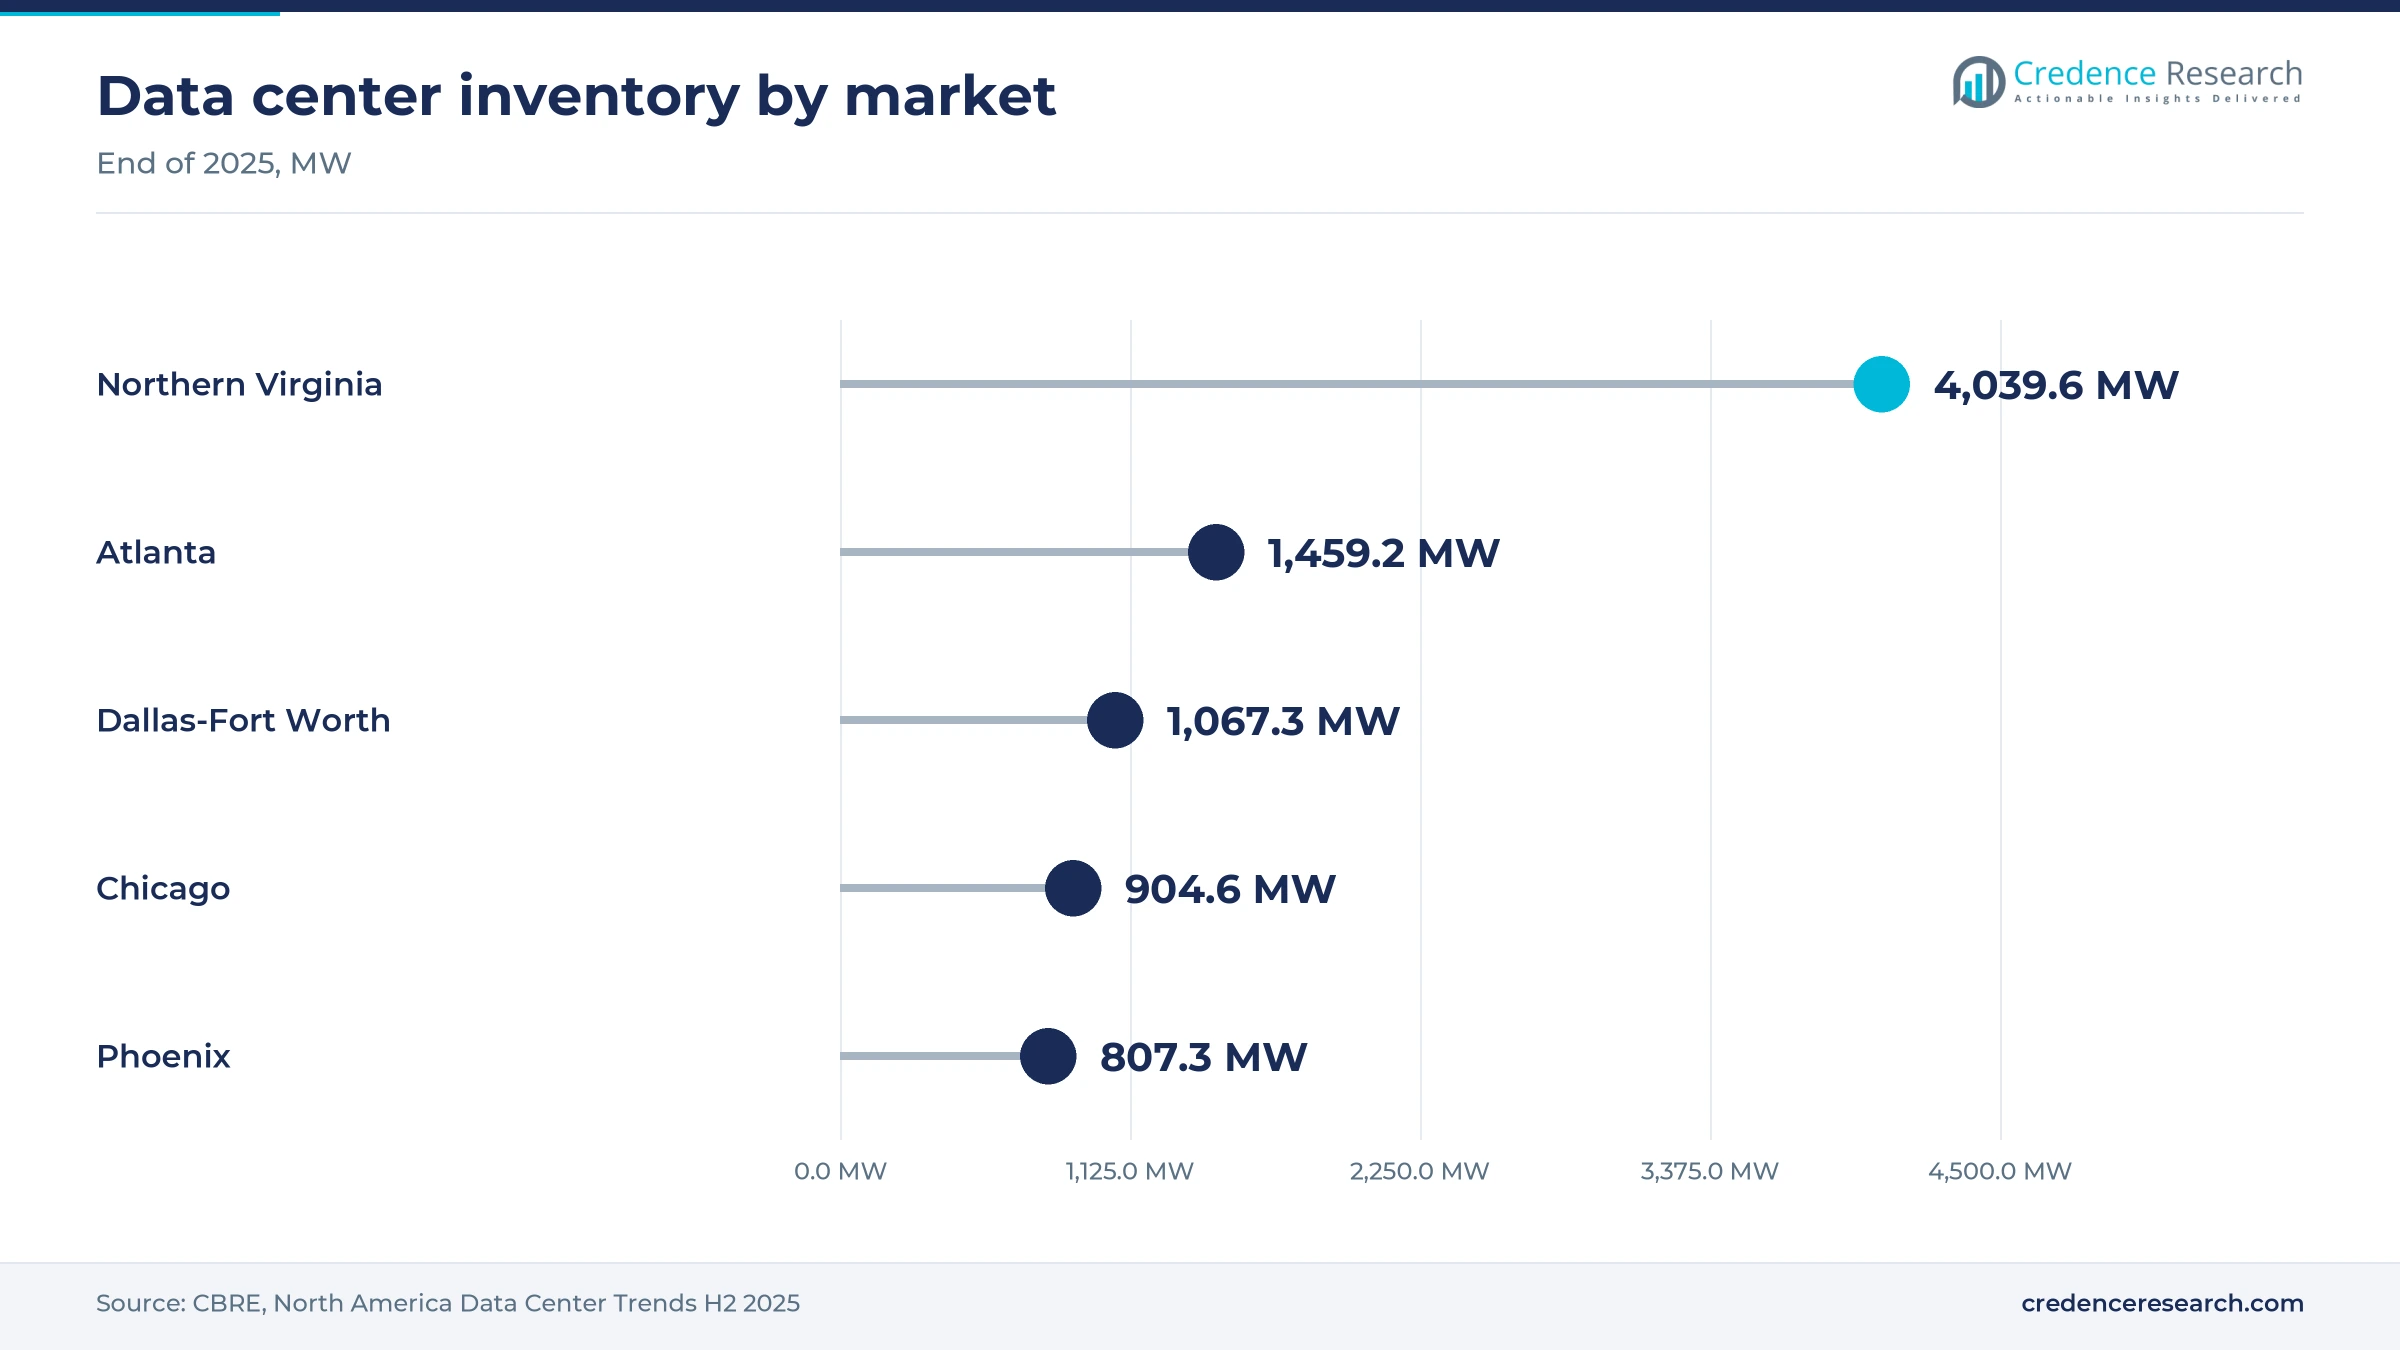
- The South held 41.5% of 2025 value, because Northern Virginia alone held 4,039.6 MW of data center inventory at the end of 2025.
- Telecom held 58.0% of 2025 value, because data center and carrier buildings hold most of the short links that multimode serves.
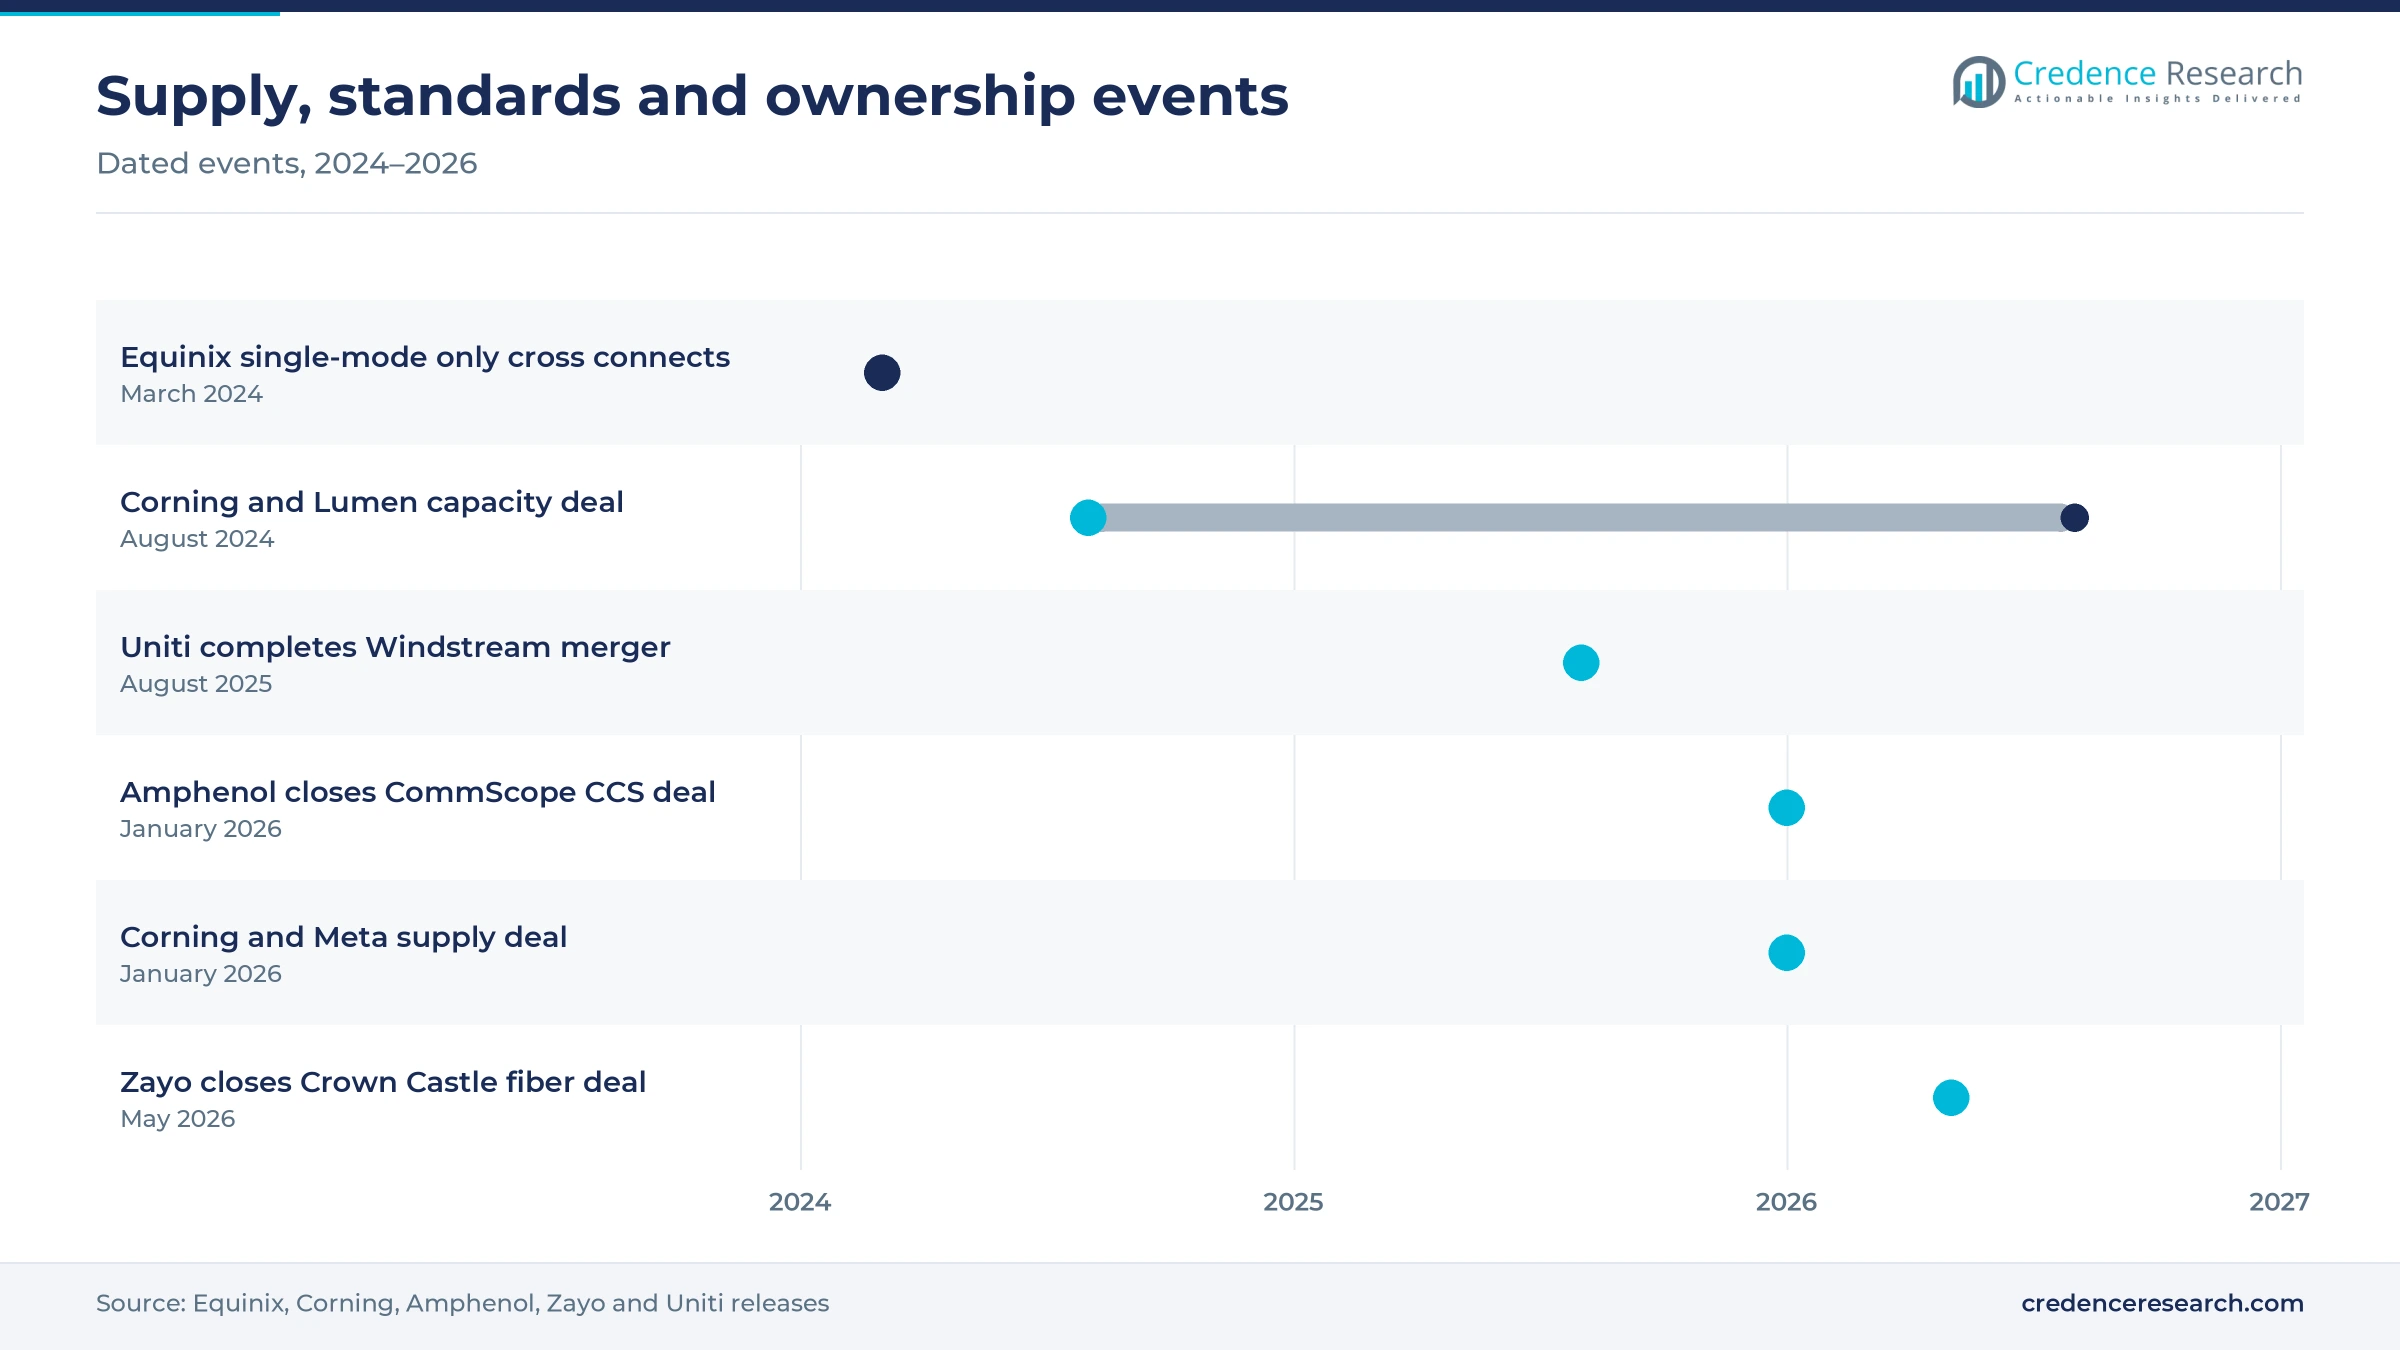
- Equinix has offered only single-mode cross connects in its IBX data centers since March 31, 2024, a clear signal of substitution risk for multimode.
- Corning agreed in January 2026 to supply Meta with up to USD 6 billion of fiber, cable and connectivity products, which tightens cable supply for other buyers.
Graded-index glass and telecom buyers hold most value
Graded-index fiber leads and grows fastest
Based on fiber type, the market is categorized into step-index multimode fiber and graded-index multimode fiber. Graded-index Multimode Fiber led with 91.0% of 2025 value because every OM3, OM4 and OM5 grade is graded-index, and Panduit rates its 12-fiber OM4 distribution cable for 10 Gb/s over 550 meters at 850 nanometers. Graded-index Multimode Fiber also grows fastest at 7.1% a year, as OFS, now Lightera, launched an OM4+ fiber in February 2024 that supports 800G and 1.6T short-reach optics for AI clusters at full distance. Step-index fiber stays in large-core and sensing links where bandwidth matters less than ruggedness.
Glass leads while plastic stays in rugged niches
Based on material type, the market is categorized into plastic and glass. Glass led with 93.2% of 2025 value because data halls, campuses and plants use silica fiber for its bandwidth, and a 12-strand OM4 plenum cable lists at USD 1.36 per foot at one U.S. distributor. Glass also grows fastest at 7.1% a year, as the IEEE 802.3cz automotive standard published in June 2023 specifies glass OM3 fiber for in-vehicle links of up to 40 meters. Plastic fiber keeps a role in short industrial and consumer links, but no public source shows its U.S. volumes, which is an evidence gap.
Telecom leads while vehicles grow fastest
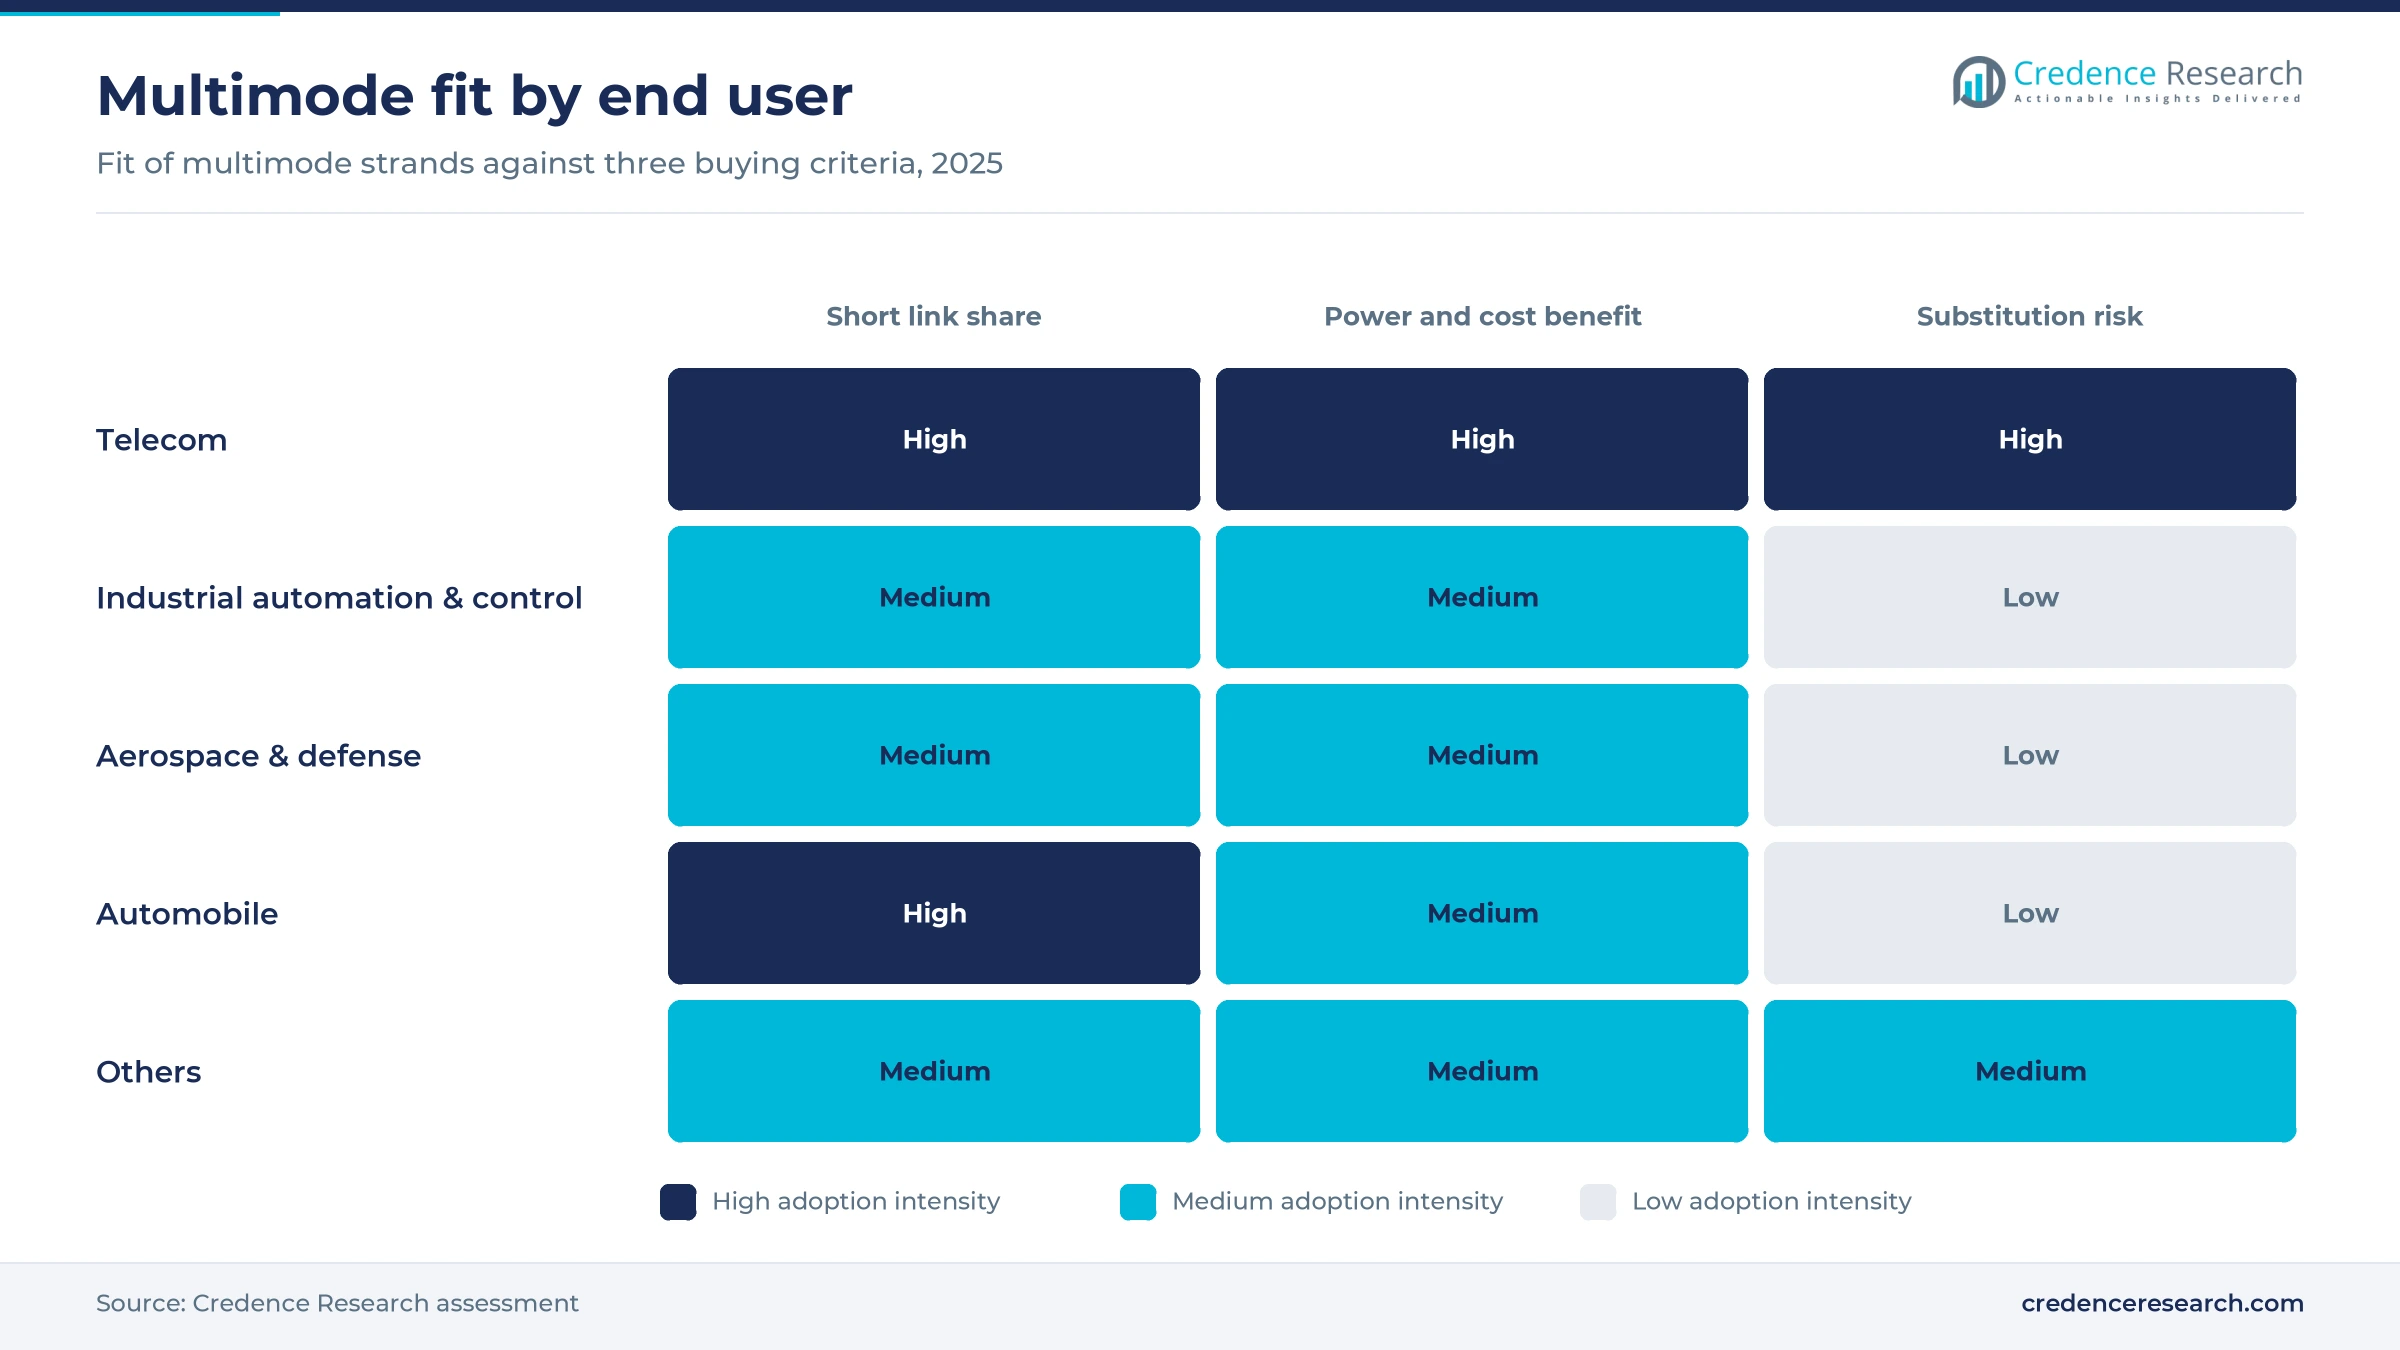
Based on end user, the market is categorized into telecom, automobile, industrial automation & control, aerospace & defense, and others. Telecom led with 58.0% of 2025 value because data center and carrier buildings hold most short links, and Northern Virginia alone absorbed 1,102.0 MW of data center capacity in 2025, CBRE said, the most of any primary market. Automobile grows fastest at 8.9% a year from a small base, as the automotive standard noted above gives carmakers multigigabit optical links that survive engine-bay heat and cold. Industrial buyers grow slower because factory construction spending fell in 2025.
| Segment Group | Leading Sub-segment | Share, 2025 | Fastest-growing Sub-segment | CAGR, 2026–2035 |
|---|---|---|---|---|
| By Fiber Type | Graded-index Multimode Fiber | 91.0% | Graded-index Multimode Fiber | 7.1% |
| By Material Type | Glass | 93.2% | Glass | 7.1% |
| By End User | Telecom | 58.0% | Automobile | 8.9% |
Dark strands are priced per fiber mile, cable per foot
Dark fiber is priced by the strand and the distance, while multimode cable plant bought for private networks is priced by the foot. Public right-of-way and municipal schedules give the clearest view of strand pricing, and Palo Alto lists discounts for quantity, route length, ring topology and term on top of its base rate. Long rights of use are largely prepaid, which gives lessors cash to fund builds and gives buyers fixed costs for two decades. Cable prices move with fiber grade, jacket rating and the supply tightness described in the challenges, so OM4 plenum cable costs more than riser-rated OM3.
| Offer or segment | Typical price or fee | Basis |
|---|---|---|
| Municipal backbone dark fiber license | USD 490.75 per fiber mile per month before discounts | City of Palo Alto Utilities, schedule EDF-1, July 2026 |
| Hyperscale dark fiber right of use | 20- to 30-year term, largely prepaid | Uniti chief financial officer, December 2024 |
| 12-strand OM4 indoor/outdoor plenum cable | USD 1.36 per foot | Discount Low Voltage list price, November 2026 |
Request a Free Sample
Fill in your details and we'll send you a free sample report.
- Sample data tables & charts
- Research methodology
Data hall capacity, cable deals and VCSEL optics lift demand
Record data hall capacity multiplies short links
New data hall capacity sets the volume of short links, because each GPU rack and switch row needs dense fiber within a few dozen meters. Supply in primary North American data center markets rose 36% to 9,432 MW in 2025, CBRE reported, while vacancy fell to a record low of 1.4%. A further 5,994.4 MW was under construction at year end, so the pipeline of halls that need cabling stays large into 2027. Low vacancy means new capacity is leased before it opens, which lets operators commit to cable purchases early. Cable makers that sell pre-terminated trunks and other structured cabling gain most, while installers that cannot staff large halls lose share.
Hyperscalers lock in fiber cable supply
Large buyers are reserving fiber and cable output years ahead, which turns short-reach cabling into a planned, contracted purchase. Lumen agreed in August 2024 to take 10% of Corning's worldwide fiber capacity each year for two years, Corning said. Corning then agreed in January 2026 to supply Meta with up to USD 6 billion of optical fiber, cable and connectivity products, with Meta as anchor customer for an expansion of its Hickory, North Carolina, cable plant. Prysmian announced USD 1.25 billion in August 2026 to more than double its U.S. fiber and optical cable capacity, with 615 jobs planned. These deals favor buyers with scale, while smaller data center owners face longer lead times.
Low-power laser optics keep multimode on cost
Short-reach optics built on vertical-cavity lasers keep multimode cheaper and cooler to run than single-mode on the shortest links, which protects demand inside racks and rows. VCSEL-based multimode transceivers use more than 20% less power than single-mode parts, according to Corning engineers. OFS, now Lightera, said in February 2024 that the growth of AI clusters increases demand for reliable, low-power multimode links. Corning also noted that the short-reach standard limits OM3 to 60 meters for single-wavelength optics, which pushes new halls toward OM4 and OM5. Suppliers of vertical-cavity surface-emitting lasers and higher grades gain, while OM3 plant faces early replacement.
Carrier route builds feed new campuses
Fiber lessors are building high-count routes into new campuses, and each campus they reach then needs in-building multimode runs. Lightpath began a 102-route-mile network in Columbus in April 2025, scheduled for mid-2026, serving a market with 1.8 GW of data center capacity in operation and 3 GW more planned, the company said. FiberLight announced USD 350 million in February 2026 for 1,400 route miles in West Texas, Lightwave reported. Uniti signed a 20-year contract with a hyperscale customer in Montgomery, Alabama, in October 2024 for a 90-route-mile ring. Campus owners gain diverse routes, and cabling installers gain follow-on in-building work.
Private fabrics and lessor mergers reshape fiber supply
Carriers are shifting toward contracted AI fabrics
Carriers are shifting toward large private fiber contracts with hyperscalers, which changes who controls the routes that multimode campus plant hands off to. Lumen had signed nearly USD 13 billion of Private Connectivity Fabric deals by February 2026, Lightwave reported, including about USD 2.5 billion in the fourth quarter of 2025. Zayo added about 1.15 million fiber miles in North America in 2025 and offers quick connections at more than 150 data center locations. Lumen sells dedicated fabrics to the largest buyers, while Zayo competes on route breadth and fast delivery, so enterprise buyers comparing the two weigh contract scale against reach. Because these routes are single-mode, the effect on multimode is indirect, through the campus and in-building runs that each new hyperscale handoff requires.
Consolidation is reshaping the fiber lessor base
Fiber ownership is consolidating, which gives buyers fewer but larger suppliers for campus and metro routes. Zayo closed its USD 4.25 billion purchase of Crown Castle's fiber business on May 1, 2026, adding about 90,000 route miles for a North American network of about 224,000, Fierce Network reported. Uniti completed its merger with Windstream on Aug. 1, 2025, combining wholesale fiber with Kinetic's regional network. For campus and data hall owners, the practical effect is fewer counterparties when a site needs diverse entry routes, because one lessor now often owns both paths into a building, and owners that negotiate route diversity early keep more choice. Larger lessors can bundle routes and campus access, while smaller buyers lose pricing leverage.
Automotive optical Ethernet is an emerging opening
In-vehicle optical networks are an opening for multimode glass fiber, because camera and sensor data rates are outgrowing copper harnesses. The IEEE automotive optical Ethernet standard published in June 2023 defines links at 2.5 to 50 Gb/s over OM3 fiber, KDPOF said. The standard rates the links from minus 40 to 105 degrees Celsius and allows up to four inline connectors at 25 Gb/s. Public sources do not yet show U.S. production vehicles using these links, which is an evidence gap, so the opening depends on carmaker adoption. Cable makers with automotive-grade jackets and connectors are best placed if adoption begins.
Rollable ribbon and OM4+ grades are an opening for AI halls
AI halls need denser multimode plant that installs faster, which opens room for new cable formats and fiber grades. OFS, now Lightera, introduced rollable ribbon cables for AI and HPC networks in February 2024, saying they suit density needs better than flat ribbon and active optical cables. Corning engineers answered the BiDi reach shortfall described in the challenges by proposing new fibers rated for 80 meters and longer. Its OM4+ fiber, launched at the same time, supports 800G-SR4.2 and 1.6T-SR8.2 links, which match the optics that AI clusters now order. Grades that restore full reach at 800G let operators keep their row lengths, and suppliers that certify such grades can charge more per meter. Owners of older OM3 plant gain little from these new grades, since their reach is already short.
Single-mode substitution and reach limits cap growth
Colocation operators standardize on single-mode
Colocation operators are moving cross connects to single-mode fiber, which removes one of the largest multimode uses. Single-mode has been the only media type for cross connects in Equinix IBX data centers globally since March 31, 2024, Equinix states, and new IBX sites offer only single-mode. Multimode cabling contractors and owners of older multimode meet-me rooms are most exposed. Suppliers can hold value inside customer cages and GPU rows, where links stay short.
Faster optics shorten multimode reach
Each step up in the speed of optical transceivers shortens how far multimode can carry a signal, which pushes longer runs to single-mode. Corning engineers found that Terabit BiDi optics reach 45 meters on OM3 and 70 meters on OM4, about 30 meters short of what operators expected. Data halls with long rows and spine switches far from racks are most exposed, since a 120-meter link no longer fits multimode. Shorter row designs and the newer OM4+ grades limit the loss for operators.
Falling factory construction slows plant cabling
Industrial buyers install multimode mainly when they build or refit plants, so slower factory construction delays cabling orders. U.S. manufacturing construction spending fell 6.5% to USD 220.4 billion in 2025, the Census Bureau reported, and the December 2025 annual rate was 11.4% below a year earlier. Automation integrators and cable distributors that serve factories are most exposed. Retrofits and automation upgrades on existing lines offer partial relief for suppliers.
Reserved cable capacity tightens supply for smaller buyers
Large multiyear supply deals reserve fiber and cable output for a few buyers, which can lengthen lead times for everyone else. The Lumen and Meta agreements with Corning noted above tie a share of output to two customers, and Prysmian's August 2026 U.S. capacity plan remains an announcement without a completion date. Regional data center owners, universities and hospitals buying smaller cable lots are most exposed if demand outruns new capacity. Early ordering and qualification of a second cable source reduce the risk for these buyers.
The South leads on Northern Virginia and Atlanta campuses
| Region | Value, 2025 (USD million) | Share, 2025 | CAGR, 2026–2035 |
|---|---|---|---|
| South | 199.2 | 41.5% | 7.2% |
| West | 108.0 | 22.5% | 7.0% |
| Northeast | 88.8 | 18.5% | 6.2% |
| Midwest | 84.0 | 17.5% | 7.6% |
The South leads on Northern Virginia and Atlanta
The South held 41.5% of 2025 value and grows at 7.2% a year through 2035. Northern Virginia held 4,039.6 MW of data center inventory at the end of 2025 with vacancy of just 0.5%, CBRE said, the largest market in the country. Atlanta reached 1,459.2 MW, up 458.8 MW in a year, with 2,076 MW under construction. Dallas-Fort Worth and West Texas add further campuses, so the South combines the largest base of data center colocation with steady new halls.
The West rests on Phoenix and Oregon campuses
The West held 22.5% of 2025 value and grows at 7.0% a year. Phoenix held 807.3 MW of data center inventory at the end of 2025, CBRE said, and this capacity anchors regional multimode demand for in-hall links. Lightpath entered the Phoenix market with a new fiber network in February 2025. Silicon Valley grows modestly because power is scarce, while Central Washington and Hillsboro, Oregon, attract large campuses. Public sources do not split multimode spending by state, so this share is estimated from capacity.
The Northeast leans on enterprise and campus networks
The Northeast held 18.5% of 2025 value and grows at 6.2% a year, the slowest pace of the four. Southern California, Austin-San Antonio and Central Washington have passed New York Tri-State in data center inventory, CBRE noted, which shows slower hall building in the region. Demand rests more on hospital, university and financial campus networks, where in-building multimode is replaced on refresh cycles rather than built new.
The Midwest grows fastest on Columbus and Chicago
The Midwest held 17.5% of 2025 value and grows fastest at 7.6% a year. Chicago held 904.6 MW of data center inventory at the end of 2025, CBRE said, and Columbus counts 1.8 GW in operation with 3 GW more planned or under construction, according to Lightpath. These campus builds come from a smaller base than the South, so new halls lift the regional share of short-link cabling faster.
Cable supply deals, carrier mergers and new standards
| Development | Status and market relevance |
|---|---|
| In March 2024, Equinix made single-mode fiber the only cross connect media type in its IBX data centers globally. | Completed; multimode cross connects are no longer offered at new sites. |
| In August 2024, Corning and Lumen agreed that Lumen would reserve 10% of Corning's global fiber capacity each year for two years. | Supply agreement signed; it reserves two years of Corning capacity for Lumen. |
| In January 2026, Amphenol completed its acquisition of CommScope's Connectivity and Cable Solutions business. | Completed; the fiber connectivity unit now sits in Amphenol's communications segment. |
| In January 2026, Corning and Meta agreed a multiyear deal worth up to USD 6 billion for fiber, cable and connectivity products. | Agreement signed; construction of the Hickory, North Carolina, expansion started in March 2026. |
| In May 2026, Zayo completed its purchase of Crown Castle's fiber solutions business, adding about 90,000 route miles. | Completed; Zayo also supplies fiber to the small cell business bought by EQT. |
OM4 and OM5 grades, wideband optics and rollable ribbon
- OM4 fiber remains the default grade for new data halls, because OM3 stops at 60 meters with the newest single-wavelength optics.
- OM5 wideband fiber carries several short wavelengths on one strand, which suits bidirectional optics that cut the number of strands per link.
- Rollable ribbon cable packs high fiber counts into small ducts and splices in groups, which shortens installation time in dense AI halls.
- Pre-terminated trunks arrive with factory-polished connectors, which reduces on-site labor and test failures for large data hall builds.
Need a Custom Version of This Report?
Tailor the scope, geography, or segments to your exact requirements.
- Custom geography or segment scope
- Direct access to our analyst team
Cable makers hold the strands while carriers hold routes
Competition splits between makers of multimode fiber and cable and connectivity suppliers that turn it into trunks, panels and assemblies. Corning competes on draw tower scale and multiyear supply deals with hyperscalers, while Prysmian is expanding U.S. fiber and cable plants to win the same buyers. Lightera competes on multimode grades designed for AI optics, and Amphenol gained a large fiber connectivity range when it bought CommScope's cable unit in January 2026. Leviton sells factory-tested OM4 MTP trunks of 12 to 288 fibers for data centers, and Siemon lists OM3 and OM4 multimode cable alongside plug-and-play trunks. Belden lists OM4 MPO trunks for data centers and equipment rooms, while Panduit sells OM4 and OM5 cabling systems to enterprise installers. Fiber lessors such as Zayo, Lumen and Uniti lease the mostly single-mode routes between buildings, so they shape where campuses rise rather than competing for multimode strands.
How do cable makers and fiber lessors split the supply side?
Supply runs in two tiers of companies that rarely overlap in what they sell. A few fiber makers with draw towers, led by Corning, Lightera and Prysmian, make the multimode glass, and they and connectivity firms such as Amphenol's CommScope unit and Panduit sell cable, trunks and panels through distributors and installers. Fiber lessors such as Zayo, Lumen and Uniti own the conduits and routes between buildings, which are mostly single-mode. Draw tower capacity and installer certification form the main barriers to entry. Margins sit with makers of pre-terminated assemblies and with lessors that own scarce rights of way, while generic cable resellers earn the least.
Fiber makers and cabling suppliers buyers shortlist
| Company | Type | Role in the market |
|---|---|---|
| Corning Incorporated | Fiber and cable maker | Multimode fiber and cable, U.S. plants in North Carolina |
| Amphenol Corporation (CommScope CCS) | Connectivity supplier | Fiber cable and connectivity for data centers and buildings |
| Panduit Corp. | Connectivity supplier | OM4 and OM5 cabling systems for enterprise and data centers |
| Lightera (Furukawa Electric) | Fiber and cable maker | LaserWave multimode fiber and rollable ribbon cable |
| Prysmian Group | Fiber and cable maker | Optical fiber and cable plants in the Carolinas and Tennessee |
| Leviton Manufacturing Co. | Connectivity supplier | Factory-tested OM4 MTP trunks of 12 to 288 fibers for data centers |
| Siemon | Connectivity supplier | OM3 and OM4 multimode cable, trunks and jumpers |
| Belden Inc. | Connectivity supplier | OM4 MPO trunks for data centers and equipment rooms |
In-hall AI clusters and vehicle links carry the upside
Credence Research's view is that multimode dark fiber keeps a defined but narrowing role, set by link length rather than by data center volume alone. Data hall construction will keep adding short links, and low-power laser optics keep multimode cheaper on the shortest of them. Each rise in optic speed, however, moves more links to single-mode, as the Equinix decision shows. Suppliers that sell OM4+ grades, dense trunks and automotive-grade cable hold the best position. Buyers should design rows around the reach of the optics they plan to use after 2028. Multimode demand in the South, the largest of the four regions, depends most on new halls in Northern Virginia and Atlanta.
Estimates rest on capacity, construction and price data
The report uses 2025 as the base year and 2026 to 2035 as the forecast period, with values in U.S. dollars. Market values come from the Credence Research model, built top-down from U.S. dark fiber lease and right-of-use revenue, with a multimode share set from fiber reach limits and operator media choices, plus the multimode cable plant that private networks install unlit. Regional and segment splits are Credence Research estimates based on data center capacity, construction spending and standards. Sources include Census Bureau construction data, company filings and releases, IEEE standards material, public price schedules and trade press. No interviews or surveys were conducted for this edition of the report.
Link length decides how much value stays multimode
Through 2035, multimode dark fiber value tracks the number of short links inside data halls, campuses and plants. Data hall construction keeps volume rising, while single-mode takes a larger share of longer links as optic speeds rise. The South keeps the largest share and the Midwest gains on new campuses. Automotive optical Ethernet is the main new use if carmakers adopt it. Suppliers that match fiber grades to the reach of each optic generation keep the most value. The U.S. multimode dark fiber market reaches USD 946.9 million by 2035 in the base case, up from USD 513.7 million in 2026.
Single-mode substitution sets the range of outcomes
The range of outcomes depends mainly on how fast data hall designers move short links to single-mode as optic speeds rise. Data hall construction and cable supply set the volume, while the share of links that stay under about 70 meters decides how much of that volume remains multimode. Automotive optical Ethernet adds upside only if carmakers adopt it in U.S. production vehicles.
| Scenario | CAGR, 2026–2035 | Value, 2035 | What has to hold |
|---|---|---|---|
| Downside | 5.0% | USD 799.0 million | AI halls move most rack and row links to single-mode optics by 2030 |
| Base | 7.03% | USD 946.9 million | Multimode keeps rack and row links under about 70 meters |
| Upside | 8.5% | USD 1.07 billion | OM4+ grades restore full short reach and carmakers adopt optical Ethernet |
Frequently Asked Questions
How big is the U.S. multimode dark fiber market?
Which region leads the U.S. multimode dark fiber market?
Why do data centers still use multimode fiber?
What is the main risk to multimode dark fiber demand?
How do Lumen and Zayo differ as fiber suppliers?
Which end user leads the market?
How is dark fiber priced in the United States?
Which companies supply multimode fiber in the United States?
Table of Content
Chapter 1 Market Segmentation
- 1.1 Segmentation Framework
- 1.1.1 Product and Service Classification
- 1.1.2 Application and End-Use Classification
- 1.1.3 Technology and Solution Classification
- 1.1.4 Customer and Distribution Channel Classification
- 1.1.5 Geographic Segmentation
- 1.1.6 Market Segment Definitions and Boundaries
- 1.2 By Fiber Type
- 1.2.1 Graded-index Multimode Fiber
- 1.2.2 Step-index Multimode Fiber
- 1.3 By Material Type
- 1.3.1 Glass
- 1.3.2 Plastic
- 1.4 By End User
- 1.4.1 Telecom
- 1.4.2 Industrial Automation & Control
- 1.4.3 Aerospace & Defense
- 1.4.4 Automobile
- 1.4.5 Others
Chapter 2 Introduction
- 2.1 Report Objectives and Scope
- 2.2 Product Definition and Industry Terminology
- 2.3 Market Inclusions and Exclusions
- 2.4 Research Process
- 2.4.1 Primary Research and Expert Interviews
- 2.4.2 Secondary Research and Source Review
- 2.4.3 Top-Down and Bottom-Up Estimation
- 2.4.4 Data Triangulation and Verification
- 2.5 Market Size Measurement Basis
- 2.5.1 2025: USD 480.0 million → 2035: USD 946.9 million
- 2.6 Historical and Forecast Reference Periods
- 2.6.1 Historical Period: 2018-2025
- 2.6.2 Base Year: 2025
- 2.6.3 Forecast Period: 2025-2035
- 2.7 Research Assumptions and Limitations
Chapter 3 Executive Summary
- 3.1 Market Snapshot and Key Findings
- 3.2 Base-Year Market Size, 2025
- 3.3 Forecast Market Size, 2035
- 3.4 Revenue and Volume Growth Outlook
- 3.5 Key Demand and Supply Indicators
- 3.6 Leading Market Segments
- 3.7 Fastest-Growing Market Opportunities
- 3.8 Regional Performance Highlights
- 3.9 Technology and Industry Transformation
- 3.10 Competitive Landscape Summary
- 3.11 Analyst View and Strategic Implications
Chapter 4 U.S. Multimode Dark Fiber Market Trends and Developments
- 4.1 Historical Industry Development, 2018-2025
- 4.2 Recent Market Trends and Developments
- 4.3 Demand and Customer Behavior Trends
- 4.4 Technology and Product Innovation
- 4.5 Artificial Intelligence, Automation and Digitalization
- 4.6 Local Manufacturing and Supply Chain Realignment
- 4.7 Industry Partnerships, Mergers and Acquisitions
- 4.8 Sustainability and Circular Economy Developments
- 4.9 Government and Private Sector Investment Trends
- 4.10 Emerging Business Models and Commercialization
- 4.11 Industry Developments and Announcements
Chapter 5 U.S. Multimode Dark Fiber Market Production, Supply and Demand Analysis
- 5.1 Demand Trend and Consumption Analysis, 2018-2025
- 5.2 Demand Forecast, 2025-2035
- 5.3 Production and Output Trend, 2018-2025
- 5.4 Production and Output Forecast, 2025-2035
- 5.5 Installed Capacity and Capacity Utilization
- 5.6 Company-Wise Production Plants and Statistics
- 5.6.1 Installed Production Capacity
- 5.6.2 Actual Production
- 5.6.3 Planned Capacity and Expansion Targets
- 5.7 Supply Chain Structure and Procurement Trends
- 5.8 Supply-Demand Gap and Bottlenecks
- 5.9 Import Dependence and Sourcing Structure
- 5.10 Contract Manufacturing and Outsourcing
- 5.11 Regional Supply and Demand Concentration
Chapter 6 U.S. Multimode Dark Fiber Market Pricing Analysis
- 6.1 Pricing Structure and Measurement
- 6.2 Historical Pricing Trends, 2018-2025
- 6.3 Pricing Outlook, 2025-2035
- 6.4 Average Selling Price and Unit Economics
- 6.5 Pricing by Product and Market Segment
- 6.6 Geographic Pricing Differences
- 6.7 Key Input, Energy, Labor and Logistics Costs
- 6.8 Contract Pricing and Purchasing Models
- 6.9 Pricing Sensitivity and Competitive Positioning
- 6.10 Price, Margin and Profitability Implications
Chapter 7 U.S. Multimode Dark Fiber Market Dynamics
- 7.1 Market Growth Drivers
- 7.1.1 Demand-Side Drivers
- 7.1.2 Technology and Innovation Drivers
- 7.1.3 Infrastructure and Investment Drivers
- 7.1.4 Regulatory and Policy Drivers
- 7.2 Market Restraints
- 7.2.1 Cost and Affordability Constraints
- 7.2.2 Technology and Adoption Barriers
- 7.2.3 Supply Chain and Operational Constraints
- 7.3 Market Challenges
- 7.3.1 Competitive Pressure and Margin Erosion
- 7.3.2 Skills, Infrastructure and Implementation Gaps
- 7.4 Emerging Market Opportunities
- 7.5 Market Dynamics Impact and Time-Horizon Assessment
Chapter 8 U.S. Multimode Dark Fiber Value Chain Analysis
- 8.1 Industry Value Chain Overview
- 8.2 Upstream Suppliers and Critical Inputs
- 8.3 Technology and Component Providers
- 8.4 Manufacturing or Service Delivery
- 8.5 Distribution, Channel Partners and Integrators
- 8.6 Downstream Applications and End Users
- 8.7 Value Addition and Profit Pools
- 8.8 Vertical Integration and Outsourcing
- 8.9 Supplier Concentration and Risk
- 8.10 Supply Chain Localization and Resilience
Chapter 9 U.S. Multimode Dark Fiber Market Regulations and Policies
- 9.1 Relevant Laws, Standards and Compliance Frameworks
- 9.2 Product, Service, Safety and Quality Requirements
- 9.3 Government Policies, Incentives and Subsidies
- 9.4 Imports, Exports and Trade Barriers
- 9.5 Public Procurement and Local Content Requirements
- 9.6 Environmental and Sustainability Compliance
- 9.7 Data Protection, AI and Cybersecurity Compliance
- 9.8 Upcoming Policy Changes and Market Implications
Chapter 10 U.S. Multimode Dark Fiber Market Hotspots and Opportunities
- 10.1 Market Opportunity Mapping and Growth Hotspots
- 10.2 High-Growth Applications and Customer Groups
- 10.3 Underserved Markets and White-Space Opportunities
- 10.4 Emerging Technology and Product Opportunities
- 10.5 New Capacity and Investment Hotspots
- 10.6 Market Entry and Expansion Opportunities
- 10.7 Distribution and Partnership Opportunities
- 10.8 Near-Term and Long-Term Commercial Potential
- 10.9 Opportunity Attractiveness and Execution Risks
Chapter 11 U.S. Multimode Dark Fiber Market Outlook, 2025-2035
- 11.1 Market Size and Analysis
- 11.1.1 Revenue (Market Measurement: 2025: USD 480.0 million → 2035: USD 946.9 million)
- 11.1.2 Market Volume and Quantity Sold
- 11.1.3 Historical Market Size, 2018-2025
- 11.1.4 Base-Year Market Size, 2025
- 11.2 Market Forecast, 2025-2035
- 11.2.1 Revenue Forecast to 2035
- 11.2.2 Volume Forecast to 2035
- 11.2.3 CAGR and Year-on-Year Growth
- 11.2.4 Incremental Revenue Opportunity
- 11.3 Forecast Assumptions and Scenario Analysis
- 11.3.1 Base-Case Forecast
- 11.3.2 Optimistic and Conservative Scenarios
- 11.3.3 Technology, Pricing and Policy Sensitivities
- 11.4 Market Attractiveness and Growth Outlook
Chapter 12 U.S. Multimode Dark Fiber Market Segmentation and Outlook
- 12.1 Segmentation Summary and Market Shares, 2025
- 12.2 Largest and Fastest-Growing Segments
- 12.3 By Fiber Type - Market Size and Forecast, 2025-2035
- 12.3.1 Segment Definition and Scope
- 12.3.2 Historical Market Size, 2018-2025
- 12.3.3 Revenue Forecast, 2025-2035
- 12.3.4 Volume Forecast, 2025-2035
- 12.3.5 Base-Year Market Share, 2025
- 12.3.6 Segment CAGR and Growth Drivers
- 12.3.7 Subsegment Market Size and Forecast
- 12.3.7.1 Graded-index Multimode Fiber
- 12.3.7.2 Step-index Multimode Fiber
- 12.3.8 Subsegment Pricing and Adoption Trends
- 12.3.9 Leading Suppliers and Competition
- 12.3.10 Regional Demand and Opportunities
- 12.4 By Material Type - Market Size and Forecast, 2025-2035
- 12.4.1 Segment Definition and Scope
- 12.4.2 Historical Market Size, 2018-2025
- 12.4.3 Revenue Forecast, 2025-2035
- 12.4.4 Volume Forecast, 2025-2035
- 12.4.5 Base-Year Market Share, 2025
- 12.4.6 Segment CAGR and Growth Drivers
- 12.4.7 Subsegment Market Size and Forecast
- 12.4.7.1 Glass
- 12.4.7.2 Plastic
- 12.4.8 Subsegment Pricing and Adoption Trends
- 12.4.9 Leading Suppliers and Competition
- 12.4.10 Regional Demand and Opportunities
- 12.5 By End User - Market Size and Forecast, 2025-2035
- 12.5.1 Segment Definition and Scope
- 12.5.2 Historical Market Size, 2018-2025
- 12.5.3 Revenue Forecast, 2025-2035
- 12.5.4 Volume Forecast, 2025-2035
- 12.5.5 Base-Year Market Share, 2025
- 12.5.6 Segment CAGR and Growth Drivers
- 12.5.7 Subsegment Market Size and Forecast
- 12.5.7.1 Telecom
- 12.5.7.2 Industrial Automation & Control
- 12.5.7.3 Aerospace & Defense
- 12.5.7.4 Automobile
- 12.5.7.5 Others
- 12.5.8 Subsegment Pricing and Adoption Trends
- 12.5.9 Leading Suppliers and Competition
- 12.5.10 Regional Demand and Opportunities
- 12.6 Segment Growth Comparison
- 12.7 Segment Attractiveness and Priority Matrix
Chapter 13 U.S. Multimode Dark Fiber End-Use and Application Market Outlook
- 13.1 End-Use Industry and Customer Demand Structure
- 13.2 Leading Applications and Customer Groups
- 13.3 End-Use Market Size, Share and Forecast
- 13.4 Major End-Use Industry Deep Dives
- 13.4.1 Customer Requirements and Use Cases
- 13.4.2 Demand and Replacement Cycles
- 13.4.3 Technical and Regulatory Considerations
- 13.4.4 Purchasing and Procurement Models
- 13.4.5 Leading Vendors and Distribution Channels
- 13.4.6 Forecast and Commercial Opportunities
- 13.5 Emerging Applications and Cross-Segment Demand
- 13.6 End-Use Industry Investment Priorities
Chapter 14 U.S. Multimode Dark Fiber Geographic Market Outlook, 2025-2035
- 14.1 Domestic Market Distribution and Demand Clusters
- 14.2 State- or Province-Wise Market Size and Forecast, 2025-2035
- 14.3 City and Metropolitan Market Outlook
- 14.4 Industrial, Manufacturing and Commercial Clusters
- 14.5 Geographic Concentration of Key End Users
- 14.6 Local Pricing and Purchasing Differences
- 14.7 Domestic Production Facilities and Capacity Map
- 14.8 Local Infrastructure and Project Pipeline
- 14.9 State-Level Policy and Incentive Differences
- 14.10 Subnational Investment Hotspots and Opportunities
- 14.11 Distribution and Logistics Networks
- 14.12 Domestic Competitive Footprint
Chapter 15 U.S. Multimode Dark Fiber Technology, Innovation and Sustainability Outlook
- 15.1 Technology Landscape and Maturity
- 15.2 Product, Process and Service Innovation
- 15.3 AI, Automation and Digital Tools in the Industry
- 15.4 Technology Adoption and Performance Benchmarking
- 15.5 Innovation Pipeline and R&D Investment
- 15.6 Patent and Intellectual Property Trends
- 15.7 Energy Efficiency and Resource Management
- 15.8 Sustainability, Recycling and Circularity
- 15.9 Technology Roadmap, 2025-2035
- 15.10 Risks of Obsolescence and Technology Substitution
Chapter 16 U.S. Multimode Dark Fiber Market Key Strategic Imperatives
- 16.1 Growth and Market Entry Priorities
- 16.2 High-Return Products and Segments
- 16.3 Pricing, Profitability and Cost Optimization
- 16.4 Technology Investment and Product Differentiation
- 16.5 Supply Chain Localization and Resilience
- 16.6 Distribution and Customer Acquisition
- 16.7 Partnership, Acquisition and Capacity Strategy
- 16.8 Regional Expansion Priorities
- 16.9 Short-, Medium- and Long-Term Actions
Chapter 17 Competition Outlook
- 17.1 Industry Competition Characteristics
- 17.2 Market Structure and Concentration
- 17.3 Market Share and Competitive Positioning, 2025
- 17.4 Company-Wise Revenue and Product Benchmarking
- 17.5 Production and Service Capacity Benchmarking
- 17.6 Technology, Pricing and Differentiation
- 17.7 Regional Footprint and Distribution Strength
- 17.8 Mergers, Acquisitions and Strategic Alliances
- 17.9 New Entrants and Competitive Threats
- 17.10 Porter's Five Forces and Industry Attractiveness
- 17.11 Competitive Outlook, 2025-2035
Chapter 18 Company Profiles
- 18.1 Company Coverage and Selection Criteria
- 18.2 Corning Incorporated
- 18.2.1 Business Description
- 18.2.2 Company Ownership and Geographic Presence
- 18.2.3 Product and Service Portfolio
- 18.2.4 Manufacturing and Operating Footprint
- 18.2.5 Production Capacity and Expansion Plans
- 18.2.6 Financial Performance and Investment
- 18.2.7 Market Share and Competitive Position
- 18.2.8 Technology and Innovation Capabilities
- 18.2.9 Strategic Alliances or Partnerships
- 18.2.10 Recent Developments
- 18.2.11 Growth Strategy and Outlook
- 18.3 Amphenol Corporation (CommScope CCS)
- 18.4 Panduit Corp.
- 18.5 Lightera (Furukawa Electric)
- 18.6 Prysmian Group
- 18.7 Leviton Manufacturing Co.
- 18.8 Siemon
- 18.9 Belden Inc.
- 18.10 Other Relevant Market Participants
Note: Every listed company is profiled on the structure shown under the first company. The company list is preliminary and may change based on research findings, market developments, data availability and client requirements.
Chapter 19 Disclaimer
- 19.1 Research and Forecast Disclaimer
- 19.2 Data Source and Estimation Limitations
Note: The depth of individual sections depends on data availability for this market. Volume, capacity, trade and other unit-based metrics are included where applicable.

