
Market Overview
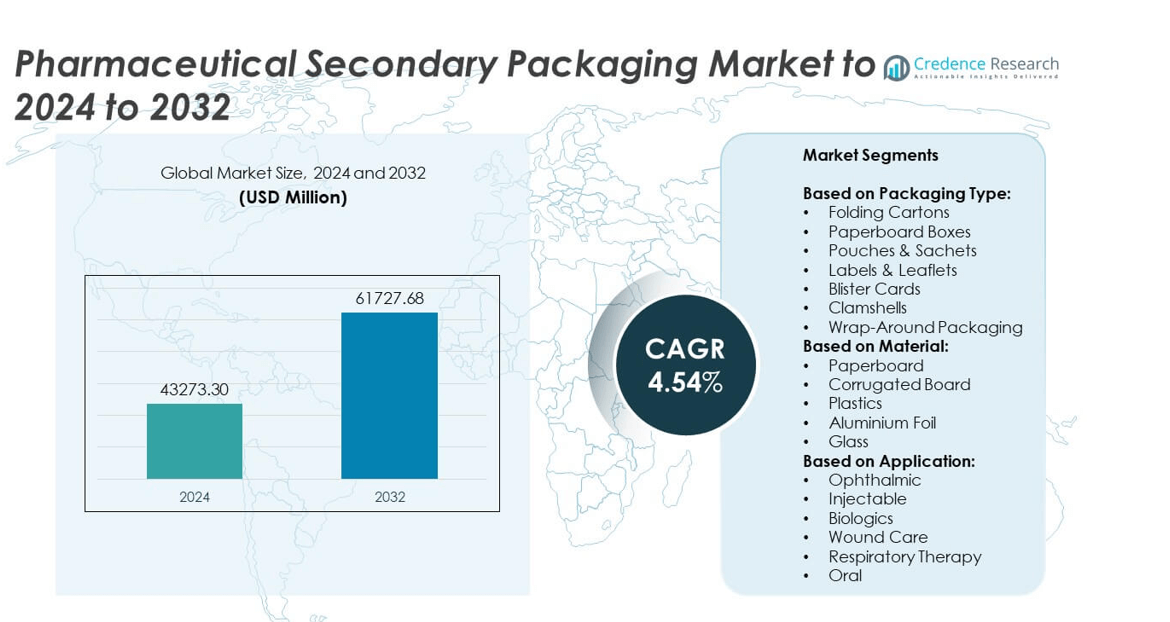
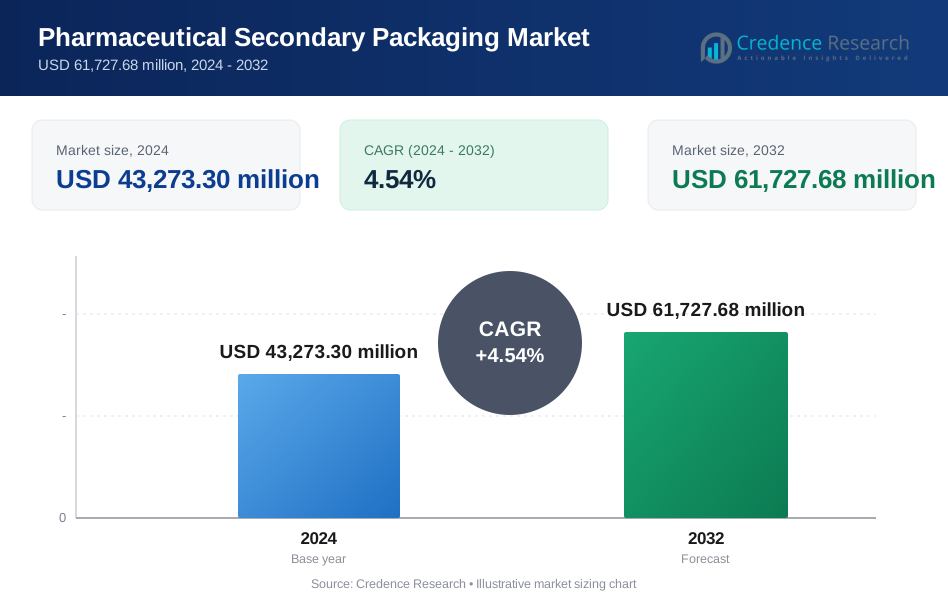
Pharmaceutical Secondary Packaging Market size was valued USD 43,273.30 Million in 2024 and is anticipated to reach USD 61,727.68 Million by 2032, at a CAGR of 4.54% during the forecast period.
| REPORT ATTRIBUTE | DETAILS |
|---|---|
| Historical Period | 2020-2023 |
| Base Year | 2024 |
| Forecast Period | 2025-2032 |
| Pharmaceutical Secondary Packaging Market Size 2024 | USD 43,273.30 Million |
| Pharmaceutical Secondary Packaging Market, CAGR | 4.54% |
| Pharmaceutical Secondary Packaging Market Size 2032 | USD 61,727.68 Million |
The pharmaceutical secondary packaging market is led by key players including Gerresheimer, Berry Global, Schreiner MediPharm, Graphic Packaging International, Amcor, Metsä Board, Constantia Flexibles, DS Smith, Stevanato, Körber Pharma Packaging, Marchesini, WestRock, Sonoco, Huhtamaki, and CCL Industries. These companies focus on innovative folding cartons, blister cards, and smart labeling solutions to meet global serialization and sustainability standards. North America emerged as the leading region, accounting for nearly 38% of the market share in 2024, driven by strong pharmaceutical production, advanced compliance regulations, and rising demand for sustainable and tamper-evident packaging solutions.
Market Insights
- The pharmaceutical secondary packaging market was valued at USD 43,273.30 million in 2024 and is expected to reach USD 61,727.68 million by 2032, growing at a CAGR of 4.54%.
- Growth is driven by regulatory compliance requirements, rising chronic disease prevalence, and demand for tamper-evident and eco-friendly packaging formats such as folding cartons and paperboard boxes.
- Key trends include adoption of smart packaging with RFID and QR codes, increasing automation in packaging lines, and rising use of recyclable and compostable materials to meet sustainability targets.
- Competition is strong with players focusing on innovation, capacity expansion, and partnerships with pharmaceutical companies to offer localized, cost-effective, and compliant packaging solutions.
- North America leads the market with 38% share, followed by Europe at 30% and Asia Pacific at 22%, while folding cartons remain the dominant segment, holding the largest share due to regulatory labeling and serialization needs.
Market Segmentation Analysis:
By Packaging Type
Folding cartons dominated the pharmaceutical secondary packaging market with over 30% share in 2024. Their popularity stems from versatility, cost-effectiveness, and compatibility with automated filling lines. They provide ample space for regulatory labeling and barcodes, supporting serialization compliance under global track-and-trace regulations. Rising demand for child-resistant and tamper-evident designs is driving innovations in folding carton solutions. Growth is also fueled by sustainability trends as manufacturers adopt recyclable paper-based substrates. Blister cards and pouches are gaining traction for single-dose packaging formats, while labels and leaflets remain essential for patient information and drug safety communication.
- For instance, Smurfit-WestRock manufactured 204.4 billion square feet of corrugated packaging in 2024.
By Material
Paperboard held the leading share of more than 35% in 2024, driven by its recyclability and printing flexibility. The material supports high-quality graphics for branding and regulatory compliance. Pharmaceutical companies prefer paperboard for folding cartons and cartons used for biologics and injectables. Corrugated board is used for shipping bulk pharmaceutical products, offering protection during transportation. Plastic usage remains strong in clamshells and blister cards, driven by durability and moisture resistance. Aluminium foil continues to be preferred for moisture-sensitive drugs, while glass-based secondary packaging is niche, primarily for premium injectable presentations and specialty biologics.
- For instance, Mondi’s Duino mill will produce 420,000 tonnes of recycled containerboard per year when fully operational.
By Application
Injectables accounted for the largest share, surpassing 40% in 2024, due to rising biologics and biosimilar launches. Secondary packaging ensures protection, sterility, and proper labeling of vials, prefilled syringes, and ampoules. Demand is rising for tamper-evident cartons and serialized labels to meet regulatory standards like DSCSA and EU FMD. Ophthalmic and respiratory therapy segments are growing with increasing demand for eye drops and inhalers, requiring compact and compliant packaging. Wound care and oral drug segments also contribute steadily, supported by patient-centric designs that improve adherence. Growth is accelerated by increasing chronic disease prevalence and expanding cold-chain logistics.
Market Overview
Regulatory Compliance and Serialization
Regulatory compliance is the key growth driver shaping the pharmaceutical secondary packaging market, influencing design, material selection, and production processes. Global mandates such as the U.S. DSCSA and EU FMD require full product serialization, tamper-evident seals, and robust traceability systems, pushing companies to adopt advanced printing technologies and secure packaging formats. Folding cartons and serialized labels are in higher demand as they offer space for barcodes, QR codes, and patient information. Investments in digital tracking systems have grown, ensuring supply chain transparency and patient safety while reducing risks of counterfeit products and recalls.
- For instance, in a pilot with five high-volume US retail pharmacies, RFXCEL’s serialization and track-and-trace integration yielded 35% better inventory accuracy and 45% faster recall response, and achieved almost full DSCSA compliance.
Rising Chronic Disease Prevalence
The growing prevalence of chronic illnesses such as diabetes, cardiovascular disorders, and cancer continues to accelerate the demand for injectables, biologics, and personalized medicines. These therapies require reliable secondary packaging to ensure sterility, accurate labeling, and protection during transport. Prefilled syringes, ampoules, and vials are increasingly packaged in tamper-evident cartons and trays with clear serialization to meet safety standards. The rising elderly population, higher rates of hospital visits, and expansion of vaccination programs are further fueling demand for secure, easy-to-handle packaging solutions that improve adherence and reduce contamination risks.
- For instance, the number of people with diabetes worldwide is projected to reach 643 million by 2030, with much of the increase in low- and middle-income countries.
Sustainability and Eco-friendly Materials
The global shift toward sustainability is a strong growth driver, with pharmaceutical companies focusing on recyclable and biodegradable packaging materials. Paperboard and compostable substrates are being used to replace plastic-based secondary packaging, aligning with government sustainability regulations and corporate ESG commitments. Manufacturers are investing in eco-friendly coatings, water-based inks, and lightweight designs to minimize carbon footprint without compromising product protection. This transition also appeals to environmentally conscious stakeholders, driving adoption of folding cartons and corrugated board that can be fully recycled, creating a competitive advantage for companies prioritizing green packaging solutions.
Key Trends & Opportunities
Smart and Connected Packaging
Smart packaging is emerging as a transformative trend, integrating QR codes, NFC, and RFID technologies into labels and cartons for enhanced authentication and traceability. This supports real-time supply chain monitoring and combats counterfeiting, a critical issue in pharmaceuticals. Patients benefit from interactive features that provide dosage reminders, educational content, and refill alerts, boosting adherence rates. With increasing demand for transparency, smart packaging is becoming a differentiator for pharmaceutical brands, opening new opportunities for value-added services and building trust with patients and healthcare providers.
- For instance, Tageos increased its annual global production capacity from over 7 billion RFID inlays and tags in 2023 to more than 9 billion by mid-2024, following the opening of new plants in Guangzhou, China, and Fletcher, North Carolina. The company has since grown its capacity to over 11 billion units as of mid-2025.
Growth of Biologics and Biosimilars
The rapid expansion of biologics and biosimilars is creating strong opportunities for specialized secondary packaging solutions. These products often require strict temperature control, moisture protection, and tamper-evident features to maintain efficacy during distribution. Innovation in insulated cartons, high-barrier pouches, and serialized labeling supports the growing demand. Cold-chain packaging solutions are being developed to ensure biologics reach patients safely and in optimal condition, driving investments in materials with enhanced barrier properties and intelligent temperature-monitoring devices integrated into secondary packaging.
- For instance, University of Illinois Health pharmacy tagged nearly 30,000 items using RFID between January and March 2024, averaging about 9,785 items per month.
Outsourcing to Contract Packaging Organizations
Pharmaceutical companies are increasingly outsourcing secondary packaging operations to contract packaging organizations (CPOs) to optimize costs, scale production, and ensure regulatory compliance. CPOs offer specialized capabilities such as serialization, aggregation, and custom packaging design, enabling faster market entry. This trend is especially strong in emerging markets, where local packaging facilities reduce logistics costs and improve lead times. Outsourcing also allows pharma firms to focus on core drug development activities while leveraging the expertise of packaging specialists to meet global quality and safety standards.
Key Challenges
High Packaging Costs
Rising raw material costs, stricter compliance requirements, and the push toward sustainable materials are significantly increasing overall packaging expenses. Lightweight yet durable designs require R&D investments, and incorporating tamper-evident features or serialization adds further cost. For manufacturers with large-scale production, these expenses can impact margins and pricing strategies. Companies are exploring cost optimization through bulk material procurement, automation, and standardization of packaging formats, but balancing cost control with compliance and sustainability goals remains a major challenge.
Regulatory Complexity and Counterfeiting
Navigating diverse regulatory requirements across multiple regions is complex and costly, as companies must frequently upgrade systems to stay compliant with evolving guidelines. Serialization requirements differ between countries, making global standardization difficult. At the same time, counterfeit drugs remain a serious threat, leading to risks of revenue loss and patient harm. Advanced anti-counterfeiting technologies such as holograms, tamper-evident seals, and blockchain-enabled tracking are being implemented, but these solutions demand significant capital investment, adding pressure on pharmaceutical packaging budgets and operations.
Regional Analysis
North America
North America held the largest share of around 38% of the pharmaceutical secondary packaging market in 2024. The region benefits from a strong pharmaceutical manufacturing base, advanced healthcare infrastructure, and strict regulatory requirements like DSCSA. Demand for serialization-ready folding cartons and tamper-evident labels remains high. Growth is driven by rising biologics production and increased adoption of sustainable paperboard packaging. The U.S. leads with major investments in automated packaging lines and smart labeling technologies. Canada supports market expansion with growing government healthcare initiatives and rising demand for high-quality packaging for injectable and specialty medicines.
Europe
Europe accounted for nearly 30% of the market share in 2024, supported by stringent compliance with EU FMD regulations that mandate serialization and tamper-proof packaging. Countries such as Germany, France, and the U.K. drive growth with high pharmaceutical exports and strong adoption of eco-friendly paperboard solutions. Demand for blister cards and folding cartons remains robust due to widespread use of prescription medicines. Increasing focus on sustainability and circular economy policies accelerates adoption of recyclable materials. Expansion of biologics production facilities and growth in contract packaging services further strengthen the regional market outlook.
Asia Pacific
Asia Pacific captured approximately 22% of the market share in 2024 and is the fastest-growing region. Rapid expansion of pharmaceutical manufacturing hubs in India, China, and South Korea drives high demand for cost-effective secondary packaging solutions. Rising population, growing healthcare access, and government investment in medicine distribution programs boost volume demand. Folding cartons and corrugated board packaging dominate due to affordability and scalability. Increasing export of generic drugs and biosimilars from this region encourages adoption of global serialization standards, supporting compliance and supply chain security across international markets.
Latin America
Latin America represented about 6% of the pharmaceutical secondary packaging market in 2024, with growth driven by expanding healthcare coverage and local drug manufacturing. Brazil and Mexico lead in production and consumption, creating demand for affordable and compliant packaging solutions. Adoption of tamper-evident and serialized labeling is rising as regulatory frameworks tighten. Cost-effective folding cartons and pouches remain popular formats for oral and over-the-counter medicines. Growing investments in packaging automation and expansion of pharmaceutical exports are expected to create new opportunities in the coming years, supporting steady regional market development.
Middle East & Africa
Middle East & Africa held nearly 4% share of the market in 2024, driven by increasing pharmaceutical imports and gradual expansion of local manufacturing facilities. Gulf countries such as Saudi Arabia and the UAE are investing in healthcare infrastructure, boosting demand for high-quality secondary packaging. Preference for cartons, leaflets, and labels is growing to ensure compliance with labeling regulations and patient safety requirements. South Africa leads demand in Africa, supported by government immunization programs and local drug packaging initiatives. Rising focus on serialization adoption is expected to support future market growth in the region.
Market Segmentations:
By Packaging Type:
- Folding Cartons
- Paperboard Boxes
- Pouches & Sachets
- Labels & Leaflets
- Blister Cards
- Clamshells
- Wrap-Around Packaging
By Material:
- Paperboard
- Corrugated Board
- Plastics
- Aluminium Foil
- Glass
By Application:
- Ophthalmic
- Injectable
- Biologics
- Wound Care
- Respiratory Therapy
- Oral
By Geography:
- North America
- U.S.
- Canada
- Mexico
- Europe
- Germany
- France
- U.K.
- Italy
- Spain
- Rest of Europe
- Asia Pacific
- China
- Japan
- India
- South Korea
- South-east Asia
- Rest of Asia Pacific
- Latin America
- Brazil
- Argentina
- Rest of Latin America
- Middle East & Africa
- GCC Countries
- South Africa
- Rest of the Middle East and Africa
Competitive Landscape
The pharmaceutical secondary packaging market is characterized by the presence of leading players such as Gerresheimer, Berry Global, Schreiner MediPharm, Graphic Packaging International, Amcor, Metsä Board, Constantia Flexibles, DS Smith, Stevanato, Körber Pharma Packaging, Marchesini, WestRock, Sonoco, Huhtamaki, and CCL Industries. These companies focus on product innovation, advanced materials, and compliance with global serialization and sustainability standards. Strategies include expanding production capacity, investing in automated packaging technologies, and developing eco-friendly solutions like recyclable paperboard and biodegradable films. Many players are enhancing global footprints through acquisitions and partnerships with pharmaceutical manufacturers to provide localized supply chain solutions. Digital printing, smart labeling, and tamper-evident features are major areas of focus to improve patient safety and combat counterfeiting. Competitive rivalry remains intense, with emphasis on differentiation through cost efficiency, regulatory compliance, and integration of value-added services such as contract packaging and serialization support to meet growing industry demands.
Key Player Analysis
- Gerresheimer
- Berry Global
- Schreiner MediPharm
- Graphic Packaging International
- Amcor
- Metsä Board
- Constantia Flexibles
- DS Smith
- Stevanato
- Körber Pharma Packaging
- Marchesini
- WestRock
- Sonoco
- Huhtamaki
- CCL Industries
Recent Developments
- In 2025, Marchesini showcased monoblock at the Pharmintech Trade show, solutions that integrate blister packaging with cartoning. The new alternating cartoner was designed to handle a wide range of formats at high speeds, offering pharmaceutical manufacturers the flexibility needed for various product types.
- In 2025, DS Smith unveiled TailorTemp, a fully fiber-based, temperature-controlled secondary packaging solution for pharmaceuticals.
- In 2024, Stevanato Group opened a new 65,000-square-meter plant in Latina, Italy. This facility included advanced production lines, primarily for Ez-fill pre-sterilized syringes, which are key components of pharmaceutical secondary packaging
Report Coverage
The research report offers an in-depth analysis based on Packaging Type, Material, Application and Geography. It details leading market players, providing an overview of their business, product offerings, investments, revenue streams, and key applications. Additionally, the report includes insights into the competitive environment, SWOT analysis, current market trends, as well as the primary drivers and constraints. Furthermore, it discusses various factors that have driven market expansion in recent years. The report also explores market dynamics, regulatory scenarios, and technological advancements that are shaping the industry. It assesses the impact of external factors and global economic changes on market growth. Lastly, it provides strategic recommendations for new entrants and established companies to navigate the complexities of the market.
Future Outlook
- Demand for serialization-ready packaging will rise due to stricter global compliance requirements.
- Adoption of recyclable and compostable paperboard solutions will accelerate to meet sustainability goals.
- Smart packaging with RFID, QR codes, and NFC tags will see wider integration.
- Growth in biologics and biosimilars will increase demand for cold-chain compatible secondary packaging.
- Automation in packaging lines will expand to improve efficiency and reduce labor costs.
- Contract packaging organizations will play a larger role in meeting flexible production needs.
- Digital printing will gain traction for customization, variable data, and faster turnaround times.
- Tamper-evident and child-resistant designs will be prioritized to enhance patient safety.
- Emerging markets will drive strong growth supported by local manufacturing expansion.
- Investment in anti-counterfeiting technologies will grow to protect supply chains and brand integrity.
Request a Free Sample
Fill in your details and we'll send you a free sample report.
- Sample data tables & charts
- Research methodology
Need a Custom Version of This Report?
Tailor the scope, geography, or segments to your exact requirements.
- Custom geography or segment scope
- Direct access to our analyst team
Frequently Asked Questions
What is the current market size for Pharmaceutical Secondary Packaging Market, and what is its projected size in 2032?
At what Compound Annual Growth Rate is the Pharmaceutical Secondary Packaging Market projected to grow between 2025 and 2032?
Which Pharmaceutical Secondary Packaging Market segment held the largest share in 2024?
What are the primary factors fueling the growth of the Pharmaceutical Secondary Packaging Market?
Who are the leading companies in the Pharmaceutical Secondary Packaging Market?
Table of Content
Chapter 1. Report Introduction
- 1.1 Report Description & Purpose
- 1.1.1 Report Title & Market Definition
- 1.1.2 Unique Selling Propositions (USP) & Key Differentiators
- 1.1.3 Value Proposition for Stakeholders
- 1.2 Research Objectives
- 1.2.1 Market Sizing Objectives (Volume & Revenue)
- 1.2.2 Segmentation Objectives
- 1.2.3 Competitive Intelligence Objectives
- 1.2.4 Forecast & Scenario Objectives
- 1.3 Report Scope
- 1.3.1 Pharmaceutical Secondary Packaging Scope – Types & Subtypes Covered
- 1.3.2 Geographic Scope – Regions & Countries Covered
- 1.3.3 Historical Period, Base Year & Forecast Period (2024; forecast to 2032)
- 1.3.4 Inclusions & Exclusions
- 1.4 HS Code & Classification Framework
- 1.5 Currency, Units & Pricing Basis
- 1.6 Target Stakeholders
- 1.7 Limitations & Assumptions
Chapter 2. Executive Summary
- 2.1 Global Pharmaceutical Secondary Packaging Market Snapshot
- 2.1.1 Market Size – Historical (2024) & Forecast (2024-2032) (2024: USD 43,273.30 million → 2032: USD 61,727.68 million)
- 2.1.2 Volume & Revenue – Global Totals
- 2.1.3 Key Market Highlights – Top Five Facts
- 2.2 Pharmaceutical Secondary Packaging Market Segmentation Snapshot
- 2.2.1 Market Split by Region – 2024 vs. 2032
- 2.3 Competitive Snapshot
- 2.3.1 Top 10 Players by Revenue Share – 2024
- 2.3.2 Top 10 Players by Volume Share – 2024
- 2.3.3 Recent Strategic Developments (18-Month Summary)
- 2.4 Key Investment Highlights & Strategic Conclusions
Chapter 3. Pharmaceutical Secondary Packaging Market Dynamics & Industry Analysis
- 3.1 Market Overview & Context
- 3.1.1 Pharmaceutical Secondary Packaging Market Position in the Broader Automotive Value Chain
- 3.1.2 OEM vs. Replacement Market Dynamics
- 3.1.3 Market Maturity & Development Stage by Region
- 3.2 Pharmaceutical Secondary Packaging Market Drivers
- 3.3 Pharmaceutical Secondary Packaging Market Restraints & Challenges
- 3.4 Pharmaceutical Secondary Packaging Market Opportunities
- 3.5 Porter's Five Forces Analysis
- 3.5.1 Threat of New Entrants
- 3.5.2 Bargaining Power of Suppliers
- 3.5.3 Bargaining Power of Buyers
- 3.5.4 Threat of Substitutes
- 3.5.5 Competitive Rivalry – Intensity Assessment
- 3.6 Pharmaceutical Secondary Packaging Value Chain Analysis
- 3.6.1 Upstream – Raw Material/Input Suppliers
- 3.6.1.1 Raw Material/Input 1
- 3.6.1.2 Raw Material/Input 2
- 3.6.1.3 Raw Material/Input 3
- 3.6.2 Midstream – Production/Manufacturing/Service Delivery
- 3.6.2.1 Production/Process Overview
- 3.6.2.2 Key Facility Locations & Capacity by Manufacturer
- 3.6.3 Downstream – Distribution & End Consumer
- 3.6.3.1 Primary Channel – B2B/OEM
- 3.6.3.2 Secondary Channels – Dealer, Retail, Online, Direct
- 3.6.4 Value Chain Profitability Analysis
- 3.6.1 Upstream – Raw Material/Input Suppliers
- 3.7 PESTEL Analysis
- 3.7.1 Political Factors
- 3.7.2 Economic Factors
- 3.7.3 Social Factors
- 3.7.4 Technological Factors
- 3.7.5 Environmental Factors
- 3.7.6 Legal Factors
- 3.8 Pharmaceutical Secondary Packaging Supply Chain Analysis
- 3.8.1 Raw Material/Input Supply Risk Assessment
- 3.8.2 Manufacturing Concentration Risk (Geographic Exposure)
- 3.8.3 Trade Disruption Impact Analysis
- 3.9 Regulatory & Policy Landscape
Note: The regulatory and policy landscape section covers regulations based on their applicability to the market, Pharmaceutical Secondary Packaging category, geography, and scope of the study. Only regulatory frameworks with a material impact on operations, compliance, trade, sustainability, or market access are analyzed in detail.
Chapter 4. Key Investment Pockets & Opportunity Analysis
- 4.1 Pharmaceutical Secondary Packaging Market Attractiveness Analysis
- 4.1.1 By Region – Investment Attractiveness Matrix (Volume × CAGR)
- 4.2 Absolute Revenue Growth Opportunity
- 4.2.1 By Region – Absolute USD Growth Through 2032
- 4.3 Incremental Volume Opportunity
- 4.3.1 By Region – Incremental Volume Through 2032
- 4.3.2 Segment – Incremental Volume
- 4.4 Emerging Submarket Opportunity Deep Dive (Subject to Applicability)
- 4.5 Emerging Market Opportunity Scorecards
- 4.5.1 United States
- 4.5.2 Europe
- 4.5.3 Asia
- 4.5.4 Middle East & Africa
Note: Emerging Market Opportunity Scorecards will be included based on relevance and strategic importance. Regions listed are indicative and may vary depending on data availability and market dynamics.
Chapter 5. Pharmaceutical Secondary Packaging Import-Export Analysis & Trade Flows
- 5.1 Global Trade Overview
- 5.1.1 Global Export Value by Country (2024)
- 5.1.2 Global Export Volume by Country (2024)
- 5.1.3 Global Import Value by Country (2024)
- 5.1.4 Global Import Volume by Country (2024)
- 5.1.5 Net Trade Balance by Country (2024)
- 5.2 Export Analysis – Segment
- 5.2.1 Type 1 (HS Code)
- 5.2.2 Type 2 (HS Code)
- 5.2.3 Type 3 (HS Code)
- 5.2.4 Type 4 (HS Code)
- 5.2.5 Type 5 (HS Code)
- 5.3 Import Analysis – Segment
- 5.3.1 Type 1 (HS Code)
- 5.3.2 Type 2 (HS Code)
- 5.3.3 Type 3 (HS Code)
- 5.3.4 Type 4 (HS Code)
- 5.3.5 Type 5 (HS Code)
- 5.4 Average Unit Trade Prices
- 5.4.1 Average Export Price – Segment & Country
- 5.4.2 Average Import Price – Segment & Source Country
- 5.4.3 Price Trends (2024)
- 5.5 Key Trade Route Analysis
- 5.5.1 Trade Route 1
- 5.5.2 Trade Route 2
- 5.5.3 Trade Route 3
- 5.5.4 Trade Route 4
- 5.5.5 Trade Route 5
- 5.6 Trade Policy Impact Assessment
- 5.6.1 US Anti-Dumping & Section 301 Tariffs
- 5.6.2 EU Customs Union Impact
- 5.6.3 Major Free Trade Agreements
- 5.6.4 USMCA Rules of Origin
Note: Trade policy analysis will be included only where relevant to the Pharmaceutical Secondary Packaging market.
Chapter 6. Competitive Landscape & Company Benchmarking
- 6.1 Pharmaceutical Secondary Packaging Market Concentration & Structure
- 6.1.1 Herfindahl-Hirschman Index (HHI) – vs. 2024
- 6.1.2 Tier 1, Tier 2 & Tier 3 Market Structure
- 6.1.3 Global, Regional & Local Player Dynamics
- 6.2 Pharmaceutical Secondary Packaging Market Share Analysis – 2024
- 6.2.1 Global Revenue Share by Company
- 6.2.2 Global Volume Share by Company
- 6.2.3 Regional Revenue Share
- 6.2.4 Market Share Evolution ( vs. 2024)
- 6.2.5 OEM Segment Share by Company
- 6.2.6 Replacement Segment Share by Company
- 6.3 Production/Delivery Capacity & Facility Analysis
- 6.3.1 Global Installed Capacity
- 6.3.2 Capacity Utilization Rates
- 6.3.3 Production/Output Volume
- 6.3.4 Facility Locations & Capacity Map
- 6.3.5 Planned Capacity Additions
- 6.4 Pharmaceutical Secondary Packaging Competitive Benchmarking Matrix
- 6.4.1 Revenue, Volume, CAGR & Profitability Comparison
- 6.4.2 Channel Revenue Mix
- 6.4.3 Geographic Revenue Exposure
- 6.4.4 R&D Intensity
- 6.4.5 Sustainability Maturity
- 6.5 Strategic Developments in Pharmaceutical Secondary Packaging (Last 24 Months)
- 6.5.1 Mergers, Acquisitions & Divestments
- 6.5.2 New Pharmaceutical Secondary Packaging Launches
- 6.5.3 Facility Expansions
- 6.5.4 Strategic Alliances, Joint Ventures & Partnerships
- 6.5.5 Distribution Expansion & Market Entry
- 6.5.6 Sustainability & ESG Initiatives
- 6.6 Competitive Strategy Mapping
- 6.6.1 Leader, Challenger, Follower & Niche Classification
- 6.6.2 Pricing Strategy Comparison
- 6.6.3 Channel Strategy Matrix
Note: Strategic developments are included based on their materiality and the availability of reliable information.
Chapter 7. Global Pharmaceutical Secondary Packaging Market – By Distribution Channel
- 7.1 Segment Overview
- 7.1.1 Volume & Revenue Split by Channel (2024 & 2032)
- 7.1.2 Channel Mix Evolution (2024-2032)
Chapter 8. Regional Market Analysis – Global Overview
- 8.1 Global Regional Overview
- 8.1.1 Regional Volume Share
- 8.1.2 Regional Revenue Share
- 8.1.3 Regional Volume by Region
- 8.1.4 Regional Revenue by Region
- 8.1.5 Regional Forecast Through 2032
- 8.2 Cross-Regional Segment Analysis
- 8.2.1 By Distribution Channel
- 8.2.2 By Brand/Price Tier
Chapter 9. North America Pharmaceutical Secondary Packaging Market
- 9.1 United States
- 9.2 Canada
- 9.3 Mexico
Chapter 10. Europe Pharmaceutical Secondary Packaging Market
- 10.1 Germany
- 10.2 France
- 10.3 Italy
- 10.4 United Kingdom
- 10.5 Spain
- 10.6 Poland
- 10.7 Russia
- 10.8 Netherlands
- 10.9 Belgium
- 10.10 Sweden
- 10.11 Denmark
- 10.12 Norway
- 10.13 Rest of Europe
Chapter 11. Asia Pacific Pharmaceutical Secondary Packaging Market
- 11.1 China
- 11.2 India
- 11.3 Japan
- 11.4 South Korea
- 11.5 Thailand
- 11.6 Indonesia
- 11.7 Vietnam
- 11.8 Malaysia
- 11.9 Australia
- 11.10 Rest of Asia Pacific
Chapter 12. Latin America Pharmaceutical Secondary Packaging Market
- 12.1 Brazil
- 12.2 Argentina
- 12.3 Colombia
- 12.4 Chile
- 12.5 Rest of Latin America
Chapter 13. Middle East Pharmaceutical Secondary Packaging Market
- 13.1 Saudi Arabia
- 13.2 United Arab Emirates
- 13.3 Turkey
- 13.4 Israel
- 13.5 Iran
- 13.6 Rest of the Middle East
Chapter 14. Africa Pharmaceutical Secondary Packaging Market
- 14.1 South Africa
- 14.2 Egypt
- 14.3 Nigeria
- 14.4 Morocco
- 14.5 Rest of Africa
Chapter 15. Pharmaceutical Secondary Packaging Company Profiles
- 15.1 [Company 01]
- 15.1.1 Company Overview
- 15.1.2 Key Management Personnel
- 15.1.3 Products & Services Portfolio
- 15.1.4 Financial Performance
- 15.1.5 Key Market Focus & Geographic Presence
- 15.1.6 Recent Developments & Strategic Initiatives
Note: The company profile list is preliminary and may change based on research findings, market developments, data availability, and client requirements.
Chapter 16. Appendices
- Appendix A – List of Abbreviations & Acronyms
- Appendix B – Industry Classification Code Reference – Full Series
- Appendix C – Production & Capacity Data Tables
- Appendix D – End-Use & Demand Base Tables
- Appendix E – Consumption & Replacement Rate Assumptions
- Appendix F – ASP Reference Tables
- Appendix G – Manufacturing & Facility Database
- Appendix H – Import-Export Data Tables
- Appendix I – Regulatory Summary Tables
- Appendix J – Primary Research Participant List (Anonymized)
- Appendix K – Primary Research Questionnaire Framework
- Appendix L – Data Sources & Bibliography
- Appendix M – Market Size Divergence & Source Comparison
Chapter 17. Research Methodology
- 17.1 Research Framework & Philosophy
- 17.2 Secondary Research – Sources, Hierarchy & Data Extraction
- 17.3 Data Modeling – Bottom-Up & Top-Down Market Sizing
- 17.4 Primary Research – Stakeholder Framework, LOI & Sample Sizes
- 17.5 Forecast Methodology – Regression, Scenario & Sensitivity Analysis
- 17.6 Quality Control – Four-Layer Validation Framework
- 17.7 Limitations & Standard Assumptions
- 17.8 Disclaimer
