
Market Overview:
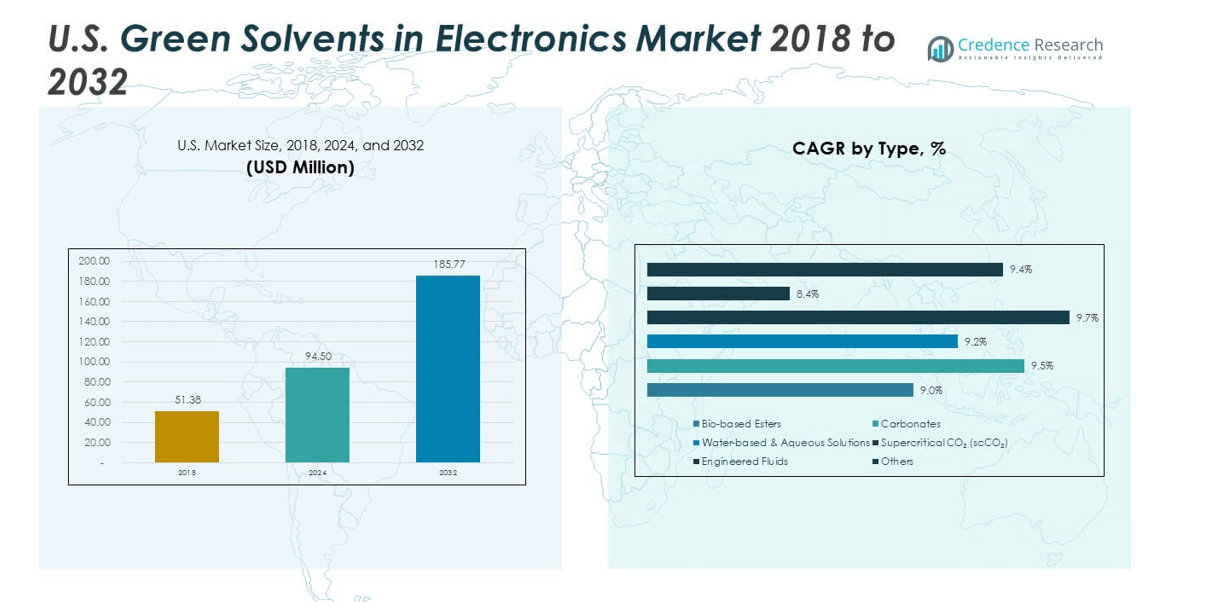
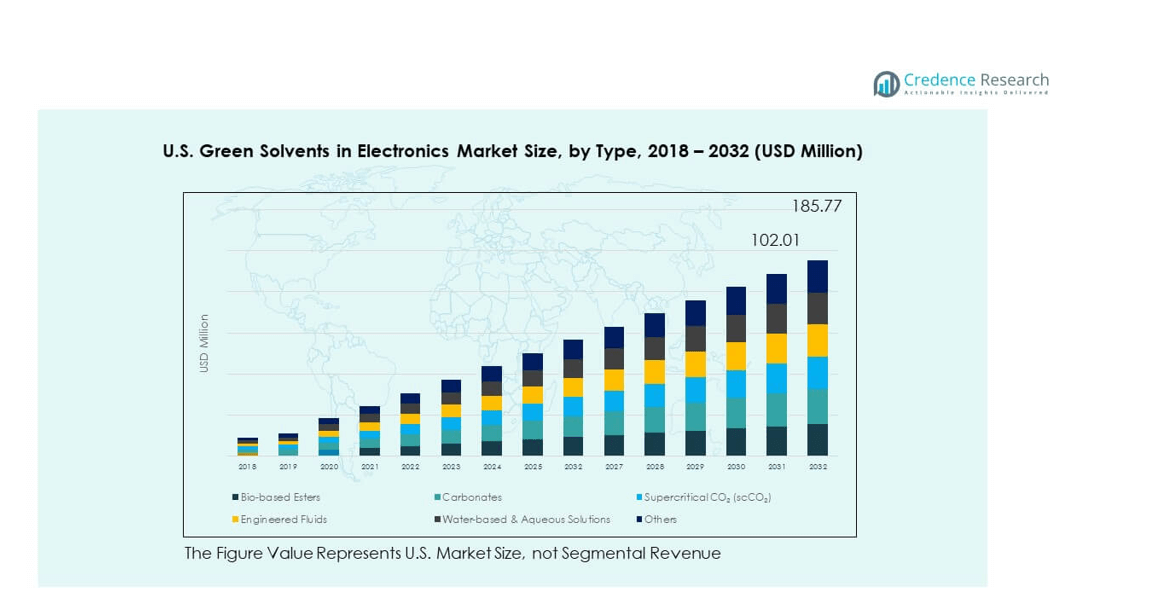
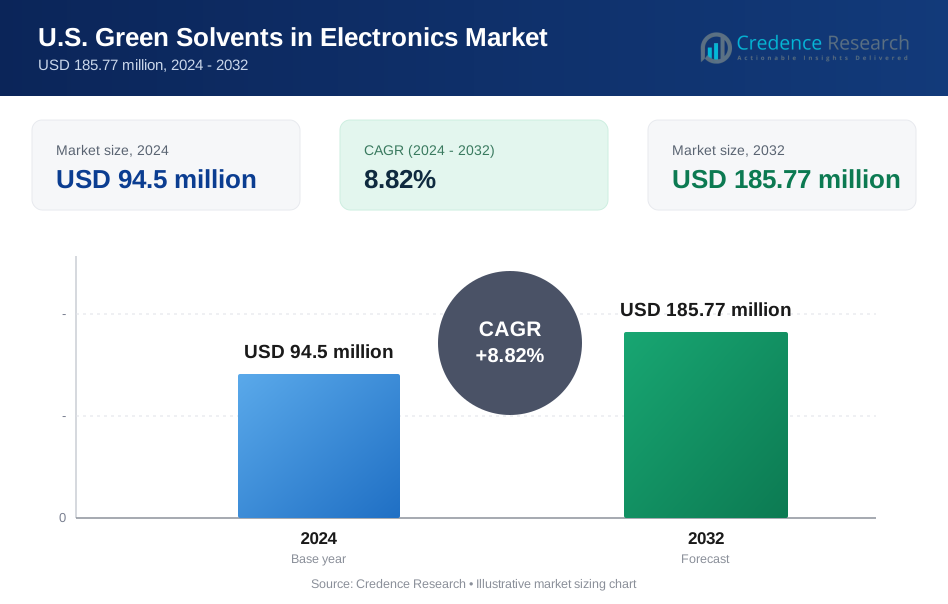
The U.S. Green Solvents in Electronics Market size was valued at USD 51.38 million in 2018, reached USD 94.5 million in 2024, and is anticipated to reach USD 185.77 million by 2032, at a CAGR of 8.82% during the forecast period.
| REPORT ATTRIBUTE | DETAILS |
|---|---|
| Historical Period | 2020-2023 |
| Base Year | 2024 |
| Forecast Period | 2025-2032 |
| U.S. Green Solvents in Electronics Market Size 2024 | USD 94.5 million |
| U.S. Green Solvents in Electronics Market, CAGR | 8.82% |
| U.S. Green Solvents in Electronics Market Size 2032 | USD 185.77 million |
The market is being driven by multiple factors, including the growing adoption of eco-friendly solvents in semiconductor cleaning, PCB assembly, and precision applications. Rising regulatory pressure to reduce volatile organic compounds (VOCs) and the push for safer workplace environments strengthen the demand outlook. Consumer electronics manufacturers are actively shifting toward greener materials, and research advancements in bio-based solvents further support adoption across applications.
Geographically, North America holds a strong position due to its robust electronics and semiconductor base, with the U.S. leading demand. Europe demonstrates notable growth through regulatory alignment, while Asia Pacific is emerging as the fastest-growing region supported by large-scale manufacturing and supply chain expansion. Latin America, the Middle East, and Africa are in early adoption phases but present opportunities through industrial diversification and gradual electronics manufacturing growth.
Market Insights:
- The U.S. Green Solvents in Electronics Market was USD 51.38 million in 2018, reached USD 94.5 million in 2024, and is expected to hit USD 185.77 million by 2032, growing at a CAGR of 8.82%.
- Northeast held 38% share in 2024, driven by semiconductor R&D hubs; Midwest followed with 27% due to strong PCB and assembly bases; West and South combined reached 25%, supported by foundries, displays, and EV-related electronics.
- Asia Pacific with 21% share is the fastest-growing region, propelled by large-scale electronics manufacturing, battery production, and export-driven demand.
- From the type segmentation, bio-based esters accounted for around 34% of market share in 2024, dominating due to strong adoption in semiconductor and display applications.
- Carbonates held nearly 22% share, mainly supported by their use in battery assembly and precision cleaning operations across U.S. electronics manufacturing.
Market Drivers:
Environmental Regulations Encouraging Green Solvent Adoption:
Stringent environmental regulations are one of the strongest drivers for the U.S. Green Solvents in Electronics Market. Agencies such as the EPA enforce strict controls on toxic solvents, pushing manufacturers to adopt eco-friendly alternatives. Compliance requirements shape procurement decisions, ensuring sustainability becomes a priority. Companies integrate bio-based and water-based solvents in semiconductor and PCB processes to meet regulatory standards. This transition lowers VOC emissions and improves environmental safety records. Green solvents also align with corporate sustainability goals, supporting public commitments. It is clear that policy-driven momentum will continue strengthening market adoption.
- For instance, California’s Air Resources Board (CARB) enforces stringent VOC emission limits that have compelled electronics manufacturers to switch to low-emission bio-based solvents certified under the EPA’s Safer Choice Program, resulting in measurable reductions of hazardous air pollutants in manufacturing facilities.
Semiconductor Industry Expanding Demand for Precision Solvents:
The semiconductor sector relies on high-purity solvents for wafer cleaning and fabrication. Green solvents provide effective alternatives while reducing environmental and health risks. Growing demand for advanced chips drives consistent adoption of sustainable cleaning solutions. Foundries prioritize greener inputs to maintain competitiveness and meet global supply chain standards. Expansion in 5G, IoT, and AI devices intensifies solvent usage in fabrication lines. Green solvent producers benefit by tailoring solutions for these complex processes. It is evident that semiconductor growth creates strong opportunities for green solvent adoption.
- For instance, leading semiconductor fabrication plants employ eco-friendly solvent chemistries such as supercritical CO₂ cleaning and water-based solvents for sub-5nm node wafer cleaning, achieving particle removal efficiency improvements of up to 30% while reducing chemical waste. Foundries prioritize greener inputs to maintain competitiveness and meet global supply chain standards.
Focus on Safer Workplace and Employee Health Protection:
Workplace safety drives demand for safer chemical alternatives in electronics manufacturing. Traditional solvents pose risks of toxic exposure, respiratory issues, and fire hazards. Green solvents reduce these risks while maintaining industrial cleaning efficiency. Employers adopt them to comply with occupational health standards and avoid liability costs. Worker-friendly formulations improve productivity and reduce downtime linked to health concerns. Safety certifications further reinforce the need for sustainable materials. It is clear that occupational health priorities are reshaping procurement policies across the sector.
Consumer Demand for Sustainable Electronics Products:
Consumers increasingly value electronics produced through sustainable processes. Brands use green solvents in manufacturing to showcase eco-friendly practices and win customer trust. Buyers prefer devices with certifications demonstrating safe production methods. This trend is reinforced by rising awareness of climate change and ecological impacts. Electronics OEMs promote sustainability in marketing to strengthen brand loyalty. Green solvent adoption directly supports these consumer-driven expectations. It is evident that consumer influence has become a critical force shaping the market’s direction.
Market Trends:
Growth of Bio-Based Solvents in Electronics Manufacturing:
The U.S. Green Solvents in Electronics Market shows a clear trend toward bio-based solutions. Derived from renewable feedstocks, these solvents reduce reliance on petrochemicals. Companies invest heavily in R&D to create high-performance alternatives matching traditional solvents. Bio-based solvents support semiconductor cleaning, display fabrication, and PCB assembly. Renewable sourcing reduces price volatility linked to fossil fuels. Firms highlight bio-based inputs as part of corporate sustainability strategies. It is evident that renewable innovation drives long-term competitiveness in the market.
- For instance, Gevo Inc. produces bio-based solvents from corn and sugarcane with a vertically integrated model controlling the full production process. BASF also advances bio-ethanol and bio-propylene glycol solvents, integrating renewable inputs to support semiconductor cleaning and PCB assembly.
Expansion of Solvent Recycling and Recovery Systems:
Electronics companies increasingly implement solvent recovery technologies in production processes. Recycling systems extend solvent lifecycles, reducing both waste and operating costs. Closed-loop solutions align with zero-waste goals and sustainability pledges. Green solvents complement these systems due to safer handling and easier recovery. Manufacturers integrate recycling directly into facilities to optimize efficiency. This approach supports regulatory compliance while enhancing cost savings. It is evident that solvent recycling adoption is becoming a strategic trend across the market.
- For instance, Solvent Waste Management Inc. supplies solvent distillation equipment that enables manufacturers to reclaim and repeatedly reuse solvents like isopropanol with recovery efficiency rates exceeding 90%, significantly lowering both disposal costs and solvent procurement spend. Closed-loop solutions align with zero-waste goals and sustainability pledges.
Development of Specialty Solvents for Niche Applications:
Specialty formulations tailored to advanced electronics processes are gaining traction. Precision cleaning of microelectronics and displays requires unique solvent blends. Green solvents are engineered for compatibility with sensitive substrates and coatings. Customized solutions meet the specific needs of semiconductors, batteries, and energy storage. Electronics OEMs collaborate with chemical firms to design application-focused products. These partnerships accelerate innovation and certification timelines. It is evident that specialized green solvent development strengthens adoption across diverse applications.
Collaborations Between Chemical and Electronics Companies:
Partnerships between chemical producers and electronics firms are increasing. Joint projects focus on creating new solvent technologies that align with environmental regulations. Collaboration accelerates product testing, validation, and commercialization. Electronics companies secure tailored solutions, while chemical firms expand customer reach. These alliances help reduce R&D costs and risks for both parties. Shared sustainability goals reinforce the value of such partnerships. It is evident that collaboration is shaping the innovation ecosystem for green solvents.
Market Challenges Analysis:
High Cost of Development and Production Limiting Adoption:
The U.S. Green Solvents in Electronics Market faces cost-related challenges in scaling adoption. Developing bio-based and engineered fluids requires extensive investment in R&D. Production costs remain higher compared to traditional petrochemical solvents. Smaller electronics firms struggle to absorb these additional expenses. Price-sensitive markets hesitate to fully adopt green alternatives despite regulatory pressure. Producers are under pressure to deliver cost-effective solutions without sacrificing performance. Scaling production is expected to reduce costs, but timelines remain uncertain. It is clear that cost barriers hinder rapid expansion of green solvents.
Performance Gaps in High-Precision Applications Slowing Acceptance:
Performance limitations in certain applications present another challenge. Some green solvents underperform in extreme temperature or precision electronics processes. Manufacturers hesitate to risk production stability by switching to new formulations. Inconsistent performance outcomes limit broader adoption across advanced semiconductor lines. Chemical firms must refine formulations through continuous testing and partnerships with OEMs. Certification delays also affect the pace of integration into manufacturing. Bridging these performance gaps is crucial to secure long-term adoption. It is evident that technical refinement will determine broader market acceptance.
Market Opportunities:
Rising Demand from Next-Generation Electronics Applications:
The U.S. Green Solvents in Electronics Market holds strong opportunities in emerging technologies. Growth in EV batteries, IoT sensors, and smart devices drives new demand. Green solvents play a role in assembly, coating, and precision cleaning. Manufacturers that align solutions with next-gen electronics secure competitive advantages. Specialty blends tailored for batteries and displays create new revenue pathways. Adoption in energy storage and sustainable electronics expands the overall market footprint. It is evident that innovation targeted at emerging applications strengthens growth potential.
Export Potential and Expansion into Global Markets:
American producers can expand globally by exporting advanced green solvent technologies. Many countries tighten restrictions on hazardous chemicals, creating strong international demand. U.S. firms benefit from advanced R&D and established electronics ecosystems. Strategic partnerships allow expansion into Asia, Europe, and Latin America. Export growth strengthens profitability while diversifying revenue sources. Global adoption also enhances the influence of U.S. producers in shaping industry standards. It is evident that international market expansion remains a key growth opportunity.
Market Segmentation Analysis:
Type
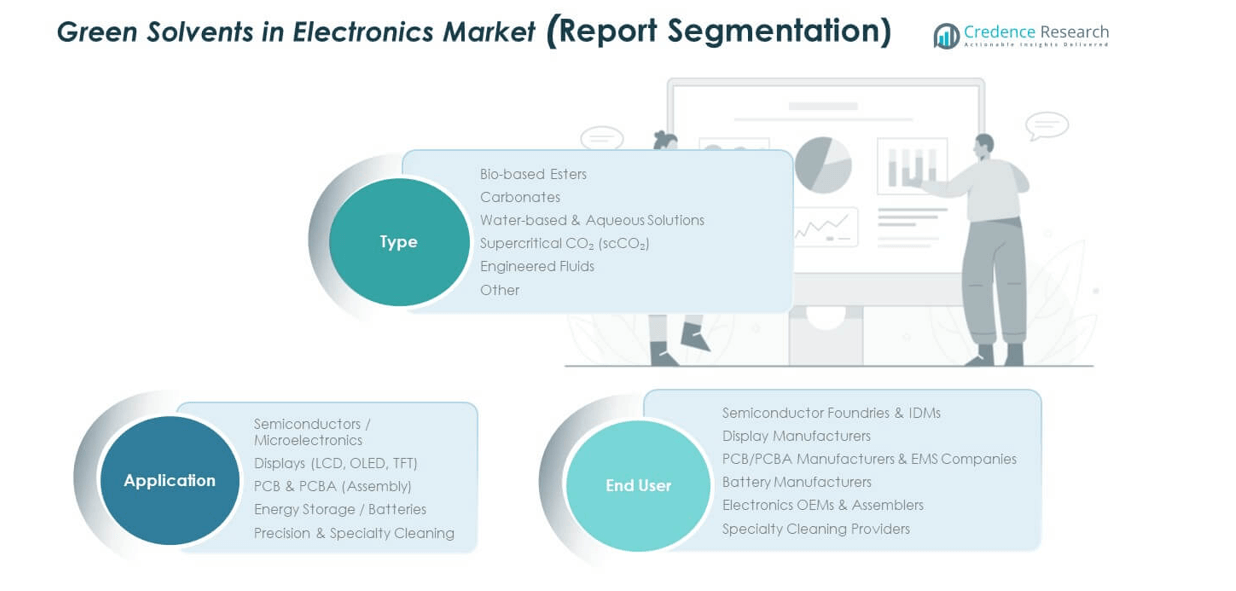
The U.S. Green Solvents in Electronics Market is segmented into bio-based esters, carbonates, water-based solutions, supercritical CO₂, engineered fluids, and others. Bio-based esters are increasingly adopted due to strong biodegradability and effectiveness in semiconductor applications. Carbonates support battery production, while water-based solutions dominate cleaning and PCB assembly processes.
- For instance, Dow Chemical announced plans to build a world-scale carbonate solvent production facility on the U.S. Gulf Coast with a capacity exceeding 100,000 metric tons per year to support lithium-ion battery electrolytes used in electric vehicles.
Application
Applications include semiconductors, displays, PCB assembly, energy storage, and specialty cleaning. Semiconductor and display applications generate significant demand due to precision requirements. Batteries and energy storage create new growth pathways as electrification expands.
- For instance, Surface Mount Solutions (SMS) provides inline aqueous PCB cleaning systems using water-based cleaning agents eliminating flux residues with precision while meeting stringent environmental and quality standards.
End-User
End users consist of semiconductor foundries, display manufacturers, PCB and EMS firms, battery producers, OEMs, and specialty cleaning providers. Strong demand comes from foundries and display makers who seek compliance with stricter regulations. Battery and OEM segments provide high-potential areas as green energy adoption accelerates.
Segmentation:
By Type
- Bio-based Esters
- Carbonates
- Water-based & Aqueous Solutions
- Supercritical CO₂ (scCO₂)
- Engineered Fluids
- Others
By Application
- Semiconductors / Microelectronics
- Displays (LCD, OLED, TFT)
- PCB & PCBA (Assembly)
- Energy Storage / Batteries
- Precision & Specialty Cleaning
By End User
- Semiconductor Foundries & IDMs
- Display Manufacturers
- PCB/PCBA Manufacturers & EMS Companies
- Battery Manufacturers
- Electronics OEMs & Assemblers
- Specialty Cleaning Providers
Regional Analysis:
Northeast Region Leading in Adoption
The Northeast holds the largest share of the U.S. Green Solvents in Electronics Market, accounting for nearly 38% in 2024. States like New York and Massachusetts drive demand due to their concentration of semiconductor and electronics R&D hubs. Strong university-industry collaborations promote innovation in bio-based solvents. The region benefits from strict state-level environmental regulations that encourage sustainable manufacturing. Electronics OEMs adopt green solvents to meet compliance and enhance supply chain transparency. It is expected that the Northeast will maintain leadership through its advanced research infrastructure and regulatory alignment.
Midwest Strengthening Through Manufacturing Base
The Midwest captured about 27% share in 2024, supported by its strong electronics manufacturing clusters in states like Illinois, Michigan, and Ohio. Regional industries rely on sustainable solvents in PCB assembly and specialty cleaning applications. Local policies and industrial initiatives encourage adoption of greener inputs in high-volume production. Companies in the Midwest also invest in recycling systems to lower costs and improve sustainability. Its large manufacturing workforce supports integration of green solvents into existing processes. It is positioned as a key contributor with steady adoption across industrial hubs.
West and South Driving Growth Momentum
The West and South regions together accounted for nearly 25% share in 2024, with California, Texas, and Arizona leading contributions. The West benefits from its semiconductor foundries, display manufacturing, and EV battery development projects. California’s stringent environmental policies accelerate early adoption of green solvents across electronics applications. The South supports growth through Texas-based electronics hubs and growing OEM activity in states like Georgia and North Carolina. Both regions show strong momentum in specialty cleaning and advanced microelectronics. It is projected that these regions will deliver the fastest growth within the U.S. through 2032.
Key Player Analysis:
- Corbion N.V.
- Musashino Chemical Laboratory
- Vertec BioSolvents Inc.
- Godavari Biorefineries Ltd.
- Galactic
- Yancheng Hongtai Bioengineering Co.
- UBE Corporation
- Shandong Shida Shenghua Chemical Group
- Lotte Chemical
- SABIC
- Huntsman Corporation
- Merck KGaA
- BASF SE
- Dow Inc.
- Other Key Players
Competitive Analysis:
The U.S. Green Solvents in Electronics Market is highly competitive, with multinational players dominating through advanced product portfolios. Companies like BASF, Dow, and Huntsman Corporation lead with strong R&D pipelines. Smaller firms such as Vertec BioSolvents and Musashino Chemical Laboratory focus on niche offerings and regional supply. Strategic partnerships between chemical producers and electronics OEMs foster innovation. Competitive differentiation often centers on performance, safety, and compliance advantages. It is a market where innovation speed and regulatory alignment determine long-term success.
Recent Developments:
- In August 2025, Corbion N.V. entered into a partnership with BRAIN Biotech AG to accelerate the development of novel biobased antimicrobial compounds and derivatives, enhancing its natural ingredient technologies for food preservation. This collaboration aims to speed up Corbion’s innovation in nature-based ingredients aligned with consumer demand for natural food products.
- Yancheng Hongtai Bioengineering Co. remains a key player in fermentation technology with significant market share in the 2,3-butanediol market, producing sustainable solvents derived from agricultural feedstocks. They are involved in strategic partnerships to develop new applications and expand production capacity, particularly targeting cosmetic and pharmaceutical-grade solvents.
- UBE Corporation completed the acquisition of Lanxess's polyurethane systems business in April 2025, marking a major expansion in specialty chemicals focused on high-performance polyurethane resins used in semiconductor applications, which could have relevance for electronics solvents as well.
- Galactic advanced its U.S. presence in July 2025 through a partnership with a Futures Commission Merchant (FCM) and registration with the National Futures Association (NFA) to enhance regulatory compliance for its platform, reinforcing its commitment to innovation in prediction markets.
- In July 2025, UBE Corporation signed an option license agreement with Ciconia Bioventures for the incubation of preclinical-stage compounds, focusing on developing new therapies with high unmet medical needs, showcasing UBE’s commitment to innovation in chemical and pharmaceutical sectors
Report Coverage:
The research report offers an in-depth analysis based on type, application, and end user. It details leading market players, providing an overview of their business, product offerings, investments, revenue streams, and key applications. Additionally, the report includes insights into the competitive environment, SWOT analysis, current market trends, as well as the primary drivers and constraints. Furthermore, it discusses various factors that have driven market expansion in recent years. The report also explores market dynamics, regulatory scenarios, and technological advancements that are shaping the industry. It assesses the impact of external factors and global economic changes on market growth. Lastly, it provides strategic recommendations for new entrants and established companies to navigate the complexities of the market.
Future Outlook:
- Rising semiconductor demand will strengthen adoption of bio-based solvents.
- Electronics OEMs will integrate stricter sustainability certifications.
- Battery production growth will create new solvent applications.
- Regulatory shifts will accelerate replacement of toxic solvents.
- Asia Pacific expansion will reshape global supply dynamics.
- Solvent recycling technologies will reduce operational costs.
- Partnerships between chemical and electronics firms will expand.
- Export opportunities for U.S. green solvents will increase.
- Specialty formulations will dominate precision cleaning markets.
- Consumer demand for eco-friendly electronics will reinforce adoption.
Request a Free Sample
Fill in your details and we'll send you a free sample report.
- Sample data tables & charts
- Research methodology
Need a Custom Version of This Report?
Tailor the scope, geography, or segments to your exact requirements.
- Custom geography or segment scope
- Direct access to our analyst team
Frequently Asked Questions
What is the current market size for U.S. Green Solvents in Electronics Market, and what is its projected size in 2032?
At what Compound Annual Growth Rate is the U.S. Green .Solvents in Electronics Market projected to grow between 2024 and 2032?
What are the primary factors fueling the growth of the U.S. Green Solvents in Electronics Market?
Who are the leading companies in the U.S. Green Solvents in Electronics Market?
Table of Content
Chapter 1. Report Introduction
- 1.1 Report Description & Purpose
- 1.1.1 Report Title & Market Definition
- 1.1.2 Unique Selling Propositions (USP) & Key Differentiators
- 1.1.3 Value Proposition for Stakeholders
- 1.2 Research Objectives
- 1.2.1 Market Sizing Objectives (Volume & Revenue)
- 1.2.2 Segmentation Objectives
- 1.2.3 Competitive Intelligence Objectives
- 1.2.4 Forecast & Scenario Objectives
- 1.3 Report Scope
- 1.3.1 U.S. Green Solvents in Electronics Scope – Types & Subtypes Covered
- 1.3.2 Geographic Scope – Regions & Countries Covered
- 1.3.3 Historical Period, Base Year & Forecast Period (2024; forecast to 2032)
- 1.3.4 Inclusions & Exclusions
- 1.4 HS Code & Classification Framework
- 1.5 Currency, Units & Pricing Basis
- 1.6 Target Stakeholders
- 1.7 Limitations & Assumptions
Chapter 2. Executive Summary
- 2.1 Global U.S. Green Solvents in Electronics Market Snapshot
- 2.1.1 Market Size – Historical (2024) & Forecast (2024-2032) (2024: USD 94.5 million → 2032: USD 185.77 million)
- 2.1.2 Volume & Revenue – Global Totals
- 2.1.3 Key Market Highlights – Top Five Facts
- 2.2 U.S. Green Solvents in Electronics Market Segmentation Snapshot
- 2.2.1 Market Split by Region – 2024 vs. 2032
- 2.3 Competitive Snapshot
- 2.3.1 Top 10 Players by Revenue Share – 2024
- 2.3.2 Top 10 Players by Volume Share – 2024
- 2.3.3 Recent Strategic Developments (18-Month Summary)
- 2.4 Key Investment Highlights & Strategic Conclusions
Chapter 3. U.S. Green Solvents in Electronics Market Dynamics & Industry Analysis
- 3.1 Market Overview & Context
- 3.1.1 U.S. Green Solvents in Electronics Market Position in the Broader Automotive Value Chain
- 3.1.2 OEM vs. Replacement Market Dynamics
- 3.1.3 Market Maturity & Development Stage by Region
- 3.2 U.S. Green Solvents in Electronics Market Drivers
- 3.3 U.S. Green Solvents in Electronics Market Restraints & Challenges
- 3.4 U.S. Green Solvents in Electronics Market Opportunities
- 3.5 Porter's Five Forces Analysis
- 3.5.1 Threat of New Entrants
- 3.5.2 Bargaining Power of Suppliers
- 3.5.3 Bargaining Power of Buyers
- 3.5.4 Threat of Substitutes
- 3.5.5 Competitive Rivalry – Intensity Assessment
- 3.6 U.S. Green Solvents in Electronics Value Chain Analysis
- 3.6.1 Upstream – Raw Material/Input Suppliers
- 3.6.1.1 Raw Material/Input 1
- 3.6.1.2 Raw Material/Input 2
- 3.6.1.3 Raw Material/Input 3
- 3.6.2 Midstream – Production/Manufacturing/Service Delivery
- 3.6.2.1 Production/Process Overview
- 3.6.2.2 Key Facility Locations & Capacity by Manufacturer
- 3.6.3 Downstream – Distribution & End Consumer
- 3.6.3.1 Primary Channel – B2B/OEM
- 3.6.3.2 Secondary Channels – Dealer, Retail, Online, Direct
- 3.6.4 Value Chain Profitability Analysis
- 3.6.1 Upstream – Raw Material/Input Suppliers
- 3.7 PESTEL Analysis
- 3.7.1 Political Factors
- 3.7.2 Economic Factors
- 3.7.3 Social Factors
- 3.7.4 Technological Factors
- 3.7.5 Environmental Factors
- 3.7.6 Legal Factors
- 3.8 U.S. Green Solvents in Electronics Supply Chain Analysis
- 3.8.1 Raw Material/Input Supply Risk Assessment
- 3.8.2 Manufacturing Concentration Risk (Geographic Exposure)
- 3.8.3 Trade Disruption Impact Analysis
- 3.9 Regulatory & Policy Landscape
Note: The regulatory and policy landscape section covers regulations based on their applicability to the market, U.S. Green Solvents in Electronics category, geography, and scope of the study. Only regulatory frameworks with a material impact on operations, compliance, trade, sustainability, or market access are analyzed in detail.
Chapter 4. Key Investment Pockets & Opportunity Analysis
- 4.1 U.S. Green Solvents in Electronics Market Attractiveness Analysis
- 4.1.1 By Region – Investment Attractiveness Matrix (Volume × CAGR)
- 4.2 Absolute Revenue Growth Opportunity
- 4.2.1 By Region – Absolute USD Growth Through 2032
- 4.3 Incremental Volume Opportunity
- 4.3.1 By Region – Incremental Volume Through 2032
- 4.3.2 Segment – Incremental Volume
- 4.4 Emerging Submarket Opportunity Deep Dive (Subject to Applicability)
- 4.5 Emerging Market Opportunity Scorecards
- 4.5.1 United States
- 4.5.2 Europe
- 4.5.3 Asia
- 4.5.4 Middle East & Africa
Note: Emerging Market Opportunity Scorecards will be included based on relevance and strategic importance. Regions listed are indicative and may vary depending on data availability and market dynamics.
Chapter 5. U.S. Green Solvents in Electronics Import-Export Analysis & Trade Flows
- 5.1 Global Trade Overview
- 5.1.1 Global Export Value by Country (2024)
- 5.1.2 Global Export Volume by Country (2024)
- 5.1.3 Global Import Value by Country (2024)
- 5.1.4 Global Import Volume by Country (2024)
- 5.1.5 Net Trade Balance by Country (2024)
- 5.2 Export Analysis – Segment
- 5.2.1 Type 1 (HS Code)
- 5.2.2 Type 2 (HS Code)
- 5.2.3 Type 3 (HS Code)
- 5.2.4 Type 4 (HS Code)
- 5.2.5 Type 5 (HS Code)
- 5.3 Import Analysis – Segment
- 5.3.1 Type 1 (HS Code)
- 5.3.2 Type 2 (HS Code)
- 5.3.3 Type 3 (HS Code)
- 5.3.4 Type 4 (HS Code)
- 5.3.5 Type 5 (HS Code)
- 5.4 Average Unit Trade Prices
- 5.4.1 Average Export Price – Segment & Country
- 5.4.2 Average Import Price – Segment & Source Country
- 5.4.3 Price Trends (2024)
- 5.5 Key Trade Route Analysis
- 5.5.1 Trade Route 1
- 5.5.2 Trade Route 2
- 5.5.3 Trade Route 3
- 5.5.4 Trade Route 4
- 5.5.5 Trade Route 5
- 5.6 Trade Policy Impact Assessment
- 5.6.1 US Anti-Dumping & Section 301 Tariffs
- 5.6.2 EU Customs Union Impact
- 5.6.3 Major Free Trade Agreements
- 5.6.4 USMCA Rules of Origin
Note: Trade policy analysis will be included only where relevant to the U.S. Green Solvents in Electronics market.
Chapter 6. Competitive Landscape & Company Benchmarking
- 6.1 U.S. Green Solvents in Electronics Market Concentration & Structure
- 6.1.1 Herfindahl-Hirschman Index (HHI) – vs. 2024
- 6.1.2 Tier 1, Tier 2 & Tier 3 Market Structure
- 6.1.3 Global, Regional & Local Player Dynamics
- 6.2 U.S. Green Solvents in Electronics Market Share Analysis – 2024
- 6.2.1 Global Revenue Share by Company
- 6.2.2 Global Volume Share by Company
- 6.2.3 Regional Revenue Share
- 6.2.4 Market Share Evolution ( vs. 2024)
- 6.2.5 OEM Segment Share by Company
- 6.2.6 Replacement Segment Share by Company
- 6.3 Production/Delivery Capacity & Facility Analysis
- 6.3.1 Global Installed Capacity
- 6.3.2 Capacity Utilization Rates
- 6.3.3 Production/Output Volume
- 6.3.4 Facility Locations & Capacity Map
- 6.3.5 Planned Capacity Additions
- 6.4 U.S. Green Solvents in Electronics Competitive Benchmarking Matrix
- 6.4.1 Revenue, Volume, CAGR & Profitability Comparison
- 6.4.2 Channel Revenue Mix
- 6.4.3 Geographic Revenue Exposure
- 6.4.4 R&D Intensity
- 6.4.5 Sustainability Maturity
- 6.5 Strategic Developments in U.S. Green Solvents in Electronics (Last 24 Months)
- 6.5.1 Mergers, Acquisitions & Divestments
- 6.5.2 New U.S. Green Solvents in Electronics Launches
- 6.5.3 Facility Expansions
- 6.5.4 Strategic Alliances, Joint Ventures & Partnerships
- 6.5.5 Distribution Expansion & Market Entry
- 6.5.6 Sustainability & ESG Initiatives
- 6.6 Competitive Strategy Mapping
- 6.6.1 Leader, Challenger, Follower & Niche Classification
- 6.6.2 Pricing Strategy Comparison
- 6.6.3 Channel Strategy Matrix
Note: Strategic developments are included based on their materiality and the availability of reliable information.
Chapter 7. Global U.S. Green Solvents in Electronics Market – By Distribution Channel
- 7.1 Segment Overview
- 7.1.1 Volume & Revenue Split by Channel (2024 & 2032)
- 7.1.2 Channel Mix Evolution (2024-2032)
Chapter 8. Regional Market Analysis – Global Overview
- 8.1 Global Regional Overview
- 8.1.1 Regional Volume Share
- 8.1.2 Regional Revenue Share
- 8.1.3 Regional Volume by Region
- 8.1.4 Regional Revenue by Region
- 8.1.5 Regional Forecast Through 2032
- 8.2 Cross-Regional Segment Analysis
- 8.2.1 By Distribution Channel
- 8.2.2 By Brand/Price Tier
Chapter 9. North America U.S. Green Solvents in Electronics Market
- 9.1 United States
- 9.2 Canada
- 9.3 Mexico
Chapter 10. Europe U.S. Green Solvents in Electronics Market
- 10.1 Germany
- 10.2 France
- 10.3 Italy
- 10.4 United Kingdom
- 10.5 Spain
- 10.6 Poland
- 10.7 Russia
- 10.8 Netherlands
- 10.9 Belgium
- 10.10 Sweden
- 10.11 Denmark
- 10.12 Norway
- 10.13 Rest of Europe
Chapter 11. Asia Pacific U.S. Green Solvents in Electronics Market
- 11.1 China
- 11.2 India
- 11.3 Japan
- 11.4 South Korea
- 11.5 Thailand
- 11.6 Indonesia
- 11.7 Vietnam
- 11.8 Malaysia
- 11.9 Australia
- 11.10 Rest of Asia Pacific
Chapter 12. Latin America U.S. Green Solvents in Electronics Market
- 12.1 Brazil
- 12.2 Argentina
- 12.3 Colombia
- 12.4 Chile
- 12.5 Rest of Latin America
Chapter 13. Middle East U.S. Green Solvents in Electronics Market
- 13.1 Saudi Arabia
- 13.2 United Arab Emirates
- 13.3 Turkey
- 13.4 Israel
- 13.5 Iran
- 13.6 Rest of the Middle East
Chapter 14. Africa U.S. Green Solvents in Electronics Market
- 14.1 South Africa
- 14.2 Egypt
- 14.3 Nigeria
- 14.4 Morocco
- 14.5 Rest of Africa
Chapter 15. U.S. Green Solvents in Electronics Company Profiles
- 15.1 [Company 01]
- 15.1.1 Company Overview
- 15.1.2 Key Management Personnel
- 15.1.3 Products & Services Portfolio
- 15.1.4 Financial Performance
- 15.1.5 Key Market Focus & Geographic Presence
- 15.1.6 Recent Developments & Strategic Initiatives
Note: The company profile list is preliminary and may change based on research findings, market developments, data availability, and client requirements.
Chapter 16. Appendices
- Appendix A – List of Abbreviations & Acronyms
- Appendix B – Industry Classification Code Reference – Full Series
- Appendix C – Production & Capacity Data Tables
- Appendix D – End-Use & Demand Base Tables
- Appendix E – Consumption & Replacement Rate Assumptions
- Appendix F – ASP Reference Tables
- Appendix G – Manufacturing & Facility Database
- Appendix H – Import-Export Data Tables
- Appendix I – Regulatory Summary Tables
- Appendix J – Primary Research Participant List (Anonymized)
- Appendix K – Primary Research Questionnaire Framework
- Appendix L – Data Sources & Bibliography
- Appendix M – Market Size Divergence & Source Comparison
Chapter 17. Research Methodology
- 17.1 Research Framework & Philosophy
- 17.2 Secondary Research – Sources, Hierarchy & Data Extraction
- 17.3 Data Modeling – Bottom-Up & Top-Down Market Sizing
- 17.4 Primary Research – Stakeholder Framework, LOI & Sample Sizes
- 17.5 Forecast Methodology – Regression, Scenario & Sensitivity Analysis
- 17.6 Quality Control – Four-Layer Validation Framework
- 17.7 Limitations & Standard Assumptions
- 17.8 Disclaimer
