
Market Overview
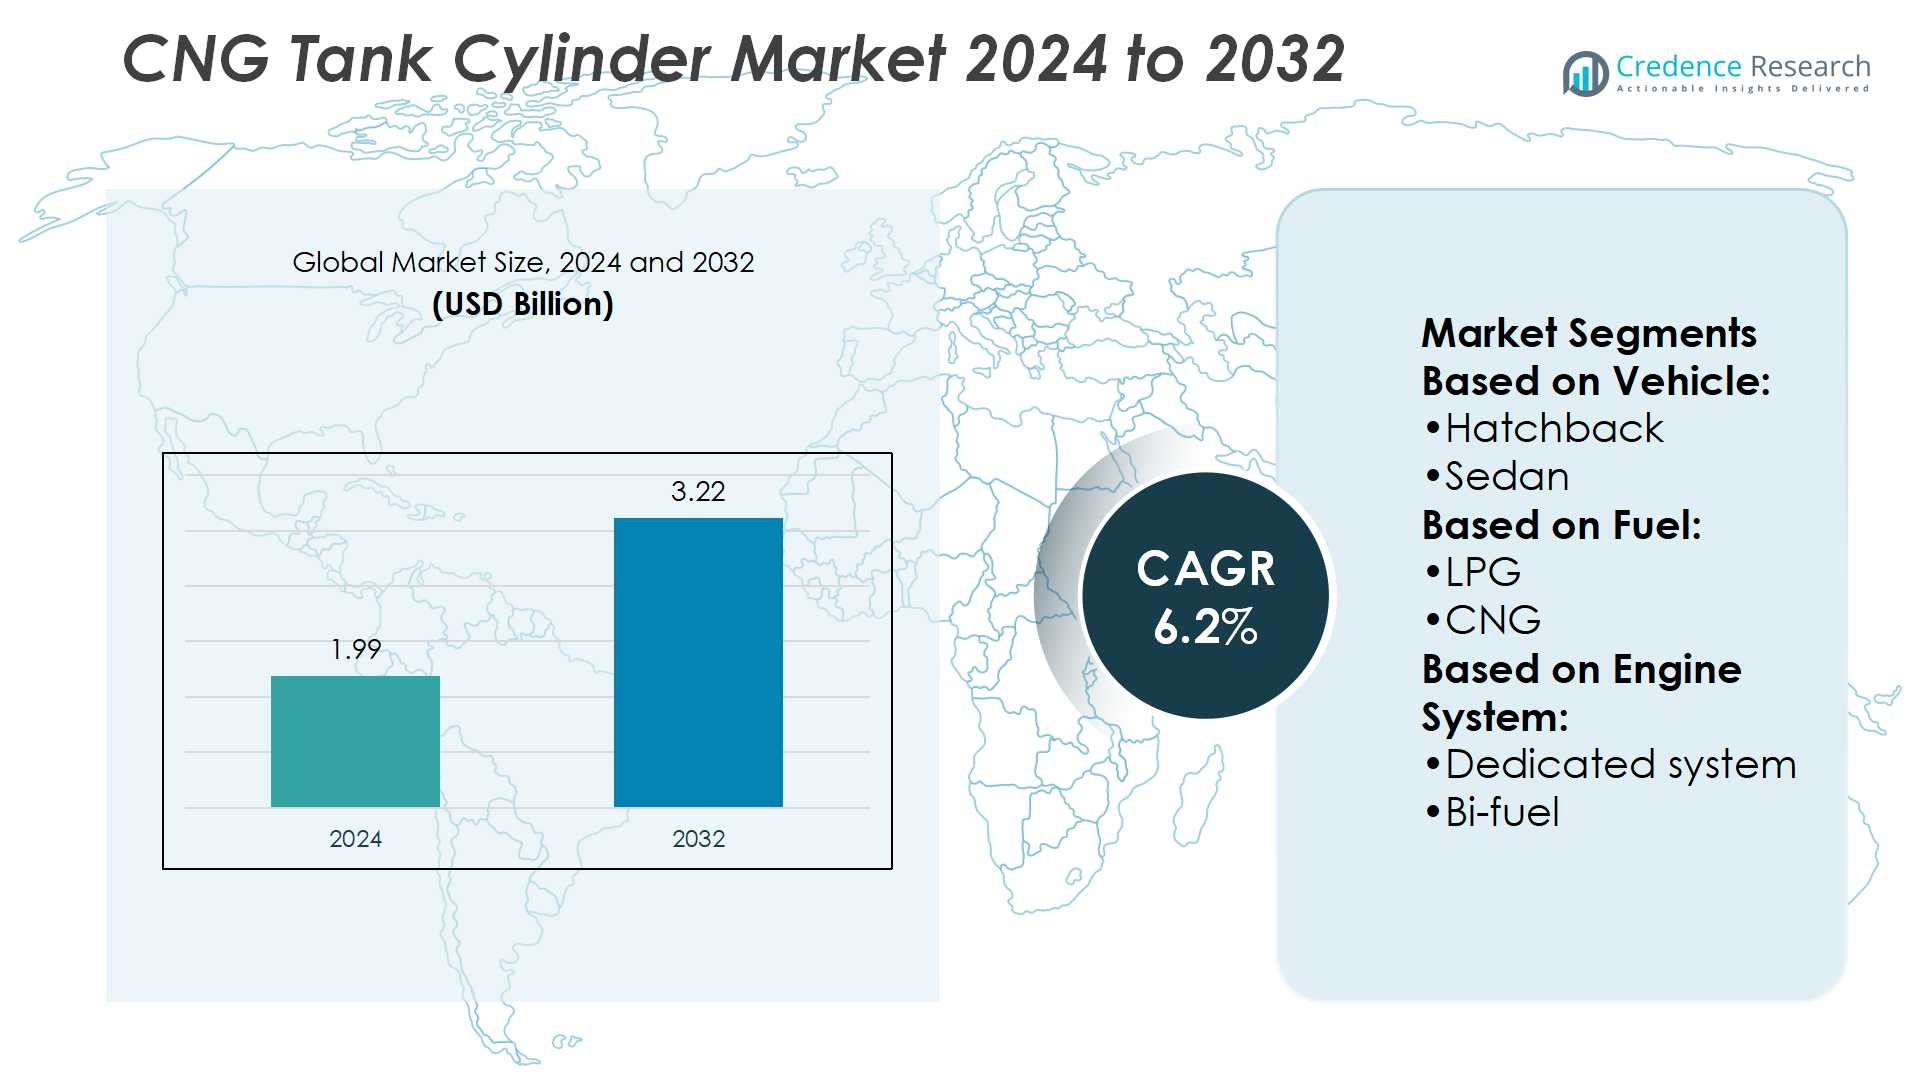
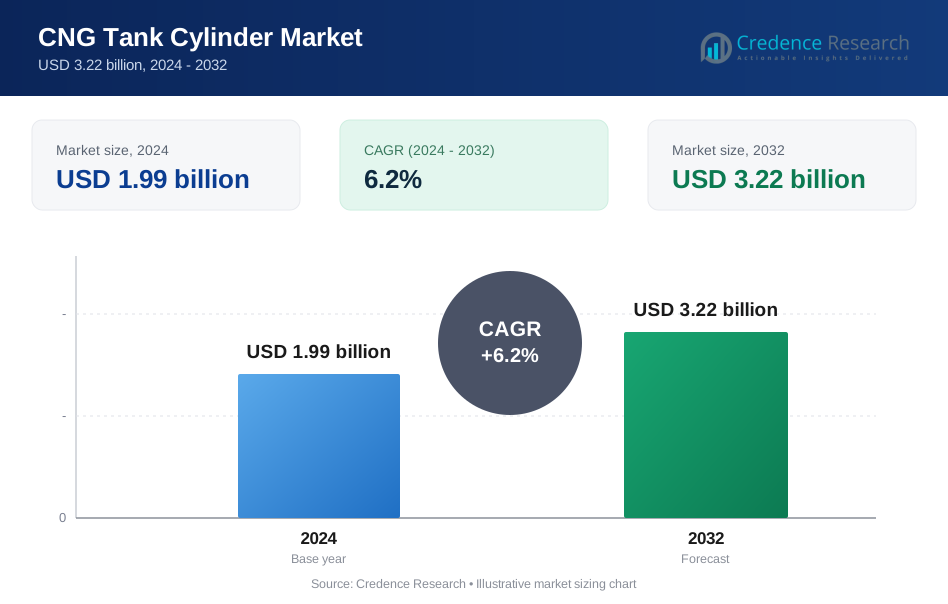
CNG Tank Cylinder Market size was valued USD 1.99 billion in 2024 and is anticipated to reach USD 3.22 billion by 2032, at a CAGR of 6.2% during the forecast period.
| REPORT ATTRIBUTE | DETAILS |
|---|---|
| Historical Period | 2020-2023 |
| Base Year | 2024 |
| Forecast Period | 2025-2032 |
| CNG Tank Cylinder Market Size 2024 | USD 1.99 Billion |
| CNG Tank Cylinder Market, CAGR | 6.2% |
| CNG Tank Cylinder Market Size 2032 | USD 3.22 Billion |
The CNG tank cylinder market is shaped by the presence of major players such as Honda, Volkswagen Group, Tata Motors, Ford Motor Company, Hyundai Motor Company, MAN SE, Toyota, IVECO, Mahindra & Mahindra, and General Motors. These companies focus on factory-fitted CNG vehicle offerings, lightweight composite cylinder innovations, and strategic partnerships with OEMs to strengthen market presence. Asia Pacific leads the global market, commanding a 38% share in 2024, supported by strong adoption in India, China, and Pakistan. Expanding infrastructure, government incentives, and rising fuel price sensitivity further reinforce the region’s dominance in both passenger and commercial vehicle segments.
Market Insights
- The CNG Tank Cylinder Market size reached USD 1.99 billion in 2024 and is projected to attain USD 3.22 billion by 2032, growing at a CAGR of 6.2%.
- Rising demand for cleaner fuels, government incentives, and the shift toward low-emission vehicles act as key drivers, boosting adoption in both passenger and commercial vehicle segments.
- A strong trend is the growing use of lightweight composite cylinders that enhance fuel efficiency, extend range, and meet global safety standards, driving innovation among top manufacturers.
- Competitive dynamics are shaped by leading players focusing on OEM-fitted CNG systems and strategic collaborations, though high upfront conversion costs and limited infrastructure in some regions restrain broader adoption.
- Asia Pacific dominates the global market with 38% share in 2024, driven by adoption in India, China, and Pakistan, while passenger vehicles hold the largest segment share supported by affordability, expanding infrastructure, and rising fuel price sensitivity.
Market Segmentation Analysis:
By Vehicle
In the CNG tank cylinder market, passenger vehicles hold the dominant share, driven by rising adoption of CNG-fueled hatchbacks and sedans in urban areas. Among these, hatchbacks lead due to their affordability, compact design, and strong demand in emerging economies where CNG infrastructure is expanding. SUVs are also witnessing increasing uptake as manufacturers integrate larger storage capacities to extend range. On the commercial side, light commercial vehicles (LCVs) show significant growth, particularly in logistics and last-mile delivery, supported by fleet operators prioritizing low operating costs and regulatory incentives for cleaner fuel adoption.
- For instance, Reputable automotive websites like CarDekho and CarWale, which track vehicle specifications and ARAI figures, list the mileage for the 2012 Honda City (V MT CNG Compatible) as 16.8 km/kg.
By Fuel
CNG accounts for the largest share in the market, supported by its wide acceptance as a cost-effective and environmentally friendly alternative to petrol and diesel. Governments worldwide promote CNG adoption with subsidies, stricter emission regulations, and investments in refueling stations, boosting its dominance. LPG holds a smaller share but remains relevant in certain regions due to existing infrastructure and lower conversion costs. However, CNG continues to outpace LPG growth, particularly in high-density cities where fuel economy and reduced carbon emissions are key purchase drivers for both private users and fleet owners.
- For instance, Volkswagen developed the eco-up! model with a combined 72-liter CNG tank capacity and an additional 10-liter petrol reserve, enabling a total driving range of approximately 600 km. The car achieved remarkably low CO₂ emissions of 79 g/km.
By Engine System
Dedicated systems dominate the engine system segment, capturing a strong share as they are purpose-built for CNG usage, delivering better efficiency, durability, and compliance with emission norms. Bi-fuel and dual-fuel systems, while offering flexibility, face challenges from performance trade-offs and rising consumer preference for fully integrated CNG designs. In fittings, OEM installations lead the market, supported by automakers increasingly offering factory-fitted CNG options to meet growing consumer demand and regulatory pressure. The aftermarket segment remains active, particularly in developing markets, but OEM systems maintain dominance due to higher reliability, safety standards, and warranty assurance.
Key Growth Drivers
Rising Demand for Cleaner Fuels
The increasing focus on reducing greenhouse gas emissions is driving demand for CNG tank cylinders. Governments are implementing stricter emission regulations and encouraging the use of natural gas as a cleaner alternative to petrol and diesel. This push is supported by rising consumer preference for sustainable mobility solutions. Fleet operators in logistics and public transport also adopt CNG due to lower operating costs and environmental benefits. These factors collectively strengthen the market growth trajectory, particularly in urban regions with high vehicle density.
- For instance, Tata Motors launched the Tigor iCNG sedan equipped with dual CNG cylinders totaling 70 liters water equivalent (LWE), delivering a certified mileage of 26.49 km/kg for the manual transmission variant and an even higher 28.06 km/kg for the automatic (AMT) variant.
Government Incentives and Infrastructure Expansion
Subsidies, tax benefits, and incentives from governments are accelerating CNG adoption across passenger and commercial vehicles. Expansion of refueling infrastructure, especially in emerging markets, ensures convenience and accessibility for end users. Strategic partnerships between governments and private entities have improved availability of CNG stations. Such policy-driven initiatives significantly boost confidence among manufacturers and consumers, increasing penetration of CNG-powered vehicles. The enhanced infrastructure base directly drives higher demand for CNG tank cylinders across multiple vehicle categories.
- For instance, Hyundai launched the Grand i10 NIOS CNG variant in India with its "Hy-CNG duo" system, featuring dual cylinders with a combined 60-liter water equivalent (LWE) capacity. This system delivers an ARAI-certified mileage of 27.3 km/kg, positioning it as one of the most fuel-efficient CNG hatchbacks in its class.
Advancements in Tank Technology
Technological improvements in CNG tank design and materials have enhanced safety, performance, and storage efficiency. Lightweight composite cylinders are gaining traction, offering higher fuel capacity with reduced vehicle weight. These advancements improve fuel economy, extend driving range, and comply with evolving safety standards. Manufacturers are investing in R&D to optimize tank durability and cost-effectiveness, strengthening their competitive edge. Such innovations are critical in meeting diverse consumer needs while aligning with environmental and regulatory requirements, making them a strong driver for market expansion.
Key Trends & Opportunities
Growing Adoption in Passenger Vehicles
The increasing shift of consumers toward hatchbacks, sedans, and SUVs with factory-fitted CNG options represents a strong trend. Automakers are expanding their CNG vehicle portfolios to capture the growing urban market, supported by rising fuel price sensitivity. This creates opportunities for OEM suppliers of CNG tank cylinders to scale production.
- For instance, Toyota introduced a bi-fuel (petrol/CNG) Hilux Vigo CNG in Thailand. This model was powered by a 2.7-liter VVT-i gasoline engine with a locally installed CNG system developed in collaboration with aftermarket suppliers.
Expansion in Commercial Fleets
Logistics companies and public transportation providers are turning to CNG-powered fleets to lower operational costs and comply with emission standards. This trend opens significant opportunities for large-capacity CNG tanks, especially in light and medium commercial vehicles. The fleet modernization drive further strengthens long-term demand.
- For instance, IVECO developed the Stralis NP 460 heavy-duty truck, which is available in various natural gas configurations. The truck can be equipped with CNG or LNG tanks, or a combination of both.
Innovation in Lightweight Materials
The shift toward composite and hybrid materials in tank production is reshaping the market. These materials enhance fuel efficiency and extend driving range while maintaining safety standards. Manufacturers focusing on cost-effective composite solutions stand to benefit from increasing adoption across both developed and developing economies.
Key Challenges
High Initial Conversion and Installation Costs
Despite long-term cost savings, the upfront investment for CNG systems and high-performance cylinders remains a barrier. Vehicle owners in cost-sensitive markets often delay adoption due to these expenses. The challenge is particularly evident in developing economies where disposable incomes are limited.
Limited Refueling Infrastructure in Some Regions
While infrastructure is improving in many markets, several regions still face a shortage of CNG stations. This lack of widespread availability hinders consumer confidence in adopting CNG vehicles. Without adequate infrastructure, the growth of CNG tank cylinder demand remains restricted, especially outside urban hubs.
Regional Analysis
North America
North America holds a significant share of the CNG tank cylinder market, accounting for 22% in 2024. The region benefits from strong adoption in commercial fleets; particularly light and medium commercial vehicles used in logistics and urban transport. Government incentives for cleaner fuels and emission reduction policies drive further growth. The U.S. leads the market due to its well-established CNG infrastructure, while Canada is gradually expanding adoption supported by environmental initiatives. Increasing investments in lightweight composite cylinders and advanced tank technologies strengthen the region’s position, ensuring steady growth through fleet modernization and public transportation programs.
Europe
Europe commands 18% of the global CNG tank cylinder market in 2024, driven by stringent emission regulations under the European Green Deal and strong demand for sustainable mobility solutions. Italy, Germany, and Spain remain leading markets due to early adoption of CNG vehicles. The region’s focus on decarbonization and the promotion of alternative fuels boosts OEM integration of factory-fitted CNG tanks. Rising demand in passenger vehicles, especially hatchbacks and sedans, further supports growth. Europe also shows strong potential for lightweight composite tank adoption, which aligns with its push toward efficiency, safety, and reduced carbon footprints in transport systems.
Asia Pacific
Asia Pacific dominates the global CNG tank cylinder market, holding 38% of the total share in 2024. The region’s leadership stems from high adoption in India, China, and Pakistan, where expanding infrastructure and rising fuel price sensitivity drive demand. Government initiatives promoting cleaner mobility, coupled with subsidies for CNG vehicles, accelerate growth. Passenger cars and three-wheelers dominate, while commercial vehicles are increasingly adopting CNG tanks for cost efficiency. Rapid urbanization and fleet modernization enhance market expansion. Asia Pacific also leads in manufacturing capacity, supporting cost-effective production and widespread availability of both OEM and aftermarket cylinders.
Latin America
Latin America represents 12% of the CNG tank cylinder market in 2024, with Argentina and Brazil being the largest contributors. The region’s growth is supported by favorable government policies and significant adoption of aftermarket conversions, particularly in passenger cars and taxis. Rising urban demand for low-cost transportation fuels further boosts the market. While infrastructure development lags compared to Asia, investments in refueling networks are expanding steadily. Latin America also witnesses increasing interest in composite CNG cylinders, driven by demand for lighter and safer alternatives, strengthening long-term adoption across both passenger and commercial vehicle segments.
Middle East & Africa
The Middle East & Africa (MEA) accounts for 10% of the global CNG tank cylinder market in 2024. Adoption is concentrated in countries such as Iran, Egypt, and South Africa, where governments actively promote natural gas vehicles to reduce reliance on oil-based fuels. Growing demand in passenger cars and light commercial vehicles supports regional growth. Infrastructure availability remains a key limitation, but ongoing investments in gas distribution and refueling stations are gradually improving market accessibility. The shift toward OEM-fitted CNG systems in urban centers, coupled with supportive energy diversification policies, enhances the market’s growth outlook in MEA.
Market Segmentations:
By Vehicle:
- Hatchback
- Sedan
By Fuel:
- LPG
- CNG
By Engine System:
- Dedicated system
- Bi-fuel
By Geography
- North America
- U.S.
- Canada
- Mexico
- Europe
- Germany
- France
- U.K.
- Italy
- Spain
- Rest of Europe
- Asia Pacific
- China
- Japan
- India
- South Korea
- South-east Asia
- Rest of Asia Pacific
- Latin America
- Brazil
- Argentina
- Rest of Latin America
- Middle East & Africa
- GCC Countries
- South Africa
- Rest of the Middle East and Africa
Competitive Landscape
The CNG tank cylinder market players such as Honda, Volkswagen Group, Tata Motors, Ford Motor Company, Hyundai Motor Company, MAN SE, Toyota, IVECO, Mahindra & Mahindra, and General Motors. The CNG tank cylinder market is characterized by intense competition, driven by technological innovation, regulatory compliance, and expanding OEM collaborations. Companies are focusing on developing lightweight composite cylinders to improve fuel efficiency, extend driving range, and ensure safety. Growing demand for factory-fitted CNG systems is pushing manufacturers to strengthen partnerships with automakers, while aftermarket suppliers remain active in cost-sensitive regions. Continuous investments in R&D enhance cylinder durability and performance, supporting long-term adoption. The market also witnesses capacity expansion and regional infrastructure development, ensuring steady supply and availability. Firms prioritizing sustainable designs and compliance with emission norms are positioned to secure a competitive edge.
Key Player Analysis
- Honda
- Volkswagen Group
- Tata Motors
- Ford Motor Company
- Hyundai Motor Company
- MAN SE
- Toyota
- IVECO
- Mahindra & Mahindra
- General Motors
Recent Developments
- In April 2025, Hyundai launched a new variant, which is a CNG-powered car that offers consumers with dual-cylinder option. The variant offers an optimal balance of affordability and efficiency.
- In April 2025, Tata Motors is preparing multiple new models, including the Harrier EV and the Sierra lifestyle SUV. The company will soon introduce the CNG version of the SUV Coupe, as testing of the Curvv CNG has already started.
- In February 2025, Nissan magnite, is aiming to diversify its product offerings in India, the company has plan to introduce hybrid and CNG powertrain technology in its car in India. Nissan is aiming to ramp up its sales in India in the next financial year.
- In November 2024, the Ogun State Government partnered with the Standards Organization of Nigeria (SON) to advance the adoption of Compressed Natural Gas (CNG)-powered vehicles. This collaboration aims to enhance safety protocols and streamline the conversion of Premium Motor Spirit (PMS) vehicles to CNG, promoting sustainable and eco-friendly transportation in the state.
- In April 2024, The Gazprom Management Committee acknowledged the updates on the gas supply and infrastructure expansion programs in Russian Federation regions in 2024. This program is scheduled for the period between 2021 and 2025 to cover 72 Russian regions.
Report Coverage
The research report offers an in-depth analysis based on Vehicle, Fuel, Engine System and Geography. It details leading market players, providing an overview of their business, product offerings, investments, revenue streams, and key applications. Additionally, the report includes insights into the competitive environment, SWOT analysis, current market trends, as well as the primary drivers and constraints. Furthermore, it discusses various factors that have driven market expansion in recent years. The report also explores market dynamics, regulatory scenarios, and technological advancements that are shaping the industry. It assesses the impact of external factors and global economic changes on market growth. Lastly, it provides strategic recommendations for new entrants and established companies to navigate the complexities of the market.
Future Outlook
- The market will witness rising demand from both passenger and commercial vehicle segments.
- Government incentives and stricter emission norms will continue to support CNG adoption.
- Expansion of CNG refueling infrastructure will enhance accessibility and boost cylinder demand.
- Lightweight composite cylinders will gain preference due to improved efficiency and safety.
- OEM-fitted CNG systems will dominate as automakers expand dedicated product lines.
- Aftermarket demand will persist in cost-sensitive regions with high conversion rates.
- Technological innovations will focus on durability, storage capacity, and cost optimization.
- Commercial fleets will increasingly adopt CNG for lower operational costs and compliance.
- Asia Pacific will remain the largest regional market, driven by rapid urbanization.
- Strategic collaborations and R&D investments will shape long-term market competitiveness.
Request a Free Sample
Fill in your details and we'll send you a free sample report.
- Sample data tables & charts
- Research methodology
Need a Custom Version of This Report?
Tailor the scope, geography, or segments to your exact requirements.
- Custom geography or segment scope
- Direct access to our analyst team
Frequently Asked Questions
What was the market size of the CNG Tank Cylinder Market in 2024, and what is the expected size by 2032?
What is the projected CAGR for the CNG Tank Cylinder Market during the forecast period 2025–2032?
Which fuel type segment held the largest share of the CNG Tank Cylinder Market in 2024?
What key factors are driving the adoption of CNG tank cylinders across passenger and commercial vehicles?
Which companies are recognized as the major players in the CNG Tank Cylinder Market?
Which region led the global CNG Tank Cylinder Market in 2024, and what was its market share?
Table of Content
Chapter 1. Report Introduction
- 1.1 Report Description & Purpose
- 1.1.1 Report Title & Market Definition
- 1.1.2 Unique Selling Propositions (USP) & Key Differentiators
- 1.1.3 Value Proposition for Stakeholders
- 1.2 Research Objectives
- 1.2.1 Market Sizing Objectives (Volume & Revenue)
- 1.2.2 Segmentation Objectives
- 1.2.3 Competitive Intelligence Objectives
- 1.2.4 Forecast & Scenario Objectives
- 1.3 Report Scope
- 1.3.1 CNG Tank Cylinder Scope – Types & Subtypes Covered
- 1.3.2 Geographic Scope – Regions & Countries Covered
- 1.3.3 Historical Period, Base Year & Forecast Period (2024; forecast to 2032)
- 1.3.4 Inclusions & Exclusions
- 1.4 HS Code & Classification Framework
- 1.5 Currency, Units & Pricing Basis
- 1.6 Target Stakeholders
- 1.7 Limitations & Assumptions
Chapter 2. Executive Summary
- 2.1 Global CNG Tank Cylinder Market Snapshot
- 2.1.1 Market Size – Historical (2024) & Forecast (2024-2032) (2024: USD 1.99 billion → 2032: USD 3.22 billion)
- 2.1.2 Volume & Revenue – Global Totals
- 2.1.3 Key Market Highlights – Top Five Facts
- 2.2 CNG Tank Cylinder Market Segmentation Snapshot
- 2.2.1 Market Split by Region – 2024 vs. 2032
- 2.3 Competitive Snapshot
- 2.3.1 Top 10 Players by Revenue Share – 2024
- 2.3.2 Top 10 Players by Volume Share – 2024
- 2.3.3 Recent Strategic Developments (18-Month Summary)
- 2.4 Key Investment Highlights & Strategic Conclusions
Chapter 3. CNG Tank Cylinder Market Dynamics & Industry Analysis
- 3.1 Market Overview & Context
- 3.1.1 CNG Tank Cylinder Market Position in the Broader Automotive Value Chain
- 3.1.2 OEM vs. Replacement Market Dynamics
- 3.1.3 Market Maturity & Development Stage by Region
- 3.2 CNG Tank Cylinder Market Drivers
- 3.3 CNG Tank Cylinder Market Restraints & Challenges
- 3.4 CNG Tank Cylinder Market Opportunities
- 3.5 Porter's Five Forces Analysis
- 3.5.1 Threat of New Entrants
- 3.5.2 Bargaining Power of Suppliers
- 3.5.3 Bargaining Power of Buyers
- 3.5.4 Threat of Substitutes
- 3.5.5 Competitive Rivalry – Intensity Assessment
- 3.6 CNG Tank Cylinder Value Chain Analysis
- 3.6.1 Upstream – Raw Material/Input Suppliers
- 3.6.1.1 Raw Material/Input 1
- 3.6.1.2 Raw Material/Input 2
- 3.6.1.3 Raw Material/Input 3
- 3.6.2 Midstream – Production/Manufacturing/Service Delivery
- 3.6.2.1 Production/Process Overview
- 3.6.2.2 Key Facility Locations & Capacity by Manufacturer
- 3.6.3 Downstream – Distribution & End Consumer
- 3.6.3.1 Primary Channel – B2B/OEM
- 3.6.3.2 Secondary Channels – Dealer, Retail, Online, Direct
- 3.6.4 Value Chain Profitability Analysis
- 3.6.1 Upstream – Raw Material/Input Suppliers
- 3.7 PESTEL Analysis
- 3.7.1 Political Factors
- 3.7.2 Economic Factors
- 3.7.3 Social Factors
- 3.7.4 Technological Factors
- 3.7.5 Environmental Factors
- 3.7.6 Legal Factors
- 3.8 CNG Tank Cylinder Supply Chain Analysis
- 3.8.1 Raw Material/Input Supply Risk Assessment
- 3.8.2 Manufacturing Concentration Risk (Geographic Exposure)
- 3.8.3 Trade Disruption Impact Analysis
- 3.9 Regulatory & Policy Landscape
Note: The regulatory and policy landscape section covers regulations based on their applicability to the market, CNG Tank Cylinder category, geography, and scope of the study. Only regulatory frameworks with a material impact on operations, compliance, trade, sustainability, or market access are analyzed in detail.
Chapter 4. Key Investment Pockets & Opportunity Analysis
- 4.1 CNG Tank Cylinder Market Attractiveness Analysis
- 4.1.1 By Region – Investment Attractiveness Matrix (Volume × CAGR)
- 4.2 Absolute Revenue Growth Opportunity
- 4.2.1 By Region – Absolute USD Growth Through 2032
- 4.3 Incremental Volume Opportunity
- 4.3.1 By Region – Incremental Volume Through 2032
- 4.3.2 Segment – Incremental Volume
- 4.4 Emerging Submarket Opportunity Deep Dive (Subject to Applicability)
- 4.5 Emerging Market Opportunity Scorecards
- 4.5.1 United States
- 4.5.2 Europe
- 4.5.3 Asia
- 4.5.4 Middle East & Africa
Note: Emerging Market Opportunity Scorecards will be included based on relevance and strategic importance. Regions listed are indicative and may vary depending on data availability and market dynamics.
Chapter 5. CNG Tank Cylinder Import-Export Analysis & Trade Flows
- 5.1 Global Trade Overview
- 5.1.1 Global Export Value by Country (2024)
- 5.1.2 Global Export Volume by Country (2024)
- 5.1.3 Global Import Value by Country (2024)
- 5.1.4 Global Import Volume by Country (2024)
- 5.1.5 Net Trade Balance by Country (2024)
- 5.2 Export Analysis – Segment
- 5.2.1 Type 1 (HS Code)
- 5.2.2 Type 2 (HS Code)
- 5.2.3 Type 3 (HS Code)
- 5.2.4 Type 4 (HS Code)
- 5.2.5 Type 5 (HS Code)
- 5.3 Import Analysis – Segment
- 5.3.1 Type 1 (HS Code)
- 5.3.2 Type 2 (HS Code)
- 5.3.3 Type 3 (HS Code)
- 5.3.4 Type 4 (HS Code)
- 5.3.5 Type 5 (HS Code)
- 5.4 Average Unit Trade Prices
- 5.4.1 Average Export Price – Segment & Country
- 5.4.2 Average Import Price – Segment & Source Country
- 5.4.3 Price Trends (2024)
- 5.5 Key Trade Route Analysis
- 5.5.1 Trade Route 1
- 5.5.2 Trade Route 2
- 5.5.3 Trade Route 3
- 5.5.4 Trade Route 4
- 5.5.5 Trade Route 5
- 5.6 Trade Policy Impact Assessment
- 5.6.1 US Anti-Dumping & Section 301 Tariffs
- 5.6.2 EU Customs Union Impact
- 5.6.3 Major Free Trade Agreements
- 5.6.4 USMCA Rules of Origin
Note: Trade policy analysis will be included only where relevant to the CNG Tank Cylinder market.
Chapter 6. Competitive Landscape & Company Benchmarking
- 6.1 CNG Tank Cylinder Market Concentration & Structure
- 6.1.1 Herfindahl-Hirschman Index (HHI) – vs. 2024
- 6.1.2 Tier 1, Tier 2 & Tier 3 Market Structure
- 6.1.3 Global, Regional & Local Player Dynamics
- 6.2 CNG Tank Cylinder Market Share Analysis – 2024
- 6.2.1 Global Revenue Share by Company
- 6.2.2 Global Volume Share by Company
- 6.2.3 Regional Revenue Share
- 6.2.4 Market Share Evolution ( vs. 2024)
- 6.2.5 OEM Segment Share by Company
- 6.2.6 Replacement Segment Share by Company
- 6.3 Production/Delivery Capacity & Facility Analysis
- 6.3.1 Global Installed Capacity
- 6.3.2 Capacity Utilization Rates
- 6.3.3 Production/Output Volume
- 6.3.4 Facility Locations & Capacity Map
- 6.3.5 Planned Capacity Additions
- 6.4 CNG Tank Cylinder Competitive Benchmarking Matrix
- 6.4.1 Revenue, Volume, CAGR & Profitability Comparison
- 6.4.2 Channel Revenue Mix
- 6.4.3 Geographic Revenue Exposure
- 6.4.4 R&D Intensity
- 6.4.5 Sustainability Maturity
- 6.5 Strategic Developments in CNG Tank Cylinder (Last 24 Months)
- 6.5.1 Mergers, Acquisitions & Divestments
- 6.5.2 New CNG Tank Cylinder Launches
- 6.5.3 Facility Expansions
- 6.5.4 Strategic Alliances, Joint Ventures & Partnerships
- 6.5.5 Distribution Expansion & Market Entry
- 6.5.6 Sustainability & ESG Initiatives
- 6.6 Competitive Strategy Mapping
- 6.6.1 Leader, Challenger, Follower & Niche Classification
- 6.6.2 Pricing Strategy Comparison
- 6.6.3 Channel Strategy Matrix
Note: Strategic developments are included based on their materiality and the availability of reliable information.
Chapter 7. Global CNG Tank Cylinder Market – By Distribution Channel
- 7.1 Segment Overview
- 7.1.1 Volume & Revenue Split by Channel (2024 & 2032)
- 7.1.2 Channel Mix Evolution (2024-2032)
Chapter 8. Regional Market Analysis – Global Overview
- 8.1 Global Regional Overview
- 8.1.1 Regional Volume Share
- 8.1.2 Regional Revenue Share
- 8.1.3 Regional Volume by Region
- 8.1.4 Regional Revenue by Region
- 8.1.5 Regional Forecast Through 2032
- 8.2 Cross-Regional Segment Analysis
- 8.2.1 By Distribution Channel
- 8.2.2 By Brand/Price Tier
Chapter 9. North America CNG Tank Cylinder Market
- 9.1 United States
- 9.2 Canada
- 9.3 Mexico
Chapter 10. Europe CNG Tank Cylinder Market
- 10.1 Germany
- 10.2 France
- 10.3 Italy
- 10.4 United Kingdom
- 10.5 Spain
- 10.6 Poland
- 10.7 Russia
- 10.8 Netherlands
- 10.9 Belgium
- 10.10 Sweden
- 10.11 Denmark
- 10.12 Norway
- 10.13 Rest of Europe
Chapter 11. Asia Pacific CNG Tank Cylinder Market
- 11.1 China
- 11.2 India
- 11.3 Japan
- 11.4 South Korea
- 11.5 Thailand
- 11.6 Indonesia
- 11.7 Vietnam
- 11.8 Malaysia
- 11.9 Australia
- 11.10 Rest of Asia Pacific
Chapter 12. Latin America CNG Tank Cylinder Market
- 12.1 Brazil
- 12.2 Argentina
- 12.3 Colombia
- 12.4 Chile
- 12.5 Rest of Latin America
Chapter 13. Middle East CNG Tank Cylinder Market
- 13.1 Saudi Arabia
- 13.2 United Arab Emirates
- 13.3 Turkey
- 13.4 Israel
- 13.5 Iran
- 13.6 Rest of the Middle East
Chapter 14. Africa CNG Tank Cylinder Market
- 14.1 South Africa
- 14.2 Egypt
- 14.3 Nigeria
- 14.4 Morocco
- 14.5 Rest of Africa
Chapter 15. CNG Tank Cylinder Company Profiles
- 15.1 [Company 01]
- 15.1.1 Company Overview
- 15.1.2 Key Management Personnel
- 15.1.3 Products & Services Portfolio
- 15.1.4 Financial Performance
- 15.1.5 Key Market Focus & Geographic Presence
- 15.1.6 Recent Developments & Strategic Initiatives
Note: The company profile list is preliminary and may change based on research findings, market developments, data availability, and client requirements.
Chapter 16. Appendices
- Appendix A – List of Abbreviations & Acronyms
- Appendix B – Industry Classification Code Reference – Full Series
- Appendix C – Production & Capacity Data Tables
- Appendix D – End-Use & Demand Base Tables
- Appendix E – Consumption & Replacement Rate Assumptions
- Appendix F – ASP Reference Tables
- Appendix G – Manufacturing & Facility Database
- Appendix H – Import-Export Data Tables
- Appendix I – Regulatory Summary Tables
- Appendix J – Primary Research Participant List (Anonymized)
- Appendix K – Primary Research Questionnaire Framework
- Appendix L – Data Sources & Bibliography
- Appendix M – Market Size Divergence & Source Comparison
Chapter 17. Research Methodology
- 17.1 Research Framework & Philosophy
- 17.2 Secondary Research – Sources, Hierarchy & Data Extraction
- 17.3 Data Modeling – Bottom-Up & Top-Down Market Sizing
- 17.4 Primary Research – Stakeholder Framework, LOI & Sample Sizes
- 17.5 Forecast Methodology – Regression, Scenario & Sensitivity Analysis
- 17.6 Quality Control – Four-Layer Validation Framework
- 17.7 Limitations & Standard Assumptions
- 17.8 Disclaimer
