Market Overview:
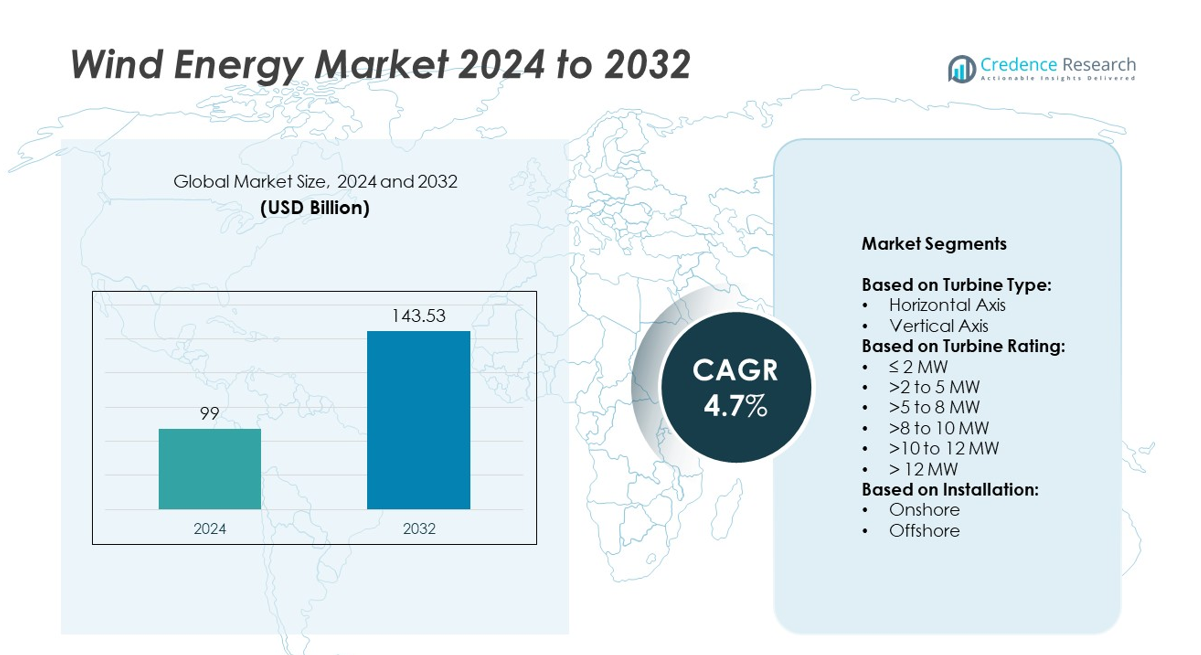
Wind Energy market size was valued USD 99 billion in 2024 and is anticipated to reach USD 143.53 billion by 2032, at a CAGR of 4.7% during the forecast period.
| REPORT ATTRIBUTE |
DETAILS |
| Historical Period |
2020-2023 |
| Base Year |
2024 |
| Forecast Period |
2025-2032 |
| Wind Energy Market Size 2024 |
USD 99 billion |
| Wind Energy Market, CAGR |
4.7 |
| Wind Energy Market Size 2032 |
USD 143.53 billion |
Key players in the wind energy market include Siemens Gamesa Renewable Energy, Vestas, GE Vernova, Goldwind, Nordex SE, Envision Group, and Mingyang Smart Energy Group. These companies focus on advancing turbine technology, expanding offshore wind capacity, and integrating digital solutions to improve operational efficiency. Europe led the global wind energy market in 2024 with nearly 35% share, supported by large-scale offshore projects in the UK, Germany, and the Netherlands. North America followed with over 30% share, driven by onshore installations in the U.S. and rising offshore activity along the East Coast. Asia Pacific accounted for around 25%, led by rapid capacity additions in China and India.
Market Insights
- The wind energy market was valued at USD 99 billion in 2024 and is projected to reach USD 143.53 billion by 2032, growing at a CAGR of 4.7% between 2025 and 2032.
- Growth is driven by global renewable energy targets, falling levelized cost of energy, and technological advancements such as larger rotor diameters and taller towers that improve efficiency.
- Key trends include rapid expansion of offshore wind projects, adoption of floating turbine technology, and integration of digital monitoring systems for predictive maintenance.
- The market is competitive, with major players focusing on capacity expansion, supply chain localization, and strategic collaborations to strengthen market position and reduce costs.
- Europe led with nearly 35% share in 2024, followed by North America with over 30% and Asia Pacific with around 25%; horizontal axis wind turbines dominated the market, accounting for over 85% share.
Access crucial information at unmatched prices!
Request your sample report today & start making informed decisions powered by Credence Research Inc.!
Download Sample
Market Segmentation Analysis:
By Turbine Type
Horizontal axis wind turbines dominated the market, accounting for over 85% share in 2024. Their dominance is driven by high efficiency, proven technology, and suitability for large-scale installations. These turbines deliver optimal power generation in both onshore and offshore projects, supporting utility-scale energy needs. Manufacturers continue to innovate with longer blades and taller towers to maximize energy capture. Vertical axis turbines hold a small share and are mainly used for small-scale or urban applications. Their lower efficiency and higher maintenance costs limit adoption compared to horizontal axis designs.
- For instance, Siemens Gamesa’s SG 14-236 DD offshore turbine has rotor diameter of 236 m and blade length of 115 m.
By Turbine Rating
The >2 to 5 MW segment led the market with more than 40% share in 2024. These turbines strike a balance between cost, performance, and grid integration, making them ideal for onshore wind farms. Developers prefer this capacity range as it offers reliable energy output while reducing installation costs per megawatt. Growth in wind farm repowering projects also supports demand for this rating. Larger turbines above 8 MW are gaining traction in offshore installations, while ≤ 2 MW systems serve small-scale and community projects but remain a niche segment.
- For instance, The Vestas V150-4.2 MW onshore turbine has a blade length of 73.7 meters and a total rotor diameter of 150 meters. It is available with various hub height options, including 105 m, 123 m, 145 m, 155 m, and 166 m, to suit specific site and project conditions.
By Installation
Onshore installations held the largest share, exceeding 70% in 2024, driven by lower project costs and easier grid connectivity. Onshore projects benefit from shorter construction timelines and simpler maintenance, making them the preferred choice for many countries. Government policies and renewable energy targets further accelerate onshore wind farm development. Offshore wind is expanding rapidly due to increasing investments in floating and fixed-bottom projects. Advancements in turbine size and subsea infrastructure are reducing levelized costs, positioning offshore wind as a key contributor to future renewable energy capacity expansion.
Market Overview
Rising Global Renewable Energy Targets
Governments worldwide are implementing ambitious renewable energy targets, driving large-scale wind energy deployment. National policies and climate commitments such as net-zero goals are fueling investments in onshore and offshore projects. Incentives like feed-in tariffs, tax credits, and renewable portfolio standards support project economics. This regulatory push encourages utilities and developers to expand capacity and upgrade infrastructure. The growing focus on energy transition and decarbonization ensures wind power remains a cornerstone of clean energy strategies, sustaining demand across mature and emerging markets globally.
- For instance, China Three Gorges’ commissioning of the MySE 16-260 in 2023 helped meet national clean energy targets. Other governments also target replacing thermal plants with ≥ 6-10 MW wind turbines.
Technological Advancements in Turbine Design
Continuous improvements in turbine technology are boosting efficiency and lowering the cost of wind power. Innovations such as larger rotor diameters, higher hub heights, and advanced blade materials enhance energy capture, especially in low-wind regions. Digital monitoring and predictive maintenance solutions improve reliability and reduce downtime. Floating wind turbine technology is opening new deep-water opportunities for offshore projects. These advancements make wind projects more economically viable, attracting both public and private investments and encouraging rapid capacity additions across key regions.
- For instance, GE’s Cypress platform (e.g. its 5.3-158 turbine) uses a two-piece blade design allowing longer blades (158 m rotor diameter) for better siting. Digital monitoring also improving reliability.
Falling Levelized Cost of Energy (LCOE)
The significant decline in wind power’s LCOE has made it highly competitive with fossil fuel generation. Economies of scale, streamlined supply chains, and improved project execution have reduced capital and operational costs. Turbines now produce more electricity per megawatt installed, improving project returns. This cost competitiveness drives utilities to prioritize wind over thermal sources for new capacity additions. The trend strengthens the case for wind as a reliable, scalable, and sustainable energy source, supporting its long-term market expansion worldwide.
Key Trends & Opportunities
Rapid Expansion of Offshore Wind Projects
Offshore wind is emerging as a major growth area due to vast untapped potential and stronger wind resources. Europe leads the market, while Asia-Pacific and the U.S. are witnessing rapid offshore project announcements. Floating offshore wind technology allows deployment in deep waters, unlocking new coastal zones. Governments are supporting offshore projects through dedicated auctions and infrastructure investments. This trend creates opportunities for turbine suppliers, component manufacturers, and engineering firms to develop advanced solutions and capture new revenue streams.
- For instance, Vestas’s EnVentus platform (e.g. V162-6.2 MW) has rotor diameter of 162 m, sweeping 20,612 sq m, with much higher yield in medium wind speeds
Integration of Digital Technologies
Digitalization is transforming wind farm operations with IoT sensors, AI-based analytics, and predictive maintenance systems. These tools enable real-time monitoring, early fault detection, and performance optimization, reducing operational costs. Data-driven insights improve turbine availability and extend asset life cycles. Companies are investing in digital twin technology to simulate and optimize turbine performance under varying conditions. The integration of smart technologies enhances project bankability and efficiency, creating significant opportunities for digital solution providers in the wind energy market.
- For instance, Siemens Gamesa SG 14-236 DD (14 MW, 236 m rotor) is built for offshore serial production in 2024. Also MingYang’s MySE 16-260 (16 MW, 260 m rotor) is already connected to grid offshore in China.
Key Challenges
Grid Integration and Transmission Constraints
Expanding wind capacity puts pressure on existing grid infrastructure, causing congestion and curtailment issues. Many regions face delays in building transmission lines to connect remote wind farms to demand centers. Grid stability challenges increase with higher shares of variable renewable energy, requiring advanced balancing solutions. Investment in grid modernization and storage is critical to avoid energy losses. These bottlenecks can slow project deployment and reduce profitability, posing a major challenge for the industry’s growth trajectory.
Supply Chain Volatility and Rising Costs
Fluctuating raw material prices, logistics disruptions, and component shortages are straining the wind energy supply chain. Key materials such as steel, rare earth magnets, and resins have seen price spikes, impacting turbine manufacturing costs. Rising transportation expenses and geopolitical tensions further add to project risks. Developers face margin pressures, and some projects experience delays or cancellations due to cost overruns. Addressing these challenges requires diversifying suppliers, localizing production, and adopting efficient procurement strategies to stabilize the industry.
Regional Analysis
North America
North America held over 30% share of the wind energy market in 2024, driven by strong policy support and large-scale project deployment in the U.S. Production tax credits and state-level renewable portfolio standards continue to encourage capacity additions. The U.S. Midwest and Texas remain key hubs for onshore wind installations due to favorable wind resources and available land. Offshore wind projects along the East Coast are gaining momentum, supported by federal lease auctions and infrastructure investments. Canada also contributes to regional growth with steady investments in wind power to diversify its renewable energy mix.
Europe
Europe accounted for nearly 35% share of the wind energy market in 2024, making it the leading region globally. The region benefits from a mature wind power ecosystem, well-developed grid infrastructure, and supportive EU climate policies. Offshore wind dominates growth, with countries like the UK, Germany, and the Netherlands expanding large-scale projects in the North Sea. Repowering of aging onshore farms also drives capacity upgrades. European players are investing heavily in floating wind technology to tap deep-water potential, ensuring sustained regional leadership and continued innovation in wind power deployment and operational efficiency.
Asia Pacific
Asia Pacific captured around 25% share of the wind energy market in 2024, fueled by rapid capacity expansion in China and India. China remains the single largest market, supported by government targets and cost-competitive domestic manufacturing. India is accelerating installations to meet renewable energy targets and address rising electricity demand. Offshore wind development is growing in China, South Korea, and Japan, with major projects under construction. The region benefits from improving supply chains and growing foreign investments, which strengthen local manufacturing capabilities and reduce overall project costs, driving significant long-term market opportunities.
Latin America
Latin America held close to 6% share of the wind energy market in 2024, with Brazil leading regional growth. Favorable wind resources, competitive auction programs, and private investments support capacity additions in Brazil and Mexico. Argentina and Chile are expanding renewable portfolios, focusing on wind energy to reduce dependence on fossil fuels. Lower project development costs and supportive policies are attracting international developers to the region. Increasing integration of wind power with solar and hybrid projects is emerging as a trend, enhancing grid stability and optimizing renewable generation across Latin American countries.
Middle East & Africa
Middle East & Africa accounted for nearly 4% share of the wind energy market in 2024, supported by rising clean energy initiatives. South Africa leads the market with a robust pipeline of wind projects under its Renewable Energy Independent Power Producer Procurement Programme. Countries in the Middle East, including Saudi Arabia and Egypt, are investing in wind energy to diversify energy sources and meet Vision 2030 and similar national goals. Improved financing frameworks and international partnerships are enabling large-scale project execution. The region is poised for growth as grid infrastructure and policy frameworks strengthen further.
Market Segmentations:
By Turbine Type:
- Horizontal Axis
- Vertical Axis
By Turbine Rating:
- ≤ 2 MW
- >2 to 5 MW
- >5 to 8 MW
- >8 to 10 MW
- >10 to 12 MW
- > 12 MW
By Installation:
By Geography:
- North America
- Europe
- UK
- France
- Germany
- Italy
- Spain
- Russia
- Rest of Europe
- Asia Pacific
- China
- Japan
- South Korea
- India
- Australia
- Southeast Asia
- Rest of Asia Pacific
- Latin America
- Brazil
- Argentina
- Rest of Latin America
- Middle East
- GCC Countries
- Israel
- Turkey
- Rest of Middle East
- Africa
- South Africa
- Egypt
- Rest of Africa
Competitive Landscape
Key players in the wind energy market include Siemens Gamesa Renewable Energy, EOLINK, Doosan Corporation, Envision Group, Nordex SE, Vestas, Goldwind, Mingyang Smart Energy Group, GE Vernova, Bergey Windpower, Hitachi Ltd., Sinovel Wind Group, Shanghai Electric, and CSSC Offshore Wind Power Co., Ltd. The market remains highly competitive, with companies focusing on expanding production capacity, advancing turbine technology, and optimizing project execution. Strategic collaborations and long-term supply agreements are common to secure market presence and reduce costs. Firms are investing in offshore wind and floating turbine solutions to capture new opportunities in deep-water regions. Digitalization and predictive maintenance tools are increasingly integrated to enhance performance and reduce downtime. Regional expansions and localization strategies strengthen supply chains and align with government initiatives. Competitive intensity drives continuous innovation, ensuring better efficiency, larger turbine capacity, and lower levelized cost of energy for global wind energy projects.
Shape Your Report to Specific Countries or Regions & Enjoy 30% Off!
Key Player Analysis
- Siemens Gamesa Renewable Energy
- EOLINK
- Doosan Corporation
- Envision Group
- Nordex SE
- Vestas
- Goldwind
- Mingyang Smart Energy Group
- GE Vernova
- Bergey Windpower
- Hitachi, Ltd.
- Sinovel Wind Group
- Shanghai Electric
- CSSC Offshore Wind Power Co., Ltd.
Recent Developments
- In 2025, Siemens Gamesa is undergoing operational restructuring and aims to stabilize its onshore and offshore wind operations to return to profitability by fiscal year 2026.
- In 2025, Goldwind completed commercial operations for the 500 MW Red Sea Wind Farm in Egypt, deploying 84 units of its GW165-6.0 MW turbines.
- In 2024, Vestas announce a significant offshore wind turbine order for the Oga Katagami Akita project in Japa
Report Coverage
The research report offers an in-depth analysis based on Turbine Type, Turbine Rating, Installation and Geography. It details leading market players, providing an overview of their business, product offerings, investments, revenue streams, and key applications. Additionally, the report includes insights into the competitive environment, SWOT analysis, current market trends, as well as the primary drivers and constraints. Furthermore, it discusses various factors that have driven market expansion in recent years. The report also explores market dynamics, regulatory scenarios, and technological advancements that are shaping the industry. It assesses the impact of external factors and global economic changes on market growth. Lastly, it provides strategic recommendations for new entrants and established companies to navigate the complexities of the market.
Future Outlook
- Global wind energy capacity will continue to expand, supported by strong policy frameworks.
- Offshore wind projects will grow rapidly, driven by floating wind technology advancements.
- Turbine sizes will increase, enabling higher power generation and lower project costs.
- Digital monitoring and predictive maintenance will enhance turbine efficiency and reliability.
- Emerging markets in Asia, Latin America, and Africa will witness significant project development.
- Grid modernization efforts will improve integration of large-scale wind energy capacity.
- Hybrid projects combining wind, solar, and storage will gain traction for grid stability.
- Local manufacturing and supply chain diversification will reduce project delays and costs.
- Corporate power purchase agreements will drive private sector investments in wind energy.
- Continued cost reduction will make wind power more competitive against fossil fuel generation.


