
Market Overview:
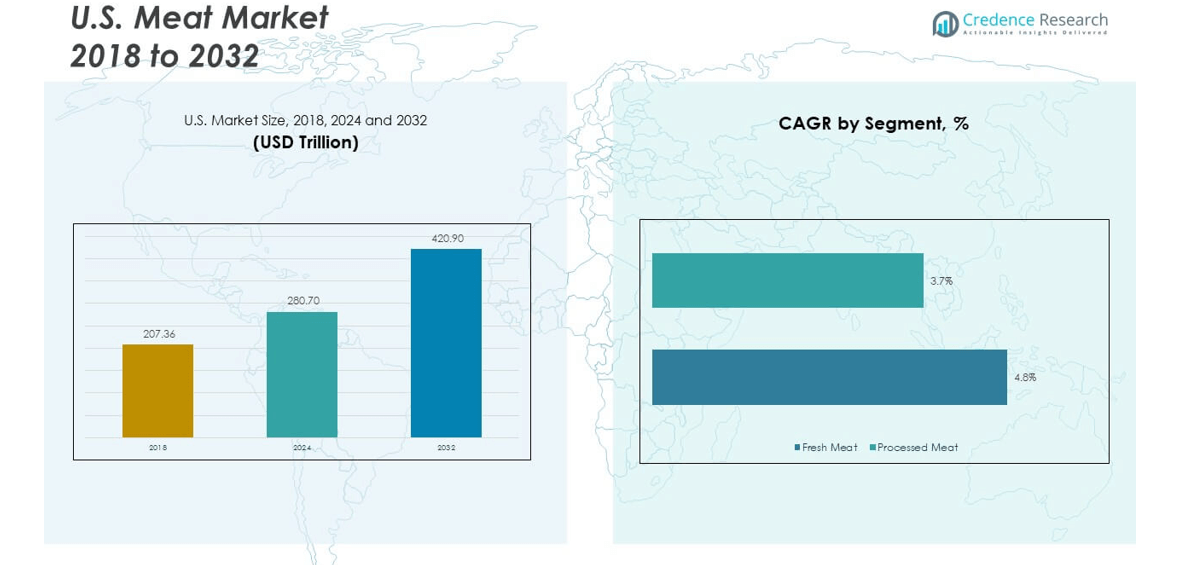
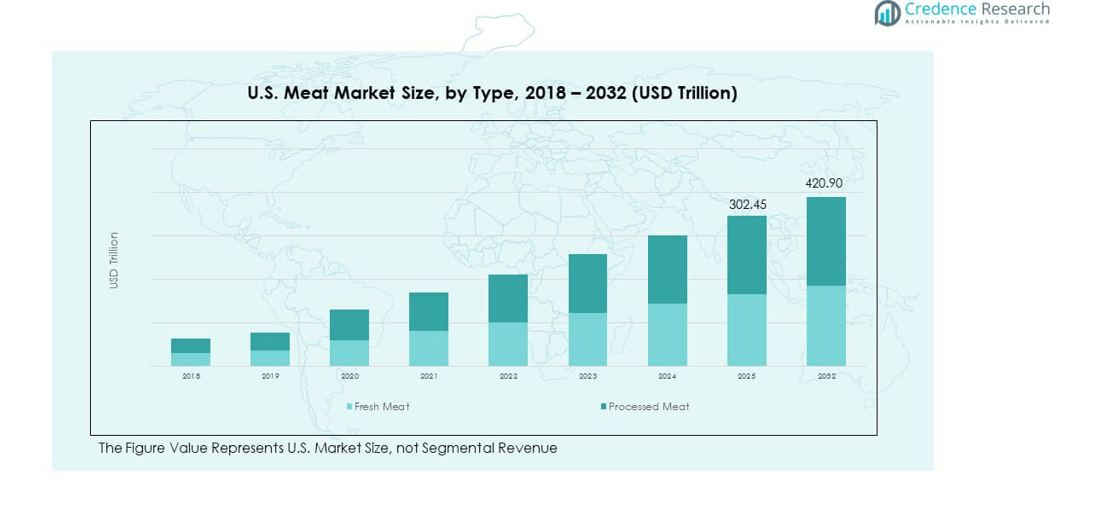
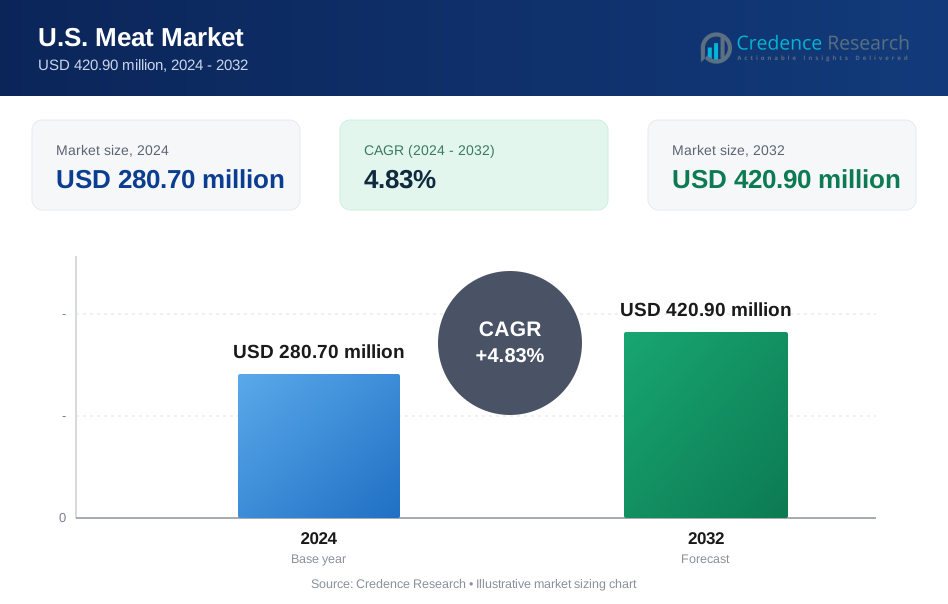
The U.S. Meat Market size was valued at USD 207.36 million in 2018 to USD 280.70 million in 2024 and is anticipated to reach USD 420.90 million by 2032, at a CAGR of 4.83% during the forecast period.
| REPORT ATTRIBUTE | DETAILS |
|---|---|
| Historical Period | 2020-2023 |
| Base Year | 2024 |
| Forecast Period | 2025-2032 |
| U.S. Meat Market Size 2024 | USD 280.70 million |
| U.S. Meat Market, CAGR | 4.83% |
| U.S. Meat Market Size 2032 | SD 420.90 million |
The U.S. Meat Market is driven by growing demand for high-quality protein across households and foodservice outlets. Consumers seek convenience-driven solutions, pushing growth in processed and ready-to-cook segments. Rising disposable incomes encourage purchases of premium and organic meat products, while strong supply chain networks ensure accessibility. Quick-service restaurants contribute to higher consumption through diversified menus featuring poultry, beef, and pork. Packaging and cold chain advancements improve safety, freshness, and longer shelf life. Export opportunities further reinforce demand by connecting domestic producers with global markets.
The U.S. Meat Market shows diverse regional patterns shaped by cultural, economic, and demographic factors. The South leads due to strong consumer preference for poultry and pork, supported by large-scale production hubs. The Midwest holds significant presence driven by livestock farming and processing facilities. The Northeast maintains steady demand, with urban populations supporting growth in processed meat and retail sales. The West reflects rising consumer interest in organic, grass-fed, and specialty categories. These regional strengths collectively ensure broad market growth and sustained expansion across the country.
Market Insights
- The U.S. Meat Market was valued at USD 207.36 million in 2018, reached USD 280.70 million in 2024, and is projected to hit USD 420.90 million by 2032, growing at a CAGR of 4.83%.
- The South leads with 34% share, driven by high poultry and pork consumption, followed by the Midwest with 28% due to strong livestock production, and the Northeast with 22% supported by urban demand for processed meat.
- The West, holding 16% share, is the fastest-growing region, fueled by rising demand for organic, grass-fed, and specialty meats along with strong e-commerce adoption.
- Fresh meat accounted for 45% of the segment share in 2024, reflecting steady household demand for traditional cooking and consumption preferences.
- Processed meat dominated with 55% share in 2024, supported by growth in ready-to-eat, quick-service, and packaged food categories.
Market Drivers
Rising Demand For Protein-Rich Diets And Nutritional Food Preferences
The U.S. Meat Market experiences strong growth from consumer demand for protein-rich diets. Health-conscious buyers seek leaner meat cuts with balanced nutrition. It benefits from increasing awareness about essential amino acids and muscle health. Rising gym culture and fitness routines influence higher intake of animal protein. Consumers replace carbohydrate-heavy meals with protein-rich alternatives for weight control. The retail sector expands offerings of ready-to-cook meat to meet this demand. Food companies emphasize nutrient labeling to build transparency and consumer trust. This creates steady traction across both retail and foodservice sectors.
- For instance, in July 2025, Tyson Foods launched Tyson® Simple Ingredient Nuggets made with 100% all-natural white meat chicken and offering high protein content, specifically targeting health-conscious consumers seeking transparent ingredient labeling and protein-focused meal options.
Expanding Foodservice Sector And Growth Of Quick-Service Restaurants Nationwide
The U.S. Meat Market gains momentum from the expansion of the foodservice sector. Quick-service restaurants focus on diversified menus that highlight meat-based dishes. It receives consistent demand from casual dining, cafeterias, and fine dining formats. Higher frequency of eating out strengthens overall meat sales volumes. Chains introduce premium burgers, steaks, and chicken meals to attract varied customers. Growth in urban centers fuels consumption through delivery platforms and dine-in outlets. Investments in kitchen automation support faster preparation and consistency in servings. This sector sustains the market’s long-term demand base effectively.
- For instance, McDonald’s Double Quarter Pounder with Cheese has been verified by its official nutrition data and media reviews to provide 48 grams of protein per sandwich, directly addressing U.S. consumer demand for protein-rich menu offerings.
Advancements In Cold Chain Logistics And Meat Packaging Innovations
The U.S. Meat Market benefits from strong advancements in cold chain infrastructure. Packaging technologies extend shelf life while ensuring safety and freshness. It achieves stability through vacuum-sealed packs, modified atmosphere packaging, and smart labels. Retailers leverage these solutions to minimize spoilage and maintain premium quality. Distributors reduce wastage with advanced temperature-controlled transport systems. Cold storage networks ensure continuous supply from production to end-users. These innovations address contamination concerns and regulatory compliance requirements. Such systems improve trust among retailers and final consumers alike.
Rising Disposable Incomes And Consumer Shift Toward Premium Meat Options
The U.S. Meat Market witnesses steady support from higher disposable incomes. Households allocate more spending to high-quality beef, poultry, and specialty cuts. It aligns with the preference for gourmet and premium dining experiences. Supermarkets increase their focus on organic and grass-fed meat products. Specialty brands highlight traceability and superior farming practices to attract health-focused buyers. Higher-income groups show willingness to pay for convenience-driven, ready-to-eat formats. Exports of premium U.S. beef to international markets strengthen domestic processing facilities. These dynamics improve growth opportunities and sustain long-term revenue streams.
Market Trends
Adoption Of Plant-Based Meat Alternatives And Hybrid Protein Products
The U.S. Meat Market records influence from the rising adoption of plant-based alternatives. Consumers experiment with hybrid protein products blending meat and plant elements. It reflects a growing interest in flexitarian diets balancing taste and health. Retail shelves expand offerings in sausages, patties, and meat substitutes. Fast-food outlets trial blended recipes to serve evolving dietary preferences. Investors focus on technology enabling realistic texture and flavor for plant alternatives. This trend attracts health-minded and environmentally conscious customers. Hybrid products secure wider acceptance across different consumer segments.
- For instance, Beyond Meat unveiled two new varieties of its Beyond Steak line Chimichurri and Korean BBQ-Style in February 2025, distributed nationwide via Sprouts Farmers Market. These products maintain a nutritional profile of 20 grams of plant-based protein per serving, only 1 gram of saturated fat, and zero cholesterol, and are certified by both the American Heart Association’s Heart-Check program and the American Diabetes Association’s Better Choices for Life program.
Growing Focus On Traceability And Transparency In Meat Supply Chains
The U.S. Meat Market trends toward enhanced supply chain transparency. Consumers demand clear labeling on sourcing, feed type, and production practices. It strengthens trust when buyers understand the origins of their food. Blockchain-based systems record detailed supply histories for beef, pork, and poultry. Retailers introduce QR codes linking shoppers to detailed farm data. Food safety incidents encourage regulators to mandate stricter traceability norms. Brands invest in digital tracking tools for inventory monitoring and compliance. This rising transparency reinforces customer loyalty and long-term confidence.
Integration Of Automation And Robotics In Meat Processing Facilities
The U.S. Meat Market experiences significant influence from automation in processing. Robotics streamline cutting, packaging, and sorting operations in modern facilities. It increases consistency, efficiency, and hygiene across large-scale production lines. Meat processors invest in AI-driven systems for predictive maintenance and monitoring. Automation reduces labor dependence while meeting rising volume demands. These systems support higher precision in portioning and labeling. Companies scale up production without compromising on food safety standards. Robotics adoption ensures cost savings and improved operational sustainability.
- For instance, JBS, the world’s largest meat processor, partnered with Scott Technology to introduce advanced robotics at its Bordertown lamb processing facility in Australia. The system uses robotic cutting equipment guided by X-ray and imaging technologies to improve precision and efficiency. JBS has expanded its use of Scott Technology’s automation solutions across other Australian plants, strengthening consistency, safety, and productivity in meat processing operations.
Expansion Of E-Commerce And Direct-To-Consumer Meat Delivery Platforms
The U.S. Meat Market observes strong growth from digital retail adoption. Online channels deliver meat products directly to household customers. It gains demand from urban consumers seeking convenience and doorstep delivery. Subscription models emerge for regular supply of beef, chicken, or specialty meats. Cold storage packaging ensures freshness during last-mile distribution. Retailers use digital platforms to highlight premium, organic, and specialty options. Marketing strategies include recipe kits bundled with specific meat portions. This digital expansion reshapes traditional distribution and creates new customer connections.
Market Challenges Analysis
Rising Regulatory Pressures And Food Safety Compliance Across Production Stages
The U.S. Meat Market faces challenges from stringent regulatory requirements. Food safety norms impose heavy monitoring during slaughter, processing, and packaging. It raises compliance costs for small and mid-sized producers. Recalls caused by contamination incidents create financial risks and reputational damage. Regulators mandate detailed labeling and transparency on ingredients and sourcing. These requirements strain companies with limited technological resources. Adapting facilities to new federal safety guidelines demands major investments. Producers often struggle to align operations with evolving compliance standards.
Environmental Concerns And Sustainability Demands From Consumers And Regulators
The U.S. Meat Market encounters sustainability pressures from multiple stakeholders. Consumers question the environmental footprint of intensive meat production. It faces scrutiny on greenhouse gas emissions, water use, and land management. Companies respond by investing in renewable energy and waste reduction strategies. Rising pressure from environmental groups accelerates calls for sustainable practices. Exports encounter trade scrutiny when sustainability certifications are missing. Retailers shift preferences toward suppliers with eco-friendly credentials. This challenge compels industry leaders to balance profitability with sustainable commitments.
Market Opportunities
Expansion Into Health-Oriented And Specialty Meat Product Segments
The U.S. Meat Market presents opportunities through innovation in health-oriented offerings. Producers highlight organic, grass-fed, and hormone-free categories to capture niche buyers. It benefits from a consumer shift toward premium and specialty items. Retailers promote exotic meat cuts and international flavors to diversify offerings. Growing fitness culture enhances demand for leaner proteins like turkey and fish. Specialty packaging highlights nutritional information to attract health-conscious buyers. This positioning aligns brands with consumer expectations of quality and transparency.
Leveraging Technology For Efficiency And Direct Engagement With Consumers
The U.S. Meat Market gains opportunities through digital platforms and advanced processing systems. Automation improves efficiency while maintaining safety and reducing costs. It strengthens operations through predictive analytics and smart supply chain tools. E-commerce platforms enable direct engagement with households through customized offerings. Subscription-based models create loyalty among urban buyers. Investments in blockchain ensure traceability and improve consumer confidence. Digital campaigns support storytelling around product origin and sustainability. These tools help producers secure stronger brand differentiation in competitive markets.
Market Segmentation Analysis
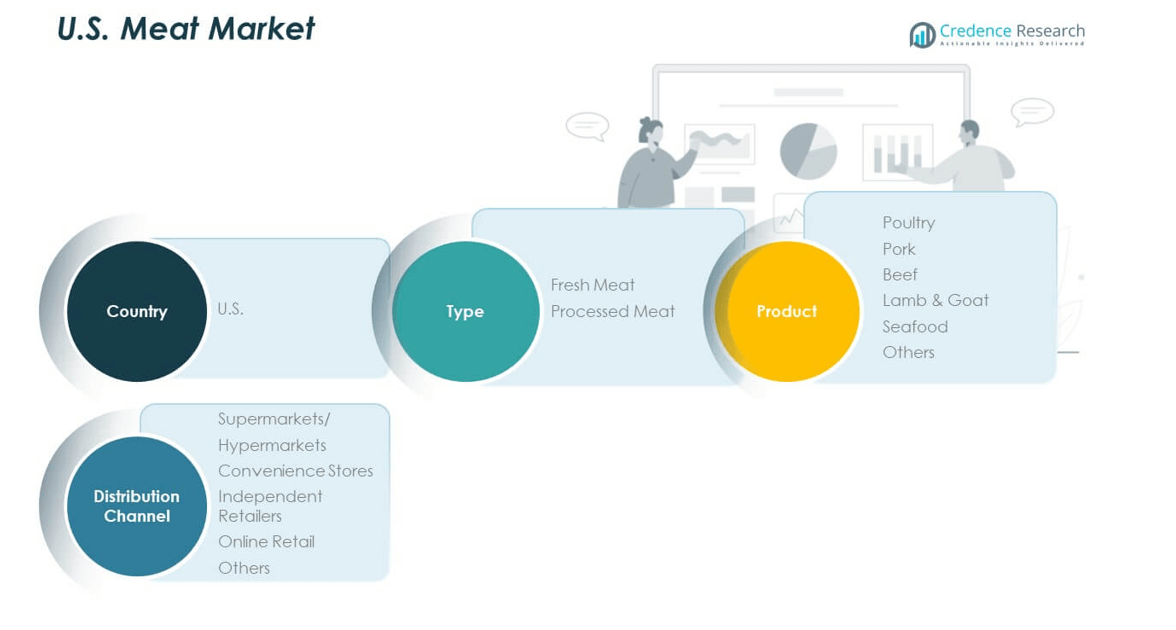
By type, the U.S. Meat Market is divided into fresh meat and processed meat, with processed meat holding the larger share due to higher demand for convenience and longer shelf life. Fresh meat continues to retain strong demand among households preferring traditional cooking, while processed meat benefits from increasing adoption in quick-service restaurants and ready-to-eat products. It gains momentum from shifting consumer lifestyles that emphasize time-saving and value-driven purchases.
- For example, JBS USA announced in February 2025 that it plans to invest $200 million across its Cactus, Texas and Greeley, Colorado beef facilities, including a new state-of-the-art fabrication floor, expanded ground beef room in Cactus, and a new distribution center in Greeley. The projects will begin construction in 2025. The Greeley facility employs over 3,800 team members, and the investment aims to improve efficiencies and increase production capacity.
By product, poultry leads the market, supported by affordability and versatility in both retail and foodservice channels. Beef remains a key contributor, driven by strong cultural preference and restaurant demand. Pork continues to attract consumers in regional markets, while lamb, goat, and seafood grow steadily in niche categories. It experiences expansion in specialty products targeting health-conscious buyers. The diversified product portfolio ensures steady consumption across diverse demographics.
- For instance, Cargill, the second largest U.S. fed beef processor, employs 3-D vision and conveyor automation at its Dodge City plant to improve yield and worker safety. It utilizes 99% of each cow, producing enough deli meat to wrap the Earth 2.6 times in sub sandwiches and turning 7.1 million hides annually into leather goods.
By distribution channel, supermarkets and hypermarkets dominate due to wide product variety and established supply networks. Convenience stores hold relevance in urban areas with higher impulse purchases, while independent retailers maintain trust in local communities. Online retail is expanding rapidly, supported by e-commerce growth and demand for home delivery. It leverages digital platforms to connect with younger and tech-savvy consumers. The combined strength of multiple channels enhances overall market accessibility.
Segmentation
By Type
- Fresh Meat
- Processed Meat
By Product
- Poultry
- Pork
- Beef
- Lamb & Goat
- Seafood
- Others
By Distribution Channel
- Supermarkets / Hypermarkets
- Convenience Stores
- Independent Retailers
- Online Retail
- Others
By Country
- S
Regional Analysis
Northeast and Midwest
The Northeast accounts for 22% of the U.S. Meat Market, driven by high urban density and a strong preference for processed meat products. Large retail chains in states like New York and Massachusetts expand product availability across supermarkets and hypermarkets. The Midwest holds 28% market share, supported by its position as the nation’s agricultural hub. Abundant livestock production in Iowa, Nebraska, and Illinois strengthens beef and pork supply. It benefits from advanced cold chain networks ensuring efficient transport to both retail and foodservice channels. Strong consumer loyalty toward traditional beef and pork products maintains demand stability.
South
The South dominates with 34% market share, benefiting from high consumption levels of poultry and pork. Regional culture favors meat-intensive diets, particularly in Texas, Georgia, and North Carolina. It thrives on strong production clusters and large-scale processing facilities. The presence of industry leaders strengthens supply chains and enhances affordability for consumers. Growing demand for quick-service restaurants and convenience foods supports steady expansion. The region’s role as a major exporter of poultry further contributes to growth momentum. High population levels continue to support sustained meat consumption patterns.
West
The West accounts for 16% market share, led by California as the primary consumption hub. Rising preference for organic, grass-fed, and specialty meat products distinguishes consumer behavior. It gains traction through online retail platforms catering to health-conscious and premium buyers. Exports from coastal ports in California and Washington expand international trade reach. Regional suppliers emphasize sustainability certifications to meet consumer expectations. Growth in diverse immigrant populations fuels rising demand for lamb, goat, and specialty meat categories. The U.S. Meat Market leverages this regional diversity to strengthen its overall footprint.
Key Player Analysis
- Tyson Foods, Inc.
- Cargill, Inc.
- JBS USA Holdings, Inc.
- Smithfield Foods, Inc.
- Hormel Foods Corporation
- Conagra Brands Inc.
- Clemens Food Group
- Perdue Farms
- National Beef Packing Co.
- Sysco Corporation
Competitive Analysis
The U.S. Meat Market is highly competitive, led by Tyson Foods, Cargill, and JBS USA Holdings. These companies hold significant processing capacity and maintain strong control over supply chains. It experiences constant rivalry as firms invest in technology, automation, and cold chain logistics to boost efficiency. Smithfield Foods and Hormel Foods strengthen competition with diversified product portfolios in pork and processed meats. Conagra Brands, Perdue Farms, and Clemens Food Group expand through retail-driven strategies targeting specialty and convenience segments. National Beef Packing and Sysco Corporation enhance distribution efficiency, ensuring widespread access across retail and foodservice channels. Strategic acquisitions, product innovation, and international exports remain central to competitive positioning. Companies emphasize sustainability, traceability, and premium product offerings to meet shifting consumer expectations.
Recent Developments
- In September 2025, Tyson Foods, Inc. launched a new lineup of custom chicken nuggets in collaboration with three NFL teams: the Denver Broncos, Green Bay Packers, and Philadelphia Eagles. These football-inspired products, branded with each team’s colors and packaging, are now available for fans in time for the 2025 NFL season, showcasing Tyson’s continued push into sports-themed product launches.
- In May 2025, Tyson Foods entered into an agreement to sell four of its existing U.S. cold storage warehouses to Lineage Inc. for $247 million. This transaction is a strategic move to streamline Tyson’s supply chain. The deal also includes plans for the construction of two new fully automated cold storage warehouses, expanding Lineage’s logistics capacity and establishing Tyson as an anchor tenant at the new locations.
- In April 2025, Baldor Specialty Foods made a significant move in the U.S. meat market by acquiring premium meat company Golden Packing. This acquisition, which was announced on April 21, 2025, allows Baldor to vertically integrate meat processing into its premium food distribution business, offering an expanded range of center-of-plate proteins to its extensive customer base.
Report Coverage
The research report offers an in-depth analysis based on Type, Product and Distribution Channel. It details leading market players, providing an overview of their business, product offerings, investments, revenue streams, and key applications. Additionally, the report includes insights into the competitive environment, SWOT analysis, current market trends, as well as the primary drivers and constraints. Furthermore, it discusses various factors that have driven market expansion in recent years. The report also explores market dynamics, regulatory scenarios, and technological advancements that are shaping the industry. It assesses the impact of external factors and global economic changes on market growth. Lastly, it provides strategic recommendations for new entrants and established companies to navigate the complexities of the market.
Future Outlook
- The U.S. Meat Market is expected to expand with sustained consumer demand for protein-rich diets.
- Growth will be supported by strong foodservice expansion and evolving quick-service restaurant menus.
- Technological advancements in cold chain logistics will improve efficiency and reduce wastage across supply chains.
- Rising adoption of organic, grass-fed, and specialty meat categories will strengthen premium market positioning.
- E-commerce platforms and subscription-based models will expand consumer access to meat products.
- Automation and robotics in processing facilities will streamline production and enhance food safety.
- Export opportunities will grow as international markets increase demand for U.S. poultry and beef.
- Transparency and traceability will become standard practice to build consumer trust and regulatory compliance.
- Sustainability initiatives will shape investment priorities, driving eco-friendly practices in production.
- Regional consumption patterns will continue to diversify, with the South retaining dominance in demand.
Request a Free Sample
Fill in your details and we'll send you a free sample report.
- Sample data tables & charts
- Research methodology
Need a Custom Version of This Report?
Tailor the scope, geography, or segments to your exact requirements.
- Custom geography or segment scope
- Direct access to our analyst team
Frequently Asked Questions
What is the current market size for U.S. Meat Market, and what is its projected size in 2032?
At what Compound Annual Growth Rate is the U.S. Meat Market projected to grow between 2024 and 2032?
Which U.S. Meat Market segment held the largest share in 2024?
What are the primary factors fueling the growth of the U.S. Meat Market?
Who are the leading companies in the U.S. Meat Market?
Table of Content
Chapter 1. Report Introduction
- 1.1 Report Description & Purpose
- 1.1.1 Report Title & Market Definition
- 1.1.2 Unique Selling Propositions (USP) & Key Differentiators
- 1.1.3 Value Proposition for Stakeholders
- 1.2 Research Objectives
- 1.2.1 Market Sizing Objectives (Volume & Revenue)
- 1.2.2 Segmentation Objectives
- 1.2.3 Competitive Intelligence Objectives
- 1.2.4 Forecast & Scenario Objectives
- 1.3 Report Scope
- 1.3.1 U.S. Meat Scope – Types & Subtypes Covered
- 1.3.2 Geographic Scope – Regions & Countries Covered
- 1.3.3 Historical Period, Base Year & Forecast Period (2024; forecast to 2032)
- 1.3.4 Inclusions & Exclusions
- 1.4 HS Code & Classification Framework
- 1.5 Currency, Units & Pricing Basis
- 1.6 Target Stakeholders
- 1.7 Limitations & Assumptions
Chapter 2. Executive Summary
- 2.1 Global U.S. Meat Market Snapshot
- 2.1.1 Market Size – Historical (2024) & Forecast (2024-2032) (2024: USD 280.70 million → 2032: USD 420.90 million)
- 2.1.2 Volume & Revenue – Global Totals
- 2.1.3 Key Market Highlights – Top Five Facts
- 2.2 U.S. Meat Market Segmentation Snapshot
- 2.2.1 Market Split by Region – 2024 vs. 2032
- 2.3 Competitive Snapshot
- 2.3.1 Top 10 Players by Revenue Share – 2024
- 2.3.2 Top 10 Players by Volume Share – 2024
- 2.3.3 Recent Strategic Developments (18-Month Summary)
- 2.4 Key Investment Highlights & Strategic Conclusions
Chapter 3. U.S. Meat Market Dynamics & Industry Analysis
- 3.1 Market Overview & Context
- 3.1.1 U.S. Meat Market Position in the Broader Automotive Value Chain
- 3.1.2 OEM vs. Replacement Market Dynamics
- 3.1.3 Market Maturity & Development Stage by Region
- 3.2 U.S. Meat Market Drivers
- 3.3 U.S. Meat Market Restraints & Challenges
- 3.4 U.S. Meat Market Opportunities
- 3.5 Porter's Five Forces Analysis
- 3.5.1 Threat of New Entrants
- 3.5.2 Bargaining Power of Suppliers
- 3.5.3 Bargaining Power of Buyers
- 3.5.4 Threat of Substitutes
- 3.5.5 Competitive Rivalry – Intensity Assessment
- 3.6 U.S. Meat Value Chain Analysis
- 3.6.1 Upstream – Raw Material/Input Suppliers
- 3.6.1.1 Raw Material/Input 1
- 3.6.1.2 Raw Material/Input 2
- 3.6.1.3 Raw Material/Input 3
- 3.6.2 Midstream – Production/Manufacturing/Service Delivery
- 3.6.2.1 Production/Process Overview
- 3.6.2.2 Key Facility Locations & Capacity by Manufacturer
- 3.6.3 Downstream – Distribution & End Consumer
- 3.6.3.1 Primary Channel – B2B/OEM
- 3.6.3.2 Secondary Channels – Dealer, Retail, Online, Direct
- 3.6.4 Value Chain Profitability Analysis
- 3.6.1 Upstream – Raw Material/Input Suppliers
- 3.7 PESTEL Analysis
- 3.7.1 Political Factors
- 3.7.2 Economic Factors
- 3.7.3 Social Factors
- 3.7.4 Technological Factors
- 3.7.5 Environmental Factors
- 3.7.6 Legal Factors
- 3.8 U.S. Meat Supply Chain Analysis
- 3.8.1 Raw Material/Input Supply Risk Assessment
- 3.8.2 Manufacturing Concentration Risk (Geographic Exposure)
- 3.8.3 Trade Disruption Impact Analysis
- 3.9 Regulatory & Policy Landscape
Note: The regulatory and policy landscape section covers regulations based on their applicability to the market, U.S. Meat category, geography, and scope of the study. Only regulatory frameworks with a material impact on operations, compliance, trade, sustainability, or market access are analyzed in detail.
Chapter 4. Key Investment Pockets & Opportunity Analysis
- 4.1 U.S. Meat Market Attractiveness Analysis
- 4.1.1 By Region – Investment Attractiveness Matrix (Volume × CAGR)
- 4.2 Absolute Revenue Growth Opportunity
- 4.2.1 By Region – Absolute USD Growth Through 2032
- 4.3 Incremental Volume Opportunity
- 4.3.1 By Region – Incremental Volume Through 2032
- 4.3.2 Segment – Incremental Volume
- 4.4 Emerging Submarket Opportunity Deep Dive (Subject to Applicability)
- 4.5 Emerging Market Opportunity Scorecards
- 4.5.1 United States
- 4.5.2 Europe
- 4.5.3 Asia
- 4.5.4 Middle East & Africa
Note: Emerging Market Opportunity Scorecards will be included based on relevance and strategic importance. Regions listed are indicative and may vary depending on data availability and market dynamics.
Chapter 5. U.S. Meat Import-Export Analysis & Trade Flows
- 5.1 Global Trade Overview
- 5.1.1 Global Export Value by Country (2024)
- 5.1.2 Global Export Volume by Country (2024)
- 5.1.3 Global Import Value by Country (2024)
- 5.1.4 Global Import Volume by Country (2024)
- 5.1.5 Net Trade Balance by Country (2024)
- 5.2 Export Analysis – Segment
- 5.2.1 Type 1 (HS Code)
- 5.2.2 Type 2 (HS Code)
- 5.2.3 Type 3 (HS Code)
- 5.2.4 Type 4 (HS Code)
- 5.2.5 Type 5 (HS Code)
- 5.3 Import Analysis – Segment
- 5.3.1 Type 1 (HS Code)
- 5.3.2 Type 2 (HS Code)
- 5.3.3 Type 3 (HS Code)
- 5.3.4 Type 4 (HS Code)
- 5.3.5 Type 5 (HS Code)
- 5.4 Average Unit Trade Prices
- 5.4.1 Average Export Price – Segment & Country
- 5.4.2 Average Import Price – Segment & Source Country
- 5.4.3 Price Trends (2024)
- 5.5 Key Trade Route Analysis
- 5.5.1 Trade Route 1
- 5.5.2 Trade Route 2
- 5.5.3 Trade Route 3
- 5.5.4 Trade Route 4
- 5.5.5 Trade Route 5
- 5.6 Trade Policy Impact Assessment
- 5.6.1 US Anti-Dumping & Section 301 Tariffs
- 5.6.2 EU Customs Union Impact
- 5.6.3 Major Free Trade Agreements
- 5.6.4 USMCA Rules of Origin
Note: Trade policy analysis will be included only where relevant to the U.S. Meat market.
Chapter 6. Competitive Landscape & Company Benchmarking
- 6.1 U.S. Meat Market Concentration & Structure
- 6.1.1 Herfindahl-Hirschman Index (HHI) – vs. 2024
- 6.1.2 Tier 1, Tier 2 & Tier 3 Market Structure
- 6.1.3 Global, Regional & Local Player Dynamics
- 6.2 U.S. Meat Market Share Analysis – 2024
- 6.2.1 Global Revenue Share by Company
- 6.2.2 Global Volume Share by Company
- 6.2.3 Regional Revenue Share
- 6.2.4 Market Share Evolution ( vs. 2024)
- 6.2.5 OEM Segment Share by Company
- 6.2.6 Replacement Segment Share by Company
- 6.3 Production/Delivery Capacity & Facility Analysis
- 6.3.1 Global Installed Capacity
- 6.3.2 Capacity Utilization Rates
- 6.3.3 Production/Output Volume
- 6.3.4 Facility Locations & Capacity Map
- 6.3.5 Planned Capacity Additions
- 6.4 U.S. Meat Competitive Benchmarking Matrix
- 6.4.1 Revenue, Volume, CAGR & Profitability Comparison
- 6.4.2 Channel Revenue Mix
- 6.4.3 Geographic Revenue Exposure
- 6.4.4 R&D Intensity
- 6.4.5 Sustainability Maturity
- 6.5 Strategic Developments in U.S. Meat (Last 24 Months)
- 6.5.1 Mergers, Acquisitions & Divestments
- 6.5.2 New U.S. Meat Launches
- 6.5.3 Facility Expansions
- 6.5.4 Strategic Alliances, Joint Ventures & Partnerships
- 6.5.5 Distribution Expansion & Market Entry
- 6.5.6 Sustainability & ESG Initiatives
- 6.6 Competitive Strategy Mapping
- 6.6.1 Leader, Challenger, Follower & Niche Classification
- 6.6.2 Pricing Strategy Comparison
- 6.6.3 Channel Strategy Matrix
Note: Strategic developments are included based on their materiality and the availability of reliable information.
Chapter 7. Global U.S. Meat Market – By Distribution Channel
- 7.1 Segment Overview
- 7.1.1 Volume & Revenue Split by Channel (2024 & 2032)
- 7.1.2 Channel Mix Evolution (2024-2032)
Chapter 8. Regional Market Analysis – Global Overview
- 8.1 Global Regional Overview
- 8.1.1 Regional Volume Share
- 8.1.2 Regional Revenue Share
- 8.1.3 Regional Volume by Region
- 8.1.4 Regional Revenue by Region
- 8.1.5 Regional Forecast Through 2032
- 8.2 Cross-Regional Segment Analysis
- 8.2.1 By Distribution Channel
- 8.2.2 By Brand/Price Tier
Chapter 9. North America U.S. Meat Market
- 9.1 United States
- 9.2 Canada
- 9.3 Mexico
Chapter 10. Europe U.S. Meat Market
- 10.1 Germany
- 10.2 France
- 10.3 Italy
- 10.4 United Kingdom
- 10.5 Spain
- 10.6 Poland
- 10.7 Russia
- 10.8 Netherlands
- 10.9 Belgium
- 10.10 Sweden
- 10.11 Denmark
- 10.12 Norway
- 10.13 Rest of Europe
Chapter 11. Asia Pacific U.S. Meat Market
- 11.1 China
- 11.2 India
- 11.3 Japan
- 11.4 South Korea
- 11.5 Thailand
- 11.6 Indonesia
- 11.7 Vietnam
- 11.8 Malaysia
- 11.9 Australia
- 11.10 Rest of Asia Pacific
Chapter 12. Latin America U.S. Meat Market
- 12.1 Brazil
- 12.2 Argentina
- 12.3 Colombia
- 12.4 Chile
- 12.5 Rest of Latin America
Chapter 13. Middle East U.S. Meat Market
- 13.1 Saudi Arabia
- 13.2 United Arab Emirates
- 13.3 Turkey
- 13.4 Israel
- 13.5 Iran
- 13.6 Rest of the Middle East
Chapter 14. Africa U.S. Meat Market
- 14.1 South Africa
- 14.2 Egypt
- 14.3 Nigeria
- 14.4 Morocco
- 14.5 Rest of Africa
Chapter 15. U.S. Meat Company Profiles
- 15.1 [Company 01]
- 15.1.1 Company Overview
- 15.1.2 Key Management Personnel
- 15.1.3 Products & Services Portfolio
- 15.1.4 Financial Performance
- 15.1.5 Key Market Focus & Geographic Presence
- 15.1.6 Recent Developments & Strategic Initiatives
Note: The company profile list is preliminary and may change based on research findings, market developments, data availability, and client requirements.
Chapter 16. Appendices
- Appendix A – List of Abbreviations & Acronyms
- Appendix B – Industry Classification Code Reference – Full Series
- Appendix C – Production & Capacity Data Tables
- Appendix D – End-Use & Demand Base Tables
- Appendix E – Consumption & Replacement Rate Assumptions
- Appendix F – ASP Reference Tables
- Appendix G – Manufacturing & Facility Database
- Appendix H – Import-Export Data Tables
- Appendix I – Regulatory Summary Tables
- Appendix J – Primary Research Participant List (Anonymized)
- Appendix K – Primary Research Questionnaire Framework
- Appendix L – Data Sources & Bibliography
- Appendix M – Market Size Divergence & Source Comparison
Chapter 17. Research Methodology
- 17.1 Research Framework & Philosophy
- 17.2 Secondary Research – Sources, Hierarchy & Data Extraction
- 17.3 Data Modeling – Bottom-Up & Top-Down Market Sizing
- 17.4 Primary Research – Stakeholder Framework, LOI & Sample Sizes
- 17.5 Forecast Methodology – Regression, Scenario & Sensitivity Analysis
- 17.6 Quality Control – Four-Layer Validation Framework
- 17.7 Limitations & Standard Assumptions
- 17.8 Disclaimer
