CHAPTER NO. 1 : INTRODUCTION 19
1.1.1. Report Description 19
Purpose of the Report 19
USP & Key Offerings 19
1.1.2. Key Benefits for Stakeholders 19
1.1.3. Target Audience 20
1.1.4. Report Scope 20
CHAPTER NO. 2 : EXECUTIVE SUMMARY 21
2.1. Work Boot Market Snapshot 21
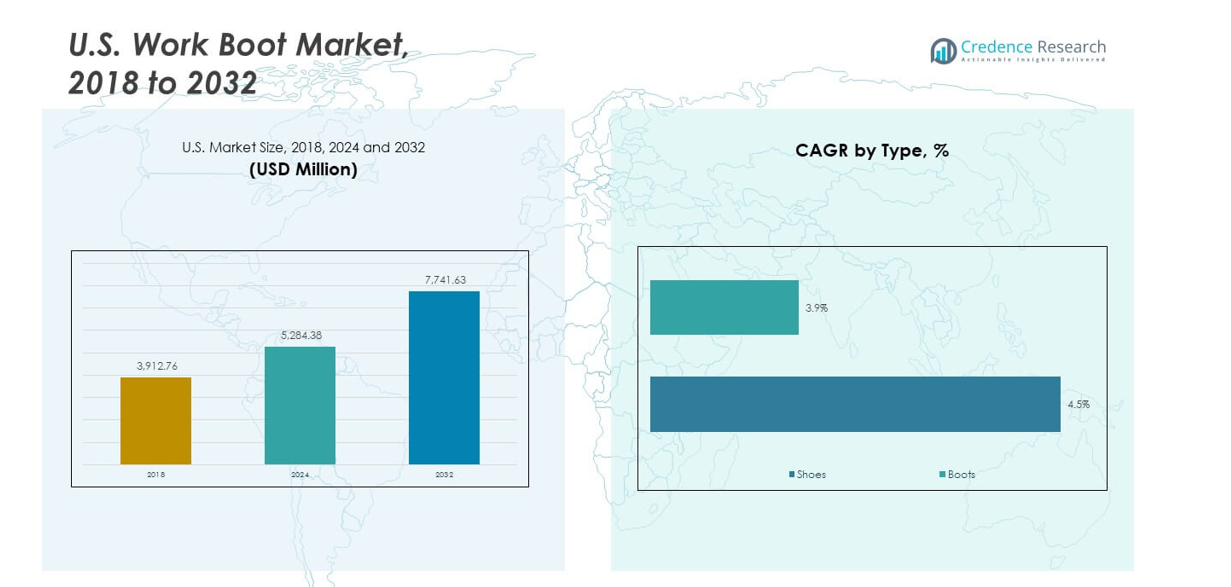
2.1.1. U.S. Work Boot Market, Volume (Units) & Revenue (USD Million) 2018 – 2032 23
2.2. Insights from Primary Respondents 23
CHAPTER NO. 3 : WORK BOOT MARKET – INDUSTRY ANALYSIS 24
3.1. Introduction 24
3.2. Market Drivers 25
3.2.1.1. Rising Workplace Safety Regulations 25
3.2.2. Increasing Construction and Industrial Activities 26
3.3. Market Restraints 27
3.3.1. Competition from Casual or Multi-purpose Footwear 27
3.4. Market Opportunities 28
3.4.1. Market Opportunity Analysis 28
3.5. Porter’s Five Forces Analysis 29
3.6. Value Chain Analysis 30
3.7. Buying Criteria 31
CHAPTER NO. 4 : PRICE ANALYSIS 32
4.1. Price Analysis by Type 32
4.1.1. U.S. Work Boot Market Price, By Type, 2018 – 2023 32
4.1.2. U.S. Type Market Price, By Type, 2018 – 2023 32
CHAPTER NO. 5 : ANALYSIS COMPETITIVE LANDSCAPE 33
5.1. Company Market Share Analysis – 2023 33
5.1.1. U.S. Work Boot Market: Company Market Share, by Revenue, 2023 33
5.1.2. U.S. Work Boot Market: Company Market Share, by Revenue, 2023 34
5.1.3. U.S. Work Boot Market: Top 6 Company Market Share, by Revenue, 2023 34
5.1.4. U.S. Work Boot Market: Top 3 Company Market Share, by Revenue, 2023 35
5.2. U.S. Work Boot Market Company Volume Market Share, 2023 36
5.3. U.S. Work Boot Market Company Revenue Market Share, 2023 37
5.4. Company Assessment Metrics, 2023 38
5.4.1. Stars 38
5.4.2. Emerging Leaders 38
5.4.3. Pervasive Players 38
5.4.4. Participants 38
5.5. Start-ups /Puncture-resistant Assessment Metrics, 2023 38
5.5.1. Progressive Companies 38
5.5.2. Responsive Companies 38
5.5.3. Dynamic Companies 38
5.5.4. Starting Blocks 38
5.6. Strategic Developments 39
5.6.1. Acquisitions & Mergers 39
New Product Launch 39
U.S. Expansion 39
5.7. Key Players Product Matrix 40
CHAPTER NO. 6 : PESTEL & ADJACENT MARKET ANALYSIS 41
6.1. PESTEL 41
6.1.1. Political Factors 41
6.1.2. Economic Factors 41
6.1.3. Social Factors 41
6.1.4. Technological Factors 41
6.1.5. Environmental Factors 41
6.1.6. Legal Factors 41
6.2. Adjacent Market Analysis 41
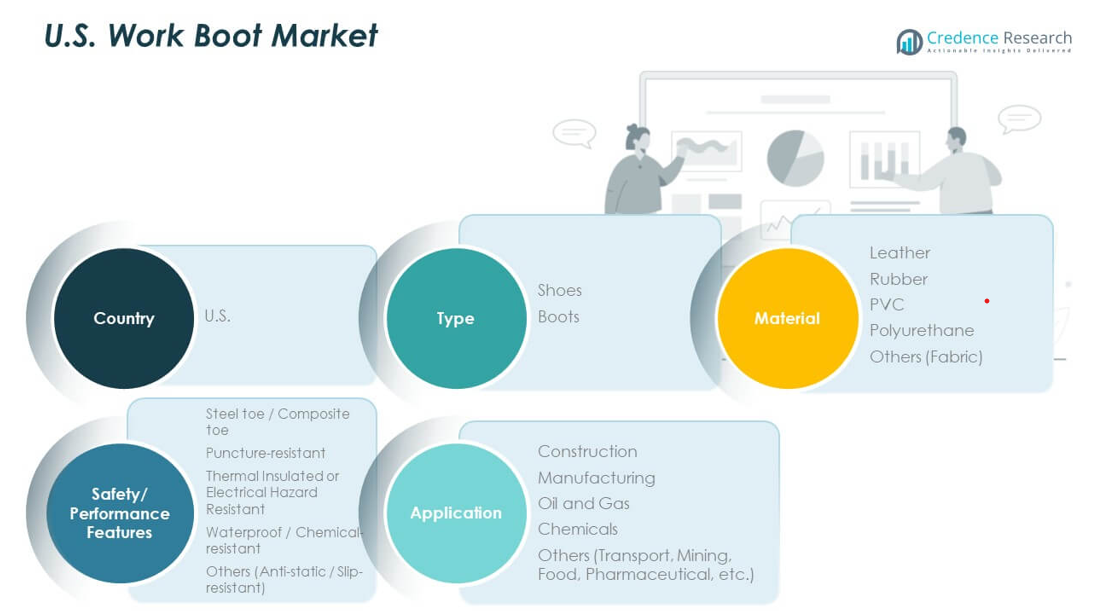
CHAPTER NO. 7 : WORK BOOT MARKET – BY TYPE SEGMENT ANALYSIS 42
7.1. Work Boot Market Overview, by Type Segment 42
7.1.1. Work Boot Market Revenue Share, By Type, 2023 & 2032 43
7.1.2. Work Boot Market Attractiveness Analysis, By Type 44
7.1.3. Incremental Revenue Growth Opportunity, by Type, 2024 – 2032 44
7.1.4. Work Boot Market Revenue, By Type, 2018, 2023, 2027 & 2032 45
7.2. Shoes 46
7.3. Boots 47
CHAPTER NO. 8 : WORK BOOT MARKET – BY MATERIAL SEGMENT ANALYSIS 48
8.1. Work Boot Market Overview, by Material Segment 48
8.1.1. Work Boot Market Revenue Share, By Material, 2023 & 2032 49
8.1.2. Work Boot Market Attractiveness Analysis, By Material 50
8.1.3. Incremental Revenue Growth Opportunity, by Material, 2024 – 2032 50
8.1.4. Work Boot Market Revenue, By Material, 2018, 2023, 2027 & 2032 51
8.2. Leather 52
8.3. Rubber 53
8.4. PVC 54
8.5. Polyurethane 55
8.6. Others (Fabric) 56
CHAPTER NO. 9 : WORK BOOT MARKET – BY SAFETY/PERFORMANCE FEATURES SEGMENT ANALYSIS 57
9.1. Work Boot Market Overview, by Safety/Performance Features Segment 57
9.1.1. Work Boot Market Revenue Share, By Safety/Performance Features, 2023 & 2032 58
9.1.2. Work Boot Market Attractiveness Analysis, By Safety/Performance Features 59
9.1.3. Incremental Revenue Growth Opportunity, by Safety/Performance Features, 2024 – 2032 59
9.1.4. Work Boot Market Revenue, By Safety/Performance Features, 2018, 2023, 2027 & 2032 60
9.2. Steel toe / Composite toe 61
9.3. Puncture-resistant 62
9.4. Thermal Insulated or Electrical Hazard Resistant 63
9.5. Waterproof / Chemical-resistant 64
9.6. Others (Anti-static / Slip-resistant) 65
CHAPTER NO. 10 : WORK BOOT MARKET – BY APPLICATION SEGMENT ANALYSIS 66
10.1. Work Boot Market Overview, by Application Segment 66
10.1.1. Work Boot Market Revenue Share, By Application, 2023 & 2032 67
10.1.2. Work Boot Market Attractiveness Analysis, By Application 68
10.1.3. Incremental Revenue Growth Opportunity, by Application, 2024 – 2032 68
10.1.4. Work Boot Market Revenue, By Application, 2018, 2023, 2027 & 2032 69
10.2. Construction 70
10.3. Manufacturing 71
10.4. Oil and Gas 72
10.5. Chemicals 73
10.6. Others (Transport, Mining, Food, Pharmaceutical, etc.) 74
CHAPTER NO. 11 : WORK BOOT MARKET – U.S. 75
11.1. U.S. 75
11.1.1. Key Highlights 75
11.1.2. U.S. Work Boot Market Volume, By Type, 2018 – 2023 (Units) 76
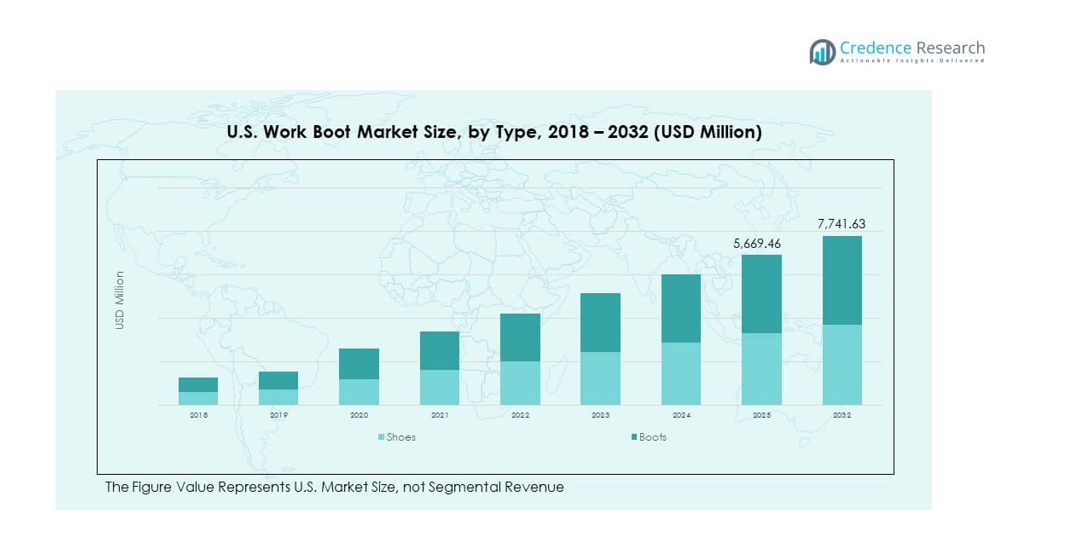
11.1.3. U.S. Work Boot Market Revenue, By Type, 2018 – 2023 (USD Million) 77
11.1.4. U.S. Work Boot Market Volume, By Material, 2018 – 2023 (Units) 78
11.1.5. U.S. Work Boot Market Revenue, By Material, 2018 – 2023 (USD Million) 79
11.1.6. U.S. Work Boot Market Volume, By Safety/Performance Features, 2018 – 2023 (Units) 80
11.1.7. U.S. Work Boot Market Revenue, By Safety/Performance Features, 2018 – 2023 (USD Million) 81
11.1.8. U.S. Work Boot Market Volume, By Application, 2018 – 2023 (Units) 82
11.1.9. U.S. Work Boot Market Revenue, By Application, 2018 – 2023 (USD Million) 83
CHAPTER NO. 12 : COMPANY PROFILES 84
12.1. Timberland 84
12.1.1. Company Overview 84
12.1.2. Product Portfolio 84
12.1.3. Swot Analysis 84
12.1.4. Business Strategy 85
12.1.5. Financial Overview 85
12.2. Black Diamond 86
12.3. Keen 86
12.4. Skechers 86
12.5. Red Wing Shoes 86
12.6. Company 6 86
12.7. Company 7 86
12.8. Company 8 86
12.9. Company 9 86
12.10. Company 10 86
12.11. Company 11 86
12.12. Company 12 86
12.13. Company 13 86
12.14. Company 14 86
List of Figures
FIG NO. 1. U.S. Work Boot Market, Volume (Units) & Revenue (USD Million) 2018 – 2032 23
FIG NO. 2. Porter’s Five Forces Analysis for U.S. Work Boot Market 29
FIG NO. 3. Value Chain Analysis for U.S. Work Boot Market 30
FIG NO. 4. U.S. Work Boot Market Price, By Type, 2018 – 2023 32
FIG NO. 5. Company Share Analysis, 2023 33
FIG NO. 6. Company Share Analysis, 2023 34
FIG NO. 7. Company Share Analysis, 2023 34
FIG NO. 8. Company Share Analysis, 2023 35
FIG NO. 9. Work Boot Market – Company Volume Market Share, 2023 36
FIG NO. 10. Work Boot Market – Company Revenue Market Share, 2023 37
FIG NO. 11. Work Boot Market Revenue Share, By Type, 2023 & 2032 43
FIG NO. 12. Market Attractiveness Analysis, By Type 44
FIG NO. 13. Incremental Revenue Growth Opportunity by Type, 2024 – 2032 44
FIG NO. 14. Work Boot Market Revenue, By Type, 2018, 2023, 2027 & 2032 45
FIG NO. 15. U.S. Work Boot Market for Shoes, Volume (Units) & Revenue (USD Million) 2018 – 2032 46
FIG NO. 16. U.S. Work Boot Market for Boots, Volume (Units) & Revenue (USD Million) 2018 – 2032 47
FIG NO. 17. Work Boot Market Revenue Share, By Material, 2023 & 2032 49
FIG NO. 18. Market Attractiveness Analysis, By Material 50
FIG NO. 19. Incremental Revenue Growth Opportunity by Material, 2024 – 2032 50
FIG NO. 20. Work Boot Market Revenue, By Material, 2018, 2023, 2027 & 2032 51
FIG NO. 21. U.S. Work Boot Market for Leather, Volume (Units) & Revenue (USD Million) 2018 – 2032 52
FIG NO. 22. U.S. Work Boot Market for Rubber, Volume (Units) & Revenue (USD Million) 2018 – 2032 53
FIG NO. 23. U.S. Work Boot Market for PVC, Volume (Units) & Revenue (USD Million) 2018 – 2032 54
FIG NO. 24. U.S. Work Boot Market for Polyurethane, Volume (Units) & Revenue (USD Million) 2018 – 2032 55
FIG NO. 25. U.S. Work Boot Market for Others (Fabric), Volume (Units) & Revenue (USD Million) 2018 – 2032 56
FIG NO. 26. Work Boot Market Revenue Share, By Safety/Performance Features, 2023 & 2032 58
FIG NO. 27. Market Attractiveness Analysis, By Safety/Performance Features 59
FIG NO. 28. Incremental Revenue Growth Opportunity by Safety/Performance Features, 2024 – 2032 59
FIG NO. 29. Work Boot Market Revenue, By Safety/Performance Features, 2018, 2023, 2027 & 2032 60
FIG NO. 30. U.S. Work Boot Market for Steel toe / Composite toe, Volume (Units) & Revenue (USD Million) 2018 – 2032 61
FIG NO. 31. U.S. Work Boot Market for Puncture-resistant, Volume (Units) & Revenue (USD Million) 2018 – 2032 62
FIG NO. 32. U.S. Work Boot Market for Thermal Insulated or Electrical Hazard Resistant, Volume (Units) & Revenue (USD Million) 2018 – 2032 63
FIG NO. 33. U.S. Work Boot Market for Waterproof / Chemical-resistant, Volume (Units) & Revenue (USD Million) 2018 – 2032 64
FIG NO. 34. U.S. Work Boot Market for Others (Anti-static / Slip-resistant), Volume (Units) & Revenue (USD Million) 2018 – 2032 65
FIG NO. 35. Work Boot Market Revenue Share, By Application, 2023 & 2032 67
FIG NO. 36. Market Attractiveness Analysis, By Application 68
FIG NO. 37. Incremental Revenue Growth Opportunity by Application, 2024 – 2032 68
FIG NO. 38. Work Boot Market Revenue, By Application, 2018, 2023, 2027 & 2032 69
FIG NO. 39. U.S. Work Boot Market for Construction, Volume (Units) & Revenue (USD Million) 2018 – 2032 70
FIG NO. 40. U.S. Work Boot Market for Manufacturing, Volume (Units) & Revenue (USD Million) 2018 – 2032 71
FIG NO. 41. U.S. Work Boot Market for Oil and Gas, Volume (Units) & Revenue (USD Million) 2018 – 2032 72
FIG NO. 42. U.S. Work Boot Market for Chemicals, Volume (Units) & Revenue (USD Million) 2018 – 2032 73
FIG NO. 43. U.S. Work Boot Market for Others (Transport, Mining, Food, Pharmaceutical, etc.), Volume (Units) & Revenue (USD Million) 2018 – 2032 74
FIG NO. 44. U.S. Work Boot Market Volume & Revenue, 2018 – 2032 (Units) (USD Million) 75
List of Tables
TABLE NO. 1. : U.S. Work Boot Market: Snapshot 21
TABLE NO. 2. : Drivers for the Work Boot Market: Impact Analysis 25
TABLE NO. 3. : Restraints for the Work Boot Market: Impact Analysis 27
TABLE NO. 4. : U.S. Work Boot Market Revenue, By Type, 2018 – 2023 32
TABLE NO. 5. : U.S. Work Boot Market Volume, By Type, 2018 – 2023 (Units) 76
TABLE NO. 6. : U.S. Work Boot Market Volume, By Type, 2024 – 2032 (Units) 76
TABLE NO. 7. : U.S. Work Boot Market Revenue, By Type, 2018 – 2023 (USD Million) 77
TABLE NO. 8. : U.S. Work Boot Market Revenue, By Type, 2024 – 2032 (USD Million) 77
TABLE NO. 9. : U.S. Work Boot Market Volume, By Material, 2018 – 2023 (Units) 78
TABLE NO. 10. : U.S. Work Boot Market Volume, By Material, 2024 – 2032 (Units) 78
TABLE NO. 11. : U.S. Work Boot Market Revenue, By Material, 2018 – 2023 (USD Million) 79
TABLE NO. 12. : U.S. Work Boot Market Revenue, By Material, 2024 – 2032 (USD Million) 79
TABLE NO. 13. : U.S. Work Boot Market Volume, By Safety/Performance Features, 2018 – 2023 (Units) 80
TABLE NO. 14. : U.S. Work Boot Market Volume, By Safety/Performance Features, 2024 – 2032 (Units) 80
TABLE NO. 15. : U.S. Work Boot Market Revenue, By Safety/Performance Features, 2018 – 2023 (USD Million) 81
TABLE NO. 16. : U.S. Work Boot Market Revenue, By Safety/Performance Features, 2024 – 2032 (USD Million) 81
TABLE NO. 17. : U.S. Work Boot Market Volume, By Application, 2018 – 2023 (Units) 82
TABLE NO. 18. : U.S. Work Boot Market Volume, By Application, 2024 – 2032 (Units) 82
TABLE NO. 19. : U.S. Work Boot Market Revenue, By Application, 2018 – 2023 (USD Million) 83
TABLE NO. 20. : U.S. Work Boot Market Revenue, By Application, 2024 – 2032 (USD Million) 83