
Market Overview
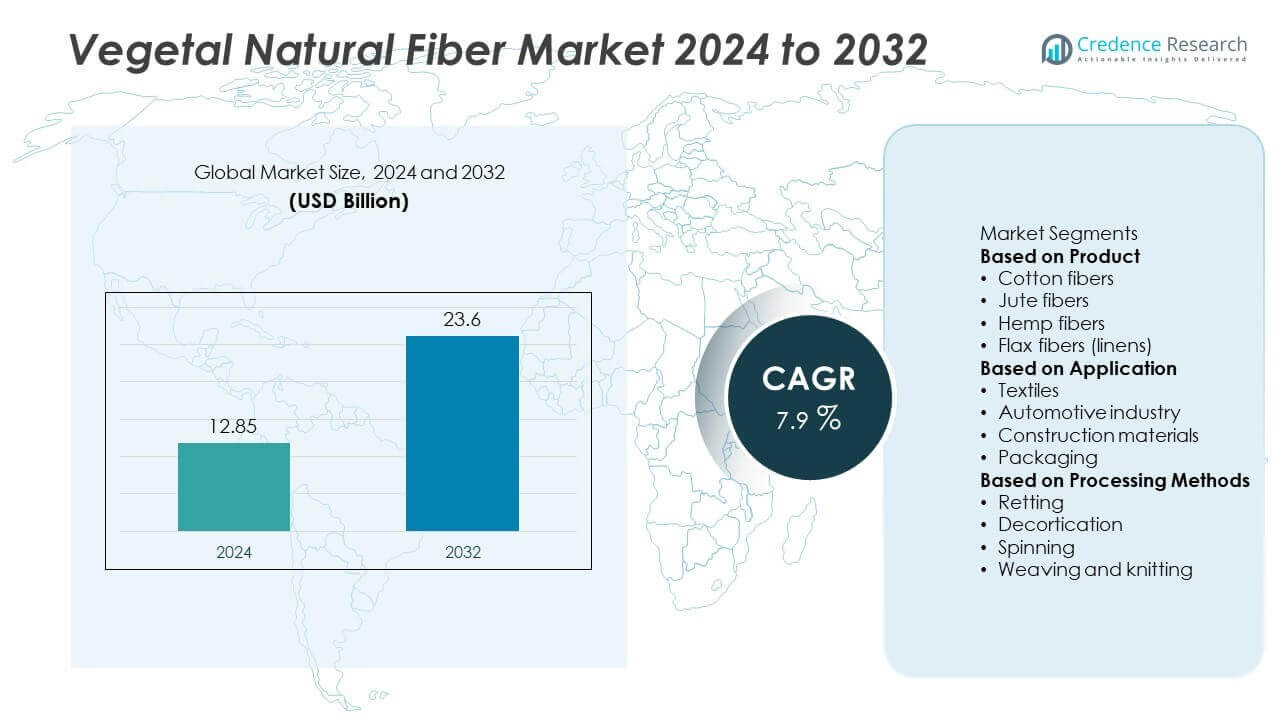
The vegetal natural fiber market was valued at USD 12.85 billion in 2024 and is projected to reach USD 23.6 billion by 2032, growing at a CAGR of 7.9% during the forecast period.
| REPORT ATTRIBUTE | DETAILS |
|---|---|
| Historical Period | 2020-2023 |
| Base Year | 2024 |
| Forecast Period | 2025-2032 |
| Vegetal Natural Fiber Market Size 2024 | USD 12.85 Billion |
| Vegetal Natural Fiber Market, CAGR | 7.9% |
| Vegetal Natural Fiber Market Size 2032 | USD 23.6 Billion |
The vegetal natural fiber market is led by major players including Shandong Ruyi Textile Group, Nufarm, Aditya Birla Group, Safilens, Golden Peacock Group, Lenzing, Shandong Jilin Chemical Fiber, Antex, Sateri Holdings, and Kelheim Fibres. These companies drive the market through large-scale production, innovation in fiber processing, and partnerships with textile and automotive sectors. Asia-Pacific dominated the market with 34% share in 2024, supported by strong cotton, jute, and hemp production and rising domestic consumption. North America followed with 27% share, driven by demand for sustainable textiles and composites, while Europe accounted for 26% share, supported by strict environmental regulations and adoption of organic and fair-trade fibers.
 Market Insights
- The vegetal natural fiber market was valued at USD 12.85 billion in 2024 and is projected to reach USD 23.6 billion by 2032, growing at a CAGR of 7.9% during the forecast period.
- Rising demand for eco-friendly and biodegradable materials in textiles, automotive interiors, and packaging is a major growth driver, supported by regulatory initiatives promoting sustainable alternatives to synthetic fibers.
- Key trends include the shift toward organic cotton cultivation, adoption of fair-trade certified fibers, and innovation in fiber blends and bio-composites for construction and automotive sectors.
- The market is competitive with players like Shandong Ruyi Textile Group, Lenzing, Aditya Birla Group, and Sateri Holdings focusing on capacity expansion, partnerships with apparel brands, and process innovations to strengthen global presence.
- Asia-Pacific led with 34% share, followed by North America at 27% and Europe at 26%; by product, cotton fibers dominated with 55% share, making them the largest contributor to global demand.
Market Segmentation Analysis:
By Product
Cotton fibers dominated the vegetal natural fiber market in 2024, holding over 55% share due to their versatility, softness, and widespread use in apparel and home textiles. Cotton’s high breathability and comfort make it the preferred choice for clothing, bed linens, and fashion accessories. Increasing demand for sustainable and biodegradable materials is further boosting cotton fiber consumption, particularly in developed markets emphasizing eco-friendly products. Jute, hemp, and flax fibers follow, serving applications in packaging, geotextiles, and industrial materials where strength, durability, and cost-effectiveness are key performance drivers.
- For instance, in February 2025, the Indian government announced a five-year 'Mission for Cotton Productivity' in its 2025–26 Union Budget to boost yields and promote extra-long staple (ELS) cotton. The initiative, which will provide scientific and technological support to farmers, follows years of declining production due to issues such as pink bollworm infestation, which developed resistance to older Bt cotton varieties.
By Application
Textiles accounted for the largest share, exceeding 50% of total demand in 2024, driven by rising apparel production and consumer preference for natural, sustainable fabrics. The fashion and home furnishing sectors lead consumption, as brands focus on organic cotton and ethically sourced fibers. Automotive applications are growing rapidly, with natural fibers being used in door panels, seat cushions, and dashboards to reduce vehicle weight and improve sustainability. Construction and packaging applications also contribute steadily, supported by the adoption of jute and hemp composites for ropes, mats, and eco-friendly packaging solutions.
- For instance, Toyota Boshoku, a Toyota Group company, developed a kenaf fiber-reinforced polyurethane foam composite in collaboration with Covestro, which was first integrated into the door trims of the "LQ" concept car in early 2020.
By Processing Methods
Spinning held the dominant share of 40% in 2024, as it is essential for transforming raw vegetal fibers into yarns used across textile and apparel manufacturing. Advancements in spinning technology have improved fiber strength, consistency, and processing efficiency, meeting the growing demand for high-quality yarns. Retting and decortication follow as critical steps for fiber extraction, particularly in jute and hemp production. Weaving and knitting processes are also expanding, driven by rising demand for premium fabrics and innovative textures. The growth of automated and energy-efficient processing techniques is supporting large-scale production and cost competitiveness.
Key Growth Drivers
Rising Demand for Sustainable Textiles
Growing consumer preference for eco-friendly and biodegradable fabrics is a major driver for vegetal natural fibers. Cotton, hemp, and flax are increasingly used in apparel and home textiles due to their low environmental footprint and renewability. Fashion brands are adopting organic and ethically sourced fibers to meet sustainability targets and appeal to conscious consumers. Global initiatives promoting circular fashion and reduced synthetic fiber use are further accelerating demand. This shift is particularly strong in Europe and North America, where green product certifications are becoming essential for textile producers.
- For instance, since at least 2017, Stella McCartney has partnered with Aquafil to produce sustainable fibers for its collections, using ECONYL regenerated nylon made from 100% waste. This helps reduce reliance on virgin synthetic fibers in luxury fashion lines, which are marketed primarily in Europe and North America.
Expansion of Automotive and Construction Applications
Vegetal natural fibers are gaining popularity in the automotive sector for lightweight composites that reduce vehicle weight and improve fuel efficiency. Door panels, dashboards, and insulation materials made from jute and hemp offer sustainability and cost benefits. In construction, natural fiber composites are being adopted for mats, ropes, boards, and reinforcement materials. Rapid infrastructure development in Asia-Pacific and increased focus on green building certifications are fueling demand. This expansion creates opportunities for fiber suppliers to target new end-use segments outside of traditional textiles.
- For instance, BMW has been actively exploring the use of natural fiber composites, including hemp, for various vehicle components, particularly interior paneling. BMW has stated its intention to transition these sustainable materials into future series production models.
Government Support and Eco-Regulations
Supportive government policies and strict regulations promoting renewable materials are boosting market growth. Subsidies for organic cotton cultivation, incentives for jute production, and bans on single-use plastics are pushing industries toward natural fiber-based solutions. Programs like India’s Jute Packaging Mandatory Order and Europe’s textile recycling directives are increasing fiber consumption in packaging and apparel. These regulatory measures are driving adoption across multiple sectors, encouraging producers to scale production and invest in advanced processing methods for better fiber quality and higher yields.
Key Trends & Opportunities
Innovation in Fiber Blends and Composites
Manufacturers are focusing on developing hybrid fiber blends combining cotton, hemp, and synthetic materials to enhance strength, moisture management, and comfort. Automotive and aerospace industries are exploring bio-composites for lightweight structural components, creating new growth avenues. Textile producers are also investing in high-performance yarns for sportswear and technical applications. These innovations are expanding the use of vegetal fibers beyond traditional clothing and supporting their entry into high-value markets where durability and functionality are critical.
- For instance, in May 2025, researchers at the University of Zagreb developed a cottonized hemp processing technology that converts hemp by-products into short, soft fibers compatible with conventional cotton spinning equipment. This enabled scalable blending of treated hemp and cotton for mainstream textile applications, producing blended yarns that meet commercial strength and processing standards without new machinery investments.
Shift Toward Organic and Fair-Trade Production
Organic cultivation of cotton and hemp is gaining traction, driven by consumer demand for pesticide-free and ethically sourced materials. Fair-trade initiatives ensure better pricing for farmers, improving supply chain sustainability. Brands are highlighting certifications such as GOTS and OEKO-TEX to attract eco-conscious buyers. This trend is particularly prominent in premium apparel and home textiles, where customers are willing to pay a premium for sustainable and socially responsible products. The movement is creating long-term opportunities for suppliers focusing on certified fiber production.
- For instance, the Global Organic Textile Standard (GOTS) 2024 Annual Report documented a 5.2% growth in certified facilities, reaching 15,441 worldwide, and highlighted initiatives like an AI-powered satellite project to improve organic cotton traceability in India.
Key Challenges
Fluctuating Raw Material Yields
Variability in crop yields due to climate change, pests, and rainfall patterns poses a major challenge. Cotton and jute production are highly dependent on favorable weather conditions, which can affect global supply and pricing. Shortages can lead to cost spikes, impacting manufacturers relying on stable input costs. This volatility forces companies to diversify sourcing regions and explore controlled cultivation practices, such as drip irrigation and organic farming, to mitigate risks and maintain a consistent supply chain.
Competition from Synthetic Alternatives Synthetic fibers like polyester and nylon continue to dominate global markets due to their lower cost, higher durability, and ease of processing. Despite growing awareness about microplastic pollution, many industries still favor synthetics for mass production. Vegetal natural fibers must compete on price and performance, which can be challenging when processing costs and labor requirements are high. Manufacturers are investing in automation and efficiency improvements to close the cost gap and strengthen competitiveness against synthetic materials.
Regional Analysis
North America
North America held 27% share of the vegetal natural fiber market in 2024, driven by rising demand for sustainable textiles and eco-friendly packaging materials. The U.S. leads consumption due to strong apparel manufacturing, home furnishing demand, and adoption of natural fiber composites in automotive interiors. Government support for organic cotton production and growing awareness about reducing synthetic fiber pollution further support market growth. Canada also contributes with its increasing focus on green building materials using jute and hemp. Continuous innovation in premium fiber-based apparel and rising use in technical applications sustain strong growth in the region.
Europe
Europe accounted for 26% share in 2024, supported by strict environmental regulations and a strong shift toward circular fashion. Germany, France, and the UK are leading consumers, driven by demand for organic cotton, flax linen, and hemp textiles. EU initiatives under the Green Deal and textile recycling directives encourage the adoption of natural fibers across apparel and home furnishing sectors. Automotive OEMs in Germany are integrating natural fiber composites for weight reduction and sustainability. Consumer preference for fair-trade and certified fibers, coupled with growth in luxury fashion, strengthens Europe’s position as a key market for premium vegetal fibers.
Asia-Pacific
Asia-Pacific dominated the global market with 34% share in 2024, driven by large-scale cotton, jute, and hemp production and rising consumption in textiles and packaging. China and India are major contributors, supplying a significant share of global cotton and jute exports. Expanding textile manufacturing hubs, coupled with rapid population growth, are boosting domestic consumption. Increasing adoption of natural fiber composites in construction and automotive sectors is further fueling demand. Government-backed initiatives such as India’s Jute Packaging Mandatory Order and incentives for organic cotton cultivation are accelerating regional growth, positioning Asia-Pacific as the fastest-growing market globally.
Latin America
Latin America captured 8% share of the market in 2024, led by Brazil, which is a significant producer of cotton and sisal fibers. Growing demand for natural fiber textiles and packaging solutions is driven by rising awareness of sustainability and regulatory encouragement. Mexico also contributes with expanding automotive production that uses jute and hemp composites for lightweight interior components. The region is witnessing increased investment in modernizing fiber processing facilities to improve export quality and competitiveness. Economic growth and increasing demand for home textiles and apparel are expected to sustain steady market expansion over the forecast period.
Middle East & Africa
The Middle East & Africa region accounted for 5% share in 2024, supported by rising demand for jute and cotton-based textiles and ropes for construction and packaging applications. GCC countries are driving consumption through infrastructure projects requiring eco-friendly construction materials. Africa, particularly Egypt and Kenya, is witnessing increased cotton cultivation and textile exports, supporting the regional supply chain. However, limited processing capacity and dependence on imports for high-quality fabrics pose challenges. Growing interest in sustainable materials and government focus on expanding local textile industries are expected to strengthen market growth in coming years.
Market Segmentations:
By Product
- Cotton fibers
- Jute fibers
- Hemp fibers
- Flax fibers (linens)
By Application
- Textiles
- Automotive industry
- Construction materials
- Packaging
By Processing Methods
- Retting
- Decortication
- Spinning
- Weaving and knitting
By Geography
- North America
- U.S.
- Canada
- Mexico
- Europe
- Germany
- France
- U.K.
- Italy
- Spain
- Rest of Europe
- Asia Pacific
- China
- Japan
- India
- South Korea
- South-east Asia
- Rest of Asia Pacific
- Latin America
- Brazil
- Argentina
- Rest of Latin America
- Middle East & Africa
- GCC Countries
- South Africa
- Rest of the Middle East and Africa
Competitive Landscape
The competitive landscape of the vegetal natural fiber market is shaped by key players such as Shandong Ruyi Textile Group, Nufarm, Aditya Birla Group, Safilens, Golden Peacock Group, Lenzing, Shandong Jilin Chemical Fiber, Antex, Sateri Holdings, and Kelheim Fibres. These companies focus on expanding production capacity, investing in sustainable cultivation practices, and developing innovative fiber blends to meet growing demand for eco-friendly materials. Strategic partnerships with apparel brands and automotive manufacturers help strengthen supply chains and ensure consistent quality. Leading players are also emphasizing certifications such as GOTS and OEKO-TEX to enhance market credibility and attract environmentally conscious buyers. Mergers, acquisitions, and collaborations are common strategies used to gain access to new markets, particularly in Asia-Pacific where textile manufacturing is concentrated. Continuous innovation in processing technology and digitalization of production remain central to staying competitive and maintaining leadership in this rapidly evolving market.
Key Player Analysis
- Shandong Ruyi Textile Group
- Nufarm
- Aditya Birla Group
- Safilens
- Golden Peacock Group
- Lenzing
- Shandong Jilin Chemical Fiber
- Antex
- Sateri Holdings
- Kelheim Fibres
Recent Developments
- In July 2025, Aditya Birla Group (Grasim) launched Raysileco, a sustainable, traceable cellulosic filament yarn.
- In July 2025, Lenzing introduced VEOCEL Lyocell fibres for Enhanced Cleaning in nonwovens applications.
- In May 2025, Jilin Chemical Fiber expanded two “Next Gen” man-made cellulosic fibre production lines.
- In January 2025, Kelheim Fibres published its Sustainability Report with an EMAS environmental statement.
Report Coverage
The research report offers an in-depth analysis based on Product, Application, Processing Methods and Geography. It details leading market players, providing an overview of their business, product offerings, investments, revenue streams, and key applications. Additionally, the report includes insights into the competitive environment, SWOT analysis, current market trends, as well as the primary drivers and constraints. Furthermore, it discusses various factors that have driven market expansion in recent years. The report also explores market dynamics, regulatory scenarios, and technological advancements that are shaping the industry. It assesses the impact of external factors and global economic changes on market growth. Lastly, it provides strategic recommendations for new entrants and established companies to navigate the complexities of the market.
Future Outlook
- Demand for vegetal natural fibers will rise with growing preference for sustainable and biodegradable materials.
- Cotton will remain the dominant product segment supported by high use in apparel and home textiles.
- Hemp and jute will gain traction as eco-friendly alternatives for composites and packaging applications.
- Asia-Pacific will continue leading growth due to strong production capacity and expanding textile manufacturing hubs.
- Europe will see increased adoption driven by circular fashion initiatives and strict environmental regulations.
- Automotive and construction sectors will boost consumption of fiber-based composites for lightweight and durable solutions.
- Investments in organic cultivation and fair-trade certifications will strengthen supply chain transparency.
- Technological innovations in spinning, weaving, and fiber treatment will improve quality and efficiency.
- Strategic collaborations between fiber producers and apparel brands will support premium product launches.
- Rising consumer awareness about microplastic pollution will accelerate the shift from synthetic fibers.

Request a Free Sample
Fill in your details and we'll send you a free sample report.
- Sample data tables & charts
- Research methodology
Need a Custom Version of This Report?
Tailor the scope, geography, or segments to your exact requirements.
- Custom geography or segment scope
- Direct access to our analyst team
Frequently Asked Questions
What is the current market size for Vegetal Natural Fiber market, and what is its projected size in 2032?
At what Compound Annual Growth Rate is the Vegetal Natural Fiber market projected to grow between 2025 and 2032?
Which Vegetal Natural Fiber market segment held the largest share in 2024?
What are the primary factors fueling the growth of the Vegetal Natural Fiber market?
Who are the leading companies in the Vegetal Natural Fiber market?
Which region commanded the largest share of the Vegetal Natural Fiber market in 2024?
Table of Content
Chapter 1. Report Introduction
- 1.1 Report Description & Purpose
- 1.1.1 Report Title & Market Definition
- 1.1.2 Unique Selling Propositions (USP) & Key Differentiators
- 1.1.3 Value Proposition for Stakeholders
- 1.2 Research Objectives
- 1.2.1 Market Sizing Objectives (Volume & Revenue) (Volume Where Applicable)
- 1.2.2 Segmentation Objectives
- 1.2.3 Competitive Intelligence Objectives
- 1.2.4 Forecast & Scenario Objectives
- 1.3 Report Scope
- 1.3.1 Vegetal Natural Fiber Scope – Segments & Subsegments Covered
- 1.3.2 Geographic Scope – Regions & Countries Covered
- 1.3.3 Historical Period, Base Year & Forecast Period (2024; forecast to 2032)
- 1.3.4 Inclusions & Exclusions
- 1.4 Industry Classification & Applicable Codes
- 1.5 Currency, Measurement Units & Valuation Basis
- 1.6 Target Stakeholders
- 1.7 Limitations & Assumptions
Chapter 2. Executive Summary
- 2.1 Global Vegetal Natural Fiber Market Snapshot
- 2.1.1 Market Size – Historical (2024) & Forecast (2024-2032) (2024: USD 12.85 billion → 2032: USD 23.6 billion)
- 2.1.2 Volume & Revenue – Global Totals (Volume Where Applicable)
- 2.1.3 Key Market Highlights – Top Five Facts
- 2.2 Vegetal Natural Fiber Market Segmentation Snapshot
- 2.2.1 Market Split by Region – 2024 vs. 2032
- 2.3 Competitive Snapshot
- 2.3.1 Top 10 Players by Revenue Share – 2024
- 2.3.2 Top 10 Players by Volume Share – 2024 (Volume Where Applicable)
- 2.3.3 Recent Strategic Developments (18-Month Summary)
- 2.4 Key Investment Highlights & Strategic Conclusions
Chapter 3. Vegetal Natural Fiber Market Dynamics & Industry Analysis
- 3.1 Market Overview & Context
- 3.1.1 Vegetal Natural Fiber Market Position in the Broader Industry Value Chain
- 3.1.2 Demand Structure & Purchasing Dynamics
- 3.1.3 Market Maturity & Development Stage by Region
- 3.2 Vegetal Natural Fiber Market Drivers
- 3.3 Vegetal Natural Fiber Market Restraints & Challenges
- 3.4 Vegetal Natural Fiber Market Opportunities
- 3.5 Porter's Five Forces Analysis
- 3.5.1 Threat of New Entrants
- 3.5.2 Bargaining Power of Suppliers
- 3.5.3 Bargaining Power of Buyers
- 3.5.4 Threat of Substitutes
- 3.5.5 Competitive Rivalry – Intensity Assessment
- 3.6 Vegetal Natural Fiber Value Chain Analysis
- 3.6.1 Upstream – Key Inputs, Resources & Suppliers
- 3.6.1.1 Key Input/Resource 1
- 3.6.1.2 Key Input/Resource 2
- 3.6.1.3 Key Input/Resource 3
- 3.6.2 Midstream – Core Operations & Value Creation
- 3.6.2.1 Operating Model & Process Overview
- 3.6.2.2 Key Operating Locations & Capabilities by Company
- 3.6.3 Downstream – Market Channels & End Users
- 3.6.3.1 Direct Sales & Customer Engagement Channels
- 3.6.3.2 Indirect Sales, Intermediaries & Partner Channels
- 3.6.4 Value Chain Profitability Analysis
- 3.6.1 Upstream – Key Inputs, Resources & Suppliers
- 3.7 PESTEL Analysis
- 3.7.1 Political Factors
- 3.7.2 Economic Factors
- 3.7.3 Social Factors
- 3.7.4 Technological Factors
- 3.7.5 Environmental Factors
- 3.7.6 Legal Factors
- 3.8 Vegetal Natural Fiber Supply Chain Analysis
- 3.8.1 Critical Input & Resource Availability Risk Assessment
- 3.8.2 Supplier & Operational Concentration Risk (Geographic Exposure)
- 3.8.3 Supply & Service Disruption Impact Analysis
- 3.9 Regulatory & Policy Landscape
Note: The regulatory and policy landscape section covers regulations based on their applicability to the market, Vegetal Natural Fiber category, geography, and scope of the study. Only regulatory frameworks with a material impact on operations, compliance, trade, sustainability, or market access are analyzed in detail.
Chapter 4. Key Investment Pockets & Opportunity Analysis
- 4.1 Vegetal Natural Fiber Market Attractiveness Analysis
- 4.1.1 By Region – Investment Attractiveness Matrix (Market Size × CAGR)
- 4.2 Absolute Revenue Growth Opportunity
- 4.2.1 By Region – Absolute Revenue Growth Through 2032
- 4.3 Incremental Demand Opportunity
- 4.3.1 By Region – Incremental Demand Through 2032
- 4.3.2 Segment – Incremental Demand
- 4.4 Emerging Submarket Opportunity Deep Dive (Subject to Applicability)
- 4.5 Priority Market Opportunity Scorecards
- 4.5.1 United States
- 4.5.2 Europe
- 4.5.3 Asia
- 4.5.4 Middle East & Africa
Note: Priority market opportunity scorecards reflect the geographic scope and strategic relevance of the study. Listed markets are indicative and may be adapted to the industry.
Chapter 5. Vegetal Natural Fiber Cross-Border Trade & Market Access Analysis
- 5.1 International Trade & Cross-Border Activity Overview
- 5.1.1 Global Export Value by Country (2024)
- 5.1.2 Global Export Volume by Country (2024) (Volume Where Applicable)
- 5.1.3 Global Import Value by Country (2024)
- 5.1.4 Global Import Volume by Country (2024) (Volume Where Applicable)
- 5.1.5 Net Trade Balance by Country (2024)
- 5.2 Export Analysis – Segment
- 5.2.1 Category 1 (Applicable Classification Code)
- 5.2.2 Category 2 (Applicable Classification Code)
- 5.2.3 Category 3 (Applicable Classification Code)
- 5.2.4 Category 4 (Applicable Classification Code)
- 5.2.5 Category 5 (Applicable Classification Code)
- 5.3 Import Analysis – Segment
- 5.3.1 Category 1 (Applicable Classification Code)
- 5.3.2 Category 2 (Applicable Classification Code)
- 5.3.3 Category 3 (Applicable Classification Code)
- 5.3.4 Category 4 (Applicable Classification Code)
- 5.3.5 Category 5 (Applicable Classification Code)
- 5.4 Cross-Border Pricing & Transaction Benchmarks
- 5.4.1 Export Pricing – Segment & Country
- 5.4.2 Import Pricing – Segment & Source Country
- 5.4.3 Price Trends (2024)
- 5.5 Key Cross-Border Trade & Delivery Routes
- 5.5.1 Cross-Border Trade/Delivery Route 1
- 5.5.2 Cross-Border Trade/Delivery Route 2
- 5.5.3 Cross-Border Trade/Delivery Route 3
- 5.5.4 Cross-Border Trade/Delivery Route 4
- 5.5.5 Cross-Border Trade/Delivery Route 5
- 5.6 Trade Policy & Market Access Impact Assessment
- 5.6.1 Tariff & Non-Tariff Barriers
- 5.6.2 Regional Trade & Economic Integration Frameworks
- 5.6.3 Bilateral & Multilateral Trade Agreements
- 5.6.4 Cross-Border Operating, Licensing & Localization Requirements
Note: This chapter applies where cross-border trade or delivery is relevant to Vegetal Natural Fiber. Goods, services, and digital offerings are assessed using applicable classifications and transaction measures. Import-export volumes, trade balances, and route analyses are included only where meaningful to the market.
Chapter 6. Competitive Landscape & Company Benchmarking
- 6.1 Vegetal Natural Fiber Market Concentration & Structure
- 6.1.1 Herfindahl-Hirschman Index (HHI) – vs. 2024
- 6.1.2 Leading, Mid-Sized & Emerging Player Structure
- 6.1.3 Global, Regional & Local Player Dynamics
- 6.2 Vegetal Natural Fiber Market Share Analysis – 2024
- 6.2.1 Global Revenue Share by Company
- 6.2.2 Global Volume Share by Company (Volume Where Applicable)
- 6.2.3 Regional Revenue Share
- 6.2.4 Market Share Evolution ( vs. 2024)
- 6.2.5 Company Market Share by Key Segment
- 6.2.6 Company Market Share by Customer Group
- 6.3 Operating Scale, Capacity & Infrastructure Analysis
- 6.3.1 Global Operating Scale & Supply Capacity
- 6.3.2 Resource Utilization & Operating Efficiency
- 6.3.3 Output, Service Delivery & Activity Metrics
- 6.3.4 Operating Footprint & Infrastructure Map
- 6.3.5 Planned Operational & Capacity Expansion
- 6.4 Vegetal Natural Fiber Competitive Benchmarking Matrix
- 6.4.1 Revenue, Growth, Profitability & Operating Metric Comparison
- 6.4.2 Channel Revenue Mix
- 6.4.3 Geographic Revenue Exposure
- 6.4.4 R&D Intensity
- 6.4.5 Sustainability Maturity
- 6.5 Strategic Developments in Vegetal Natural Fiber (Last 24 Months)
- 6.5.1 Mergers, Acquisitions & Divestments
- 6.5.2 New Products, Services & Solutions in Vegetal Natural Fiber
- 6.5.3 Operational & Infrastructure Expansions
- 6.5.4 Strategic Alliances, Joint Ventures & Partnerships
- 6.5.5 Distribution Expansion & Market Entry
- 6.5.6 Sustainability & ESG Initiatives
- 6.6 Competitive Strategy Mapping
- 6.6.1 Leader, Challenger, Follower & Niche Classification
- 6.6.2 Pricing Strategy Comparison
- 6.6.3 Channel Strategy Matrix
Note: Strategic developments are included based on their materiality and the availability of reliable information.
Chapter 7. Global Vegetal Natural Fiber Market – By Sales & Delivery Channel
- 7.1 Segment Overview
- 7.1.1 Volume & Revenue Split by Channel (2024 & 2032) (Volume Where Applicable)
- 7.1.2 Channel Mix Evolution (2024-2032)
Chapter 8. Regional Market Analysis – Global Overview
- 8.1 Global Regional Overview
- 8.1.1 Regional Volume Share (Volume Where Applicable)
- 8.1.2 Regional Revenue Share
- 8.1.3 Regional Volume by Region (Volume Where Applicable)
- 8.1.4 Regional Revenue by Region
- 8.1.5 Regional Forecast Through 2032
- 8.2 Cross-Regional Segment Analysis
- 8.2.1 By Sales & Delivery Channel
- 8.2.2 By Competitive Positioning & Price Tier
Chapter 9. North America Vegetal Natural Fiber Market
- 9.1 United States
- 9.2 Canada
- 9.3 Mexico
Chapter 10. Europe Vegetal Natural Fiber Market
- 10.1 Germany
- 10.2 France
- 10.3 Italy
- 10.4 United Kingdom
- 10.5 Spain
- 10.6 Poland
- 10.7 Russia
- 10.8 Netherlands
- 10.9 Belgium
- 10.10 Sweden
- 10.11 Denmark
- 10.12 Norway
- 10.13 Rest of Europe
Chapter 11. Asia Pacific Vegetal Natural Fiber Market
- 11.1 China
- 11.2 India
- 11.3 Japan
- 11.4 South Korea
- 11.5 Thailand
- 11.6 Indonesia
- 11.7 Vietnam
- 11.8 Malaysia
- 11.9 Australia
- 11.10 Rest of Asia Pacific
Chapter 12. Latin America Vegetal Natural Fiber Market
- 12.1 Brazil
- 12.2 Argentina
- 12.3 Colombia
- 12.4 Chile
- 12.5 Rest of Latin America
Chapter 13. Middle East Vegetal Natural Fiber Market
- 13.1 Saudi Arabia
- 13.2 United Arab Emirates
- 13.3 Turkey
- 13.4 Israel
- 13.5 Iran
- 13.6 Rest of the Middle East
Chapter 14. Africa Vegetal Natural Fiber Market
- 14.1 South Africa
- 14.2 Egypt
- 14.3 Nigeria
- 14.4 Morocco
- 14.5 Rest of Africa
Chapter 15. Vegetal Natural Fiber Company Profiles
- 15.1 [Company 01]
- 15.1.1 Company Overview
- 15.1.2 Key Management Personnel
- 15.1.3 Products & Services Portfolio
- 15.1.4 Financial Performance
- 15.1.5 Key Market Focus & Geographic Presence
- 15.1.6 Recent Developments & Strategic Initiatives
Note: The company profile list is preliminary and may change based on research findings, market developments, data availability, and client requirements.
Chapter 16. Appendices
- Appendix A – List of Abbreviations & Acronyms
- Appendix B – Industry Classification Code Reference – Full Series
- Appendix C – Supply, Output & Operating Capacity Data Tables
- Appendix D – End-Use & Demand Base Tables
- Appendix E – Demand, Adoption & Usage Assumptions
- Appendix F – Pricing & Revenue Metric Reference Tables
- Appendix G – Company Operations & Infrastructure Database
- Appendix H – Cross-Border Trade & Activity Data Tables (Where Applicable)
- Appendix I – Regulatory Summary Tables
- Appendix J – Primary Research Participant List (Anonymized)
- Appendix K – Primary Research Questionnaire Framework
- Appendix L – Data Sources & Bibliography
- Appendix M – Market Size Divergence & Source Comparison
Chapter 17. Research Methodology
- 17.1 Research Framework & Philosophy
- 17.2 Secondary Research – Sources, Hierarchy & Data Extraction
- 17.3 Data Modeling – Bottom-Up & Top-Down Market Sizing
- 17.4 Primary Research – Stakeholder Framework, LOI & Sample Sizes
- 17.5 Forecast Methodology – Regression, Scenario & Sensitivity Analysis
- 17.6 Quality Control – Four-Layer Validation Framework
- 17.7 Limitations & Standard Assumptions
- 17.8 Disclaimer
