Market Overview
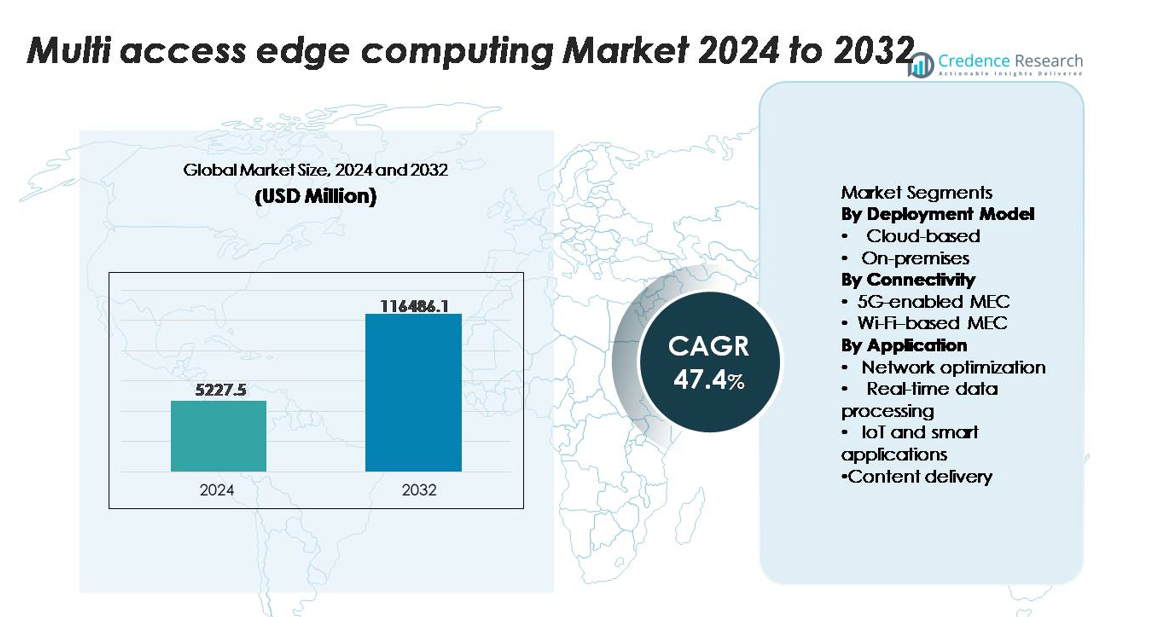
The Multi-Access Edge Computing (MEC) Market was valued at USD 5,227.5 million in 2024 and is projected to reach USD 116,486.1 million by 2032, expanding at a CAGR of 47.4% during the forecast period.
| REPORT ATTRIBUTE |
DETAILS |
| Historical Period |
2020-2023 |
| Base Year |
2024 |
| Forecast Period |
2025-2032 |
| Multi Access Edge Computing Market Size 2024 |
USD 5,227.5 million |
| Multi Access Edge Computing Market, CAGR |
47.4% |
| Multi Access Edge Computing Market Size 2032 |
USD 116,486.1 million |
The Multi-Access Edge Computing (MEC) market is led by major technology and network innovators including AWS, Microsoft Azure, Google Cloud, Huawei, Nokia, Ericsson, Cisco, IBM, and VMware, each expanding edge-native platforms, distributed cloud zones, and 5G-integrated MEC solutions. These companies compete on low-latency processing, orchestration automation, and ecosystem partnerships with telecom operators and industrial enterprises. North America remains the leading region with an exact market share of 38% in 2024, driven by early 5G standalone deployments and strong hyperscaler presence. Asia-Pacific follows with 30%, supported by large-scale 5G rollouts, industrial digitalization, and high adoption of AI-at-the-edge across manufacturing, mobility, and smart infrastructure.
Market Insights
- The Multi-Access Edge Computing (MEC) market was valued at USD 5,227.5 million in 2024 and is projected to reach USD 116,486.1 million by 2032, registering a 47.4% CAGR during the forecast period.
- The market expands as enterprises adopt MEC for ultra-low-latency processing, real-time analytics, and AI-at-the-edge, with cloud-based deployment holding 62% share due to strong integration with hyperscaler edge zones and scalable distributed architectures.
- Key trends include rapid 5G standalone rollout, rising private network deployments, and the shift toward distributed cloud ecosystems, with 5G-enabled MEC accounting for 71% share in 2024 as industries accelerate automation and intelligent operations.
- Competitive activity intensifies as AWS, Microsoft, Google, Nokia, Ericsson, Cisco, and Huawei strengthen edge portfolios, though market restraints persist due to integration complexity, multi-layer orchestration challenges, and expanding security vulnerabilities across distributed nodes.
- Regionally, North America leads with 38% share, followed by Asia-Pacific at 30% and Europe at 27%, supported by industrial digitalization, large-scale IoT adoption, and strong telecom–cloud ecosystem collaboration.
Access crucial information at unmatched prices!
Request your sample report today & start making informed decisions powered by Credence Research Inc.!
Download Sample
Market Segmentation Analysis:
By Deployment Model
Cloud-based MEC held the dominant position with approximately 62% market share in 2024, driven by rapid adoption of cloud-native architectures, elastic scaling requirements, and integration with hyperscaler edge zones offered by providers such as AWS Wavelength, Azure Edge Zones, and Google Distributed Cloud Edge. Enterprises adopting distributed workloads prefer cloud deployments due to lower upfront infrastructure costs, automated lifecycle management, and seamless orchestration across multiple edge locations. Meanwhile, on-premises MEC continues to gain traction in regulated sectors requiring data residency, deterministic latency, and enhanced security, particularly in industrial automation and mission-critical private networks.
- For instance, AWS Wavelength Zones deployed with Verizon deliver end-to-end latencies typically under 10 milliseconds, while Azure Edge Zones can run AKS clusters on Azure Stack Edge Pro devices equipped with NVIDIA T4 GPUs delivering up to 65 tera-operations per second for real-time inference workloads.
By Connectivity
5G-enabled MEC emerged as the leading connectivity segment, accounting for around 71% market share in 2024, supported by the commercialization of standalone 5G core networks and the growing deployment of private 5G systems in manufacturing, logistics, and energy sectors. 5G’s ultra-low latency, network slicing capabilities, and massive device density enhance performance for advanced edge workloads. Wi-Fi–based MEC, while cost-efficient and widely deployed in enterprise campuses, remains secondary in high-mobility and mission-critical environments. Its adoption is strongest in indoor deployments, retail, education, and hospitality, where capacity and coverage demands align with Wi-Fi 6/6E capabilities.
- For instance, Nokia’s AirScale 5G SA network platform supports device densities up to 1,000,000 connections per square kilometer and delivers sub-5-millisecond latency in MEC-integrated deployments, enabling deterministic performance for industrial automation.
By Application
IoT and smart applications represented the dominant use-case category with approximately 38% market share in 2024, as industries accelerated adoption of edge-enabled automation, AI-driven monitoring, and sensor-rich operational systems. This segment benefits from MEC’s ability to process data locally, reduce cloud backhaul, and support mission-critical responsiveness in factories, smart cities, utilities, and connected healthcare. Real-time data processing and network optimization also show strong growth, fueled by traffic offloading and latency-sensitive analytics. Content delivery gains traction in AR/VR, cloud gaming, and video streaming, where MEC reduces jitter and improves quality-of-experience.
Key Growth Drivers
Surge in Ultra-Low-Latency and Real-Time Computing Requirements
The rapid growth of latency-sensitive applications—such as autonomous robotics, industrial automation, smart mobility platforms, and AR/VR ecosystems—is a primary catalyst for MEC adoption. Enterprises increasingly require sub-10-millisecond responsiveness to support synchronous machine operations, predictive maintenance, and remote-control functions that cannot rely on distant cloud servers. MEC places compute resources closer to data sources, significantly reducing round-trip delays and enabling uninterrupted performance for mission-critical environments. The expansion of private networks in manufacturing, energy, healthcare, and logistics amplifies this demand, as local processing becomes essential for safety-critical decision loops. Additionally, high-frequency data streams from advanced sensors and computer-vision systems intensify the need for distributed compute nodes capable of real-time analytics. As organizations modernize their digital infrastructure, MEC emerges as the foundational layer enabling deterministic performance, operational continuity, and reliable edge intelligence.
- For instance, NVIDIA’s Jetson AGX Orin edge module delivers up to 275 trillion operations per second (TOPS), allowing on-device inference for robotics, vision analytics, and autonomous navigation with latency often below 5 milliseconds, enabling MEC platforms to execute complex AI workloads at the network edge.
Expansion of 5G Standalone Networks and Private Enterprise Connectivity
The deployment of 5G standalone (SA) architecture and enterprise-grade private networks is accelerating MEC integration across industries. 5G SA unlocks native capabilities such as network slicing, uplink prioritization, and ultra-reliable low-latency communication, which align directly with MEC’s distributed compute model. Enterprises in sectors such as advanced manufacturing, mining, ports, utilities, and transportation are investing in private 5G to support automation, digital twins, and connected workforce systems. MEC enhances these networks by providing localized computing for data-heavy workloads, ensuring secure, on-premises data processing and minimizing dependency on public cloud routes. Mobile operators and infrastructure vendors are integrating MEC into 5G edge nodes, enabling unified service orchestration and rapid deployment of enterprise use cases. The synergy between 5G and MEC continues to reshape operational technology environments, accelerating digital transformation and enabling next-generation, high-performance connectivity architectures.
- For instance, Ericsson’s Private 5G SA solution supports uplink speeds up to 1 Gbps and deterministic latency under 4 milliseconds when paired with its Cloud RAN and Edge Compute Stack, enabling real-time control for AGVs, robotic arms, and computer-vision systems.
Rapid Growth of IoT, AI-at-the-Edge, and Distributed Analytics
The proliferation of IoT ecosystems and AI-driven operational intelligence is fueling a strong shift toward decentralized computing frameworks such as MEC. Organizations deploying massive sensor networks, machine-vision systems, and predictive analytics platforms require localized processing to handle high-volume telemetry without overloading cloud networks. MEC enables real-time inference, event detection, and edge-based machine learning, supporting time-critical use cases like anomaly monitoring, energy optimization, fleet management, and remote asset control. The convergence of MEC and AI streamlines data governance by maintaining sensitive information at the source while reducing cloud storage dependencies. This is especially valuable for industries handling confidential or regulated datasets, including healthcare diagnostics, financial services, and defense systems. As businesses prioritize automation, operational resilience, and data-driven decisioning, MEC positions itself as the critical enabler of scalable, intelligent edge environments.
Key Trends & Opportunities
Emergence of Distributed Cloud Architectures and Edge-Native Platforms
A major trend shaping the MEC landscape is the rise of distributed cloud frameworks, where hyperscalers, telecom operators, and enterprises collaborate to unify edge and cloud environments. Platforms such as distributed Kubernetes, containerized runtimes, and microservices-based orchestration enable seamless workload portability from central clouds to edge nodes. This evolution supports dynamic scaling, multi-region deployment, and application elasticity—critical for video analytics, AR/VR workloads, and real-time collaboration tools. Vendors are increasingly offering edge-native development environments, enabling developers to build applications optimized for decentralized execution. Multi-access edge zones integrated with public cloud ecosystems simplify lifecycle management, continuous deployment, and policy enforcement. This trend creates significant opportunities for solution providers specializing in automation, observability, and edge performance optimization.
- For instance, Google Distributed Cloud (GDC) for bare metal is tested to run workloads up to 500 Kubernetes nodes per cluster (with a recommended maximum of 200 nodes for optimal production performance), and it allows edge regions to run Tensor Processing Units (TPUs), enabling high-performance AI inference and training directly at the edge.
Growth of Industry-Specific Edge Ecosystems and Verticalized MEC Solutions
Another key opportunity is the rapid verticalization of MEC platforms tailored to industry-specific operational requirements. Vertical ecosystems such as smart factories, autonomous mining, precision agriculture, digital healthcare, and intelligent transportation deploy MEC to ensure deterministic processing for mission-critical tasks. Vendors are introducing pre-configured edge modules designed for harsh conditions, high network isolation, or advanced robotics integration, enabling faster adoption for industrial customers. Smart city programs increasingly deploy MEC for traffic analytics, surveillance, environmental monitoring, and public safety applications. Additionally, the integration of MEC with digital twins and simulation engines strengthens predictive decision frameworks, offering significant efficiency gains to asset-intensive industries. As these sector-specific use cases expand, MEC providers gain strong opportunities to develop differentiated, domain-optimized solutions.
- For instance, Dell’s Latitude 7230 Rugged Extreme tablet—used in industrial MEC deployments—supports up to Intel Core i7 processors with 12 cores and offers ingress protection rated at IP65, enabling reliable field-edge data processing even in environments reaching temperatures of 63°C.
Key Challenges
Complexity in Integration, Orchestration, and Multi-Layered Network Management
Despite its rapid growth, MEC implementation faces technical and operational complexity due to multi-layered network architectures, distributed compute nodes, and diverse connectivity environments. Enterprises must integrate MEC with existing cloud systems, private networks, IoT platforms, and security frameworks, often requiring advanced orchestration capabilities. Coordinating compute workloads across hundreds of localized edges introduces challenges in traffic routing, lifecycle management, load balancing, and real-time application monitoring. The lack of unified standards across operators, cloud providers, and industrial equipment further increases deployment friction. Maintaining interoperability between edge runtimes, virtualized network functions, and enterprise data systems demands significant expertise and cross-domain alignment. This complexity slows deployment timelines, increases operational costs, and necessitates skilled technical resources.
Data Security, Edge Vulnerabilities, and Governance Limitations
While MEC enhances localization and privacy, it also expands the attack surface by distributing compute assets across numerous edge sites. Each node introduces potential vulnerabilities in physical access, firmware integrity, API exposure, and multi-tenant data handling. Ensuring end-to-end security across distributed architectures requires advanced threat detection, micro-segmentation, hardware-level security, and continuous patching—challenges amplified in remote or industrial settings. Additionally, edge nodes must adhere to diverse regulatory frameworks involving data residency, cross-border transfer rules, and industry compliance requirements. The absence of standardized governance models for multi-stakeholder MEC ecosystems raises concerns around accountability, data sovereignty, and incident response. These security and governance constraints remain significant barriers to large-scale MEC deployment.
Regional Analysis
North America
North America dominated the global MEC market with approximately 38% share in 2024, supported by extensive 5G standalone deployments, rapid enterprise adoption of private wireless networks, and strong investments from telecom operators and hyperscalers. The U.S. leads regional demand due to large-scale commercialization of edge-enabled applications in manufacturing, healthcare, autonomous mobility, and cloud gaming. Early integration of distributed cloud ecosystems and advanced edge infrastructure from leading cloud providers accelerates adoption across both public and private sectors. Canada follows with growing deployments in smart city programs, oil and gas operations, and industrial automation environments.
Europe
Europe accounted for around 27% of the global MEC market in 2024, driven by coordinated 5G corridor rollouts, strong data-sovereignty frameworks, and expanding industrial digitalization across Germany, France, the U.K., and the Nordics. The region benefits from government-backed Industry 4.0 initiatives and high adoption of edge-enabled automation in energy, automotive, logistics, and public safety applications. Regulatory emphasis on low-latency, secure, and compliance-driven architectures accelerates MEC implementation in mission-critical sectors. Additionally, growing investments in smart infrastructure, AI-led operations, and cross-border mobility solutions strengthen Europe’s position in advanced edge computing deployments.
Asia-Pacific
Asia-Pacific held approximately 30% market share in 2024, making it the fastest-growing regional MEC market. Strong momentum from China, Japan, South Korea, and India—each advancing 5G standalone networks and large-scale IoT adoption—drives sustained regional expansion. Telecommunications operators deploy MEC to support dense urban networks, smart manufacturing, connected mobility, and immersive consumer applications. Industrial hubs across China and Southeast Asia increasingly rely on edge-based AI analytics to enhance productivity and operational resilience. Government-backed digital infrastructure programs and widespread cloud-edge convergence further accelerate regional growth, creating significant opportunities for platform vendors and network integrators.
Latin America
Latin America represented approximately 3% of the global MEC market in 2024, with growth fueled by expanding 5G rollouts, rising cloud adoption, and early deployments of edge-enabled solutions in smart retail, logistics, and urban mobility. Brazil and Mexico lead regional demand as operators integrate MEC within evolving network architectures to improve quality of service and reduce backhaul congestion. Industrial sectors such as mining, agriculture, and utilities increasingly explore MEC to support automation and remote operations. Although adoption remains gradual, strengthening digital transformation initiatives and investments in network modernization support steady long-term expansion.
Middle East & Africa
The Middle East & Africa (MEA) captured about 2% market share in 2024, driven by high-tech infrastructure investments in the GCC region and growing demand for low-latency applications in energy, transportation, and security sectors. Countries such as the UAE, Saudi Arabia, and Qatar lead MEC adoption as part of national digital transformation agendas and smart city programs. Edge deployments support mission-critical functions in oil and gas operations, autonomous logistics, and public safety monitoring. In Africa, early adoption focuses on telecom modernization and cloud-edge connectivity in emerging digital hubs, supporting a long-term growth outlook.
Market Segmentations:
By Deployment Model
By Connectivity
- 5G-enabled MEC
- Wi-Fi–based MEC
By Application
- Network optimization
- Real-time data processing
- IoT and smart applications
- Content delivery
By Geography
- North America
- Europe
- Germany
- France
- U.K.
- Italy
- Spain
- Rest of Europe
- Asia Pacific
- China
- Japan
- India
- South Korea
- South-east Asia
- Rest of Asia Pacific
- Latin America
- Brazil
- Argentina
- Rest of Latin America
- Middle East & Africa
- GCC Countries
- South Africa
- Rest of the Middle East and Africa
Competitive Landscape
The competitive landscape of the Multi-Access Edge Computing (MEC) market is defined by strong collaboration among telecom operators, hyperscalers, network equipment providers, and edge platform innovators. Leading players such as AWS, Microsoft Azure, Google Cloud, Huawei, Nokia, Ericsson, Cisco, VMware, and IBM actively expand distributed cloud and edge ecosystems through integrated MEC zones, private 5G solutions, and edge-native application frameworks. Telecom operators including Verizon, AT&T, Deutsche Telekom, SK Telecom, and NTT Docomo accelerate MEC deployments to support enterprise automation, low-latency services, and smart infrastructure initiatives. Vendors compete on real-time processing capabilities, orchestration automation, API openness, and ecosystem depth. Strategic partnerships, multi-access edge node rollouts, and investments in AI-at-the-edge further intensify competition, as providers aim to deliver scalable, secure, and highly programmable edge environments. The landscape continues to evolve as industry players develop vertically optimized MEC solutions for manufacturing, energy, mobility, retail, and public sector applications.
Shape Your Report to Specific Countries or Regions & Enjoy 30% Off!
Key Player Analysis
Recent Developments
- In November 2025, Cisco announced its Cisco Unified Edge platform for distributed AI workloads at its Partner Summit.
- In February 2024, Nokia unveiled the industry’s first Multi-Access Edge Slicing innovation in partnership with e& UAE at the Mobile World Congress 2024.
- In March 2022, HPE enhanced its GreenLake edge-to-cloud platform with new cloud services and expanded partner ecosystem, enabling edge-to-cloud use cases (including MEC-adjacent capabilities) via GreenLake’s unified operating experience.
Report Coverage
The research report offers an in-depth analysis based on Deployment model, Connectivity, Application and Geography. It details leading market players, providing an overview of their business, product offerings, investments, revenue streams, and key applications. Additionally, the report includes insights into the competitive environment, SWOT analysis, current market trends, as well as the primary drivers and constraints. Furthermore, it discusses various factors that have driven market expansion in recent years. The report also explores market dynamics, regulatory scenarios, and technological advancements that are shaping the industry. It assesses the impact of external factors and global economic changes on market growth. Lastly, it provides strategic recommendations for new entrants and established companies to navigate the complexities of the market.
Future Outlook
- MEC will become a core layer of digital infrastructure as enterprises expand automation, AI inference, and real-time analytics at the edge.
- 5G standalone and private 5G networks will accelerate MEC adoption across manufacturing, logistics, energy, and mobility sectors.
- Distributed cloud architectures will grow, enabling seamless workload portability between central cloud and edge nodes.
- AI-at-the-edge will advance rapidly, with MEC supporting high-frequency inference for video analytics, robotics, and industrial operations.
- Vertical-specific MEC solutions will expand across smart factories, healthcare, transportation, and utilities.
- Telecom operators and hyperscalers will deepen partnerships to deliver integrated, scalable edge ecosystems.
- Cybersecurity and zero-trust frameworks will become essential to manage distributed edge attack surfaces.
- MEC deployments will increase in smart cities to support traffic systems, safety infrastructure, and environmental monitoring.
- Energy-efficient and ruggedized edge hardware will gain adoption in remote and industrial environments.
- Real-time digital twins, AR/VR, and immersive applications will increasingly rely on MEC for low-latency performance.


