Market Overview
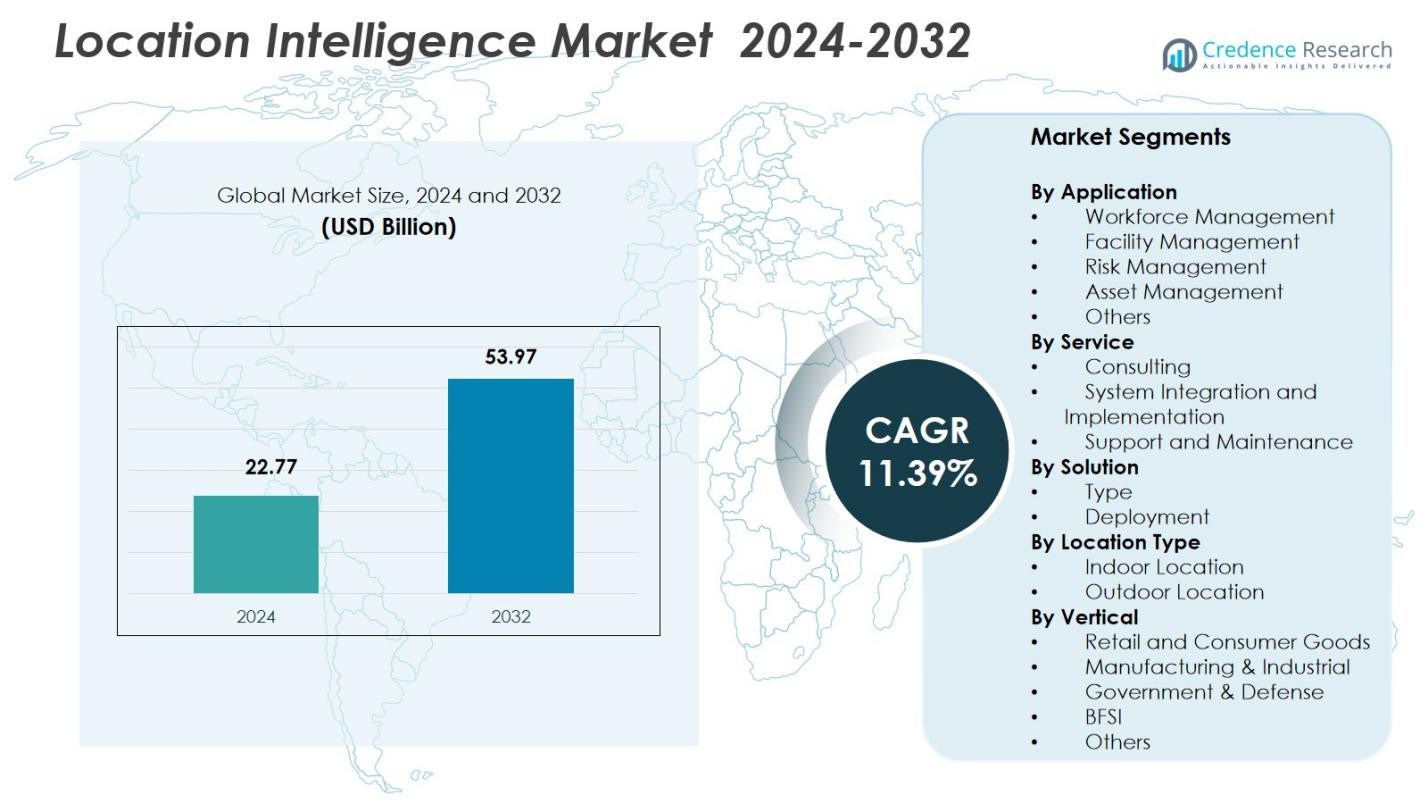
Location Intelligence Market size was valued at USD 22.77 Billion in 2024 and is anticipated to reach USD 53.97 Billion by 2032, at a CAGR of 11.39% during the forecast period.
| REPORT ATTRIBUTE |
DETAILS |
| Historical Period |
2020-2023 |
| Base Year |
2024 |
| Forecast Period |
2025-2032 |
| Location Intelligence Market Size 2024 |
USD 22.77 Billion |
| Location Intelligence Market, CAGR |
11.39% |
| Location Intelligence Market Size 2032 |
USD 53.97 Billion |
Location Intelligence Market is shaped by leading players such as Google LLC, Esri, Hexagon AB, Microsoft Corporation, Alteryx Inc., HERE Technologies, Oracle Corporation, Pitney Bowes Inc., Sisense Inc., and Precisely Holdings LLC, all of whom drive advancements in geospatial analytics, AI-enabled mapping, and cloud-based location platforms. These companies strengthen market growth through enhanced data integration, spatial visualization, and real-time intelligence capabilities adopted across retail, logistics, government, and utilities. Regionally, North America leads the Location Intelligence Market with a 38.6% share in 2024, supported by strong digital infrastructure, high enterprise adoption, and continuous investments in smart city and IoT-driven spatial technologies.
Access crucial information at unmatched prices!
Request your sample report today & start making informed decisions powered by Credence Research Inc.!
Download Sample
Market Insights
- Location Intelligence Market reached USD 22.77 Billion in 2024 and will grow at a CAGR of 11.39% through 2032, driven by rising adoption of geospatial analytics across industries.
- Strong market drivers include rapid integration of real-time spatial analytics, increasing IoT device penetration, and growing enterprise focus on workflow optimization and asset visibility.
- Key trends involve AI-powered mapping, digital twins, and expanding cloud-based location platforms, while Workforce Management leads the application segment with a 4% share in 2024.
- Major players enhance the market through advanced geospatial platforms and partnerships, though challenges persist due to high implementation costs and stringent data privacy regulations.
- Regionally, North America holds 38.6%, Europe 27.4%, and Asia-Pacific 23.1%, with APAC expected to grow fastest due to expanding smart city investments and digital infrastructure upgrades.
 Market Segmentation Analysis:
By Application
The Location Intelligence Market by application is led by Workforce Management, commanding a 31.4% share in 2024. Its dominance is driven by rising adoption of real-time location analytics for field-force optimization, route planning, task automation, and performance monitoring across logistics, utilities, retail, and transportation sectors. Facility Management and Risk Management segments are expanding as organizations increasingly depend on geospatial data for safety analytics, predictive maintenance, and compliance reporting. Asset Management and Others also grow steadily as enterprises integrate mapping tools to enhance asset tracking, operational visibility, and situational awareness.
- For instance, Caterpillar integrates geospatial data into their equipment monitoring systems to enhance fleet management and asset utilization in real-time.
By Service
Within the service segment, System Integration and Implementation holds the leading 42.8% share in 2024, supported by the rapid shift toward end-to-end deployment of geospatial analytics platforms, cloud-based location systems, and IoT-connected mapping solutions. Enterprises prioritize seamless integration with existing IT infrastructure, driving demand for expert implementation services. Consulting services gain traction as organizations explore advanced use cases in spatial analytics, while Support and Maintenance maintains stable growth as recurring service needs increase with expanding deployments of location-based intelligence solutions.
- For instance, Esri’s recent ArcGIS Enterprise deployments include seamless integration with clients’ existing IT frameworks, enabling end-to-end spatial data solutions.
By Solution
The solution segment is dominated by the Type-based solutions, accounting for a 47.2% share in 2024, as businesses increasingly deploy geocoding, mapping, spatial analytics, and GPS-based intelligence tools to enhance decision-making and operational efficiency. Demand is further propelled by the growing use of advanced visualization systems and AI-enabled geospatial models across industries. Deployment-based solutions also expand significantly as organizations accelerate cloud migration, driven by scalability, lower operational costs, and integration needs for real-time location data across multi-site operations.
Key Growth Drivers
Rising Adoption of Real-Time Spatial Analytics
The rapid integration of real-time spatial analytics is a major growth driver for the Location Intelligence Market. Organizations increasingly rely on dynamic geospatial insights to optimize operations, monitor assets, and enhance decision-making across logistics, transportation, retail, and public safety. The proliferation of IoT sensors, GPS-enabled devices, and mobile workforce applications fuels demand for instant geographic data visualization. Businesses value real-time intelligence for improving delivery efficiency, reducing operational risks, and strengthening service responsiveness, accelerating market adoption across both developed and emerging economies.
- For instance, Amazon India employs AWS Location Service for real-time geospatial analytics to refine delivery routes based on traffic, weather, and disruptions.
Expansion of Smart Cities and Infrastructure Digitization
Global smart city initiatives significantly propel market growth as governments and urban planners adopt location intelligence for traffic optimization, energy management, infrastructure monitoring, and public safety. Geospatial platforms support efficient resource allocation and improve urban service delivery using real-time mapping and predictive analytics. Increasing investments in digital twins, 5G connectivity, and smart mobility solutions further expand the need for high-quality geospatial data. This trend positions location intelligence as a foundational technology for sustainable urban development, driving robust adoption across municipal agencies and technology integrators.
- For instance, Lepton Software leverages location intelligence to analyze real-time traffic patterns and population density, enabling cities to optimize infrastructure investments and regulate traffic signals through smart sensors and IoT devices for smoother flow.
Growing Enterprise Focus on Operational Efficiency
Businesses across industries are deploying location intelligence to improve operational efficiency, streamline workflows, and enhance customer engagement. The ability to analyze geographic patterns helps enterprises refine site selection, manage distributed assets, and improve last-mile delivery. Retail, manufacturing, BFSI, and utilities leverage geospatial insights to enhance productivity, minimize downtime, and support risk-informed decision-making. The rising volume of enterprise data and the shift toward predictive analytics amplify the value of location-based intelligence, making it essential for digitally transforming organizations worldwide.
Key Trends & Opportunities
AI-Driven Geospatial Analytics Expansion
A key trend shaping the market is the integration of artificial intelligence and machine learning into geospatial analytics. AI-powered location intelligence solutions offer enhanced predictive modeling, anomaly detection, and automated mapping capabilities. These technologies support advanced applications such as demand forecasting, route optimization, and risk prediction. As enterprises adopt AI to unlock deeper spatial insights, new opportunities emerge for vendors offering intelligent geoprocessing tools and cloud-native geospatial platforms. The convergence of AI and location intelligence significantly elevates the analytical precision and scalability of geospatial decision-making.
- For instance, Esri’s ArcGIS platform integrates machine learning for automated land-use classification and spatial analysis, enabling precise environmental planning and infrastructure management.
Growing Adoption of Cloud-Based Location Platforms
Cloud-based location intelligence platforms represent a major opportunity as organizations migrate from legacy GIS systems to scalable, subscription-based solutions. Cloud deployment offers faster data processing, seamless integration, remote accessibility, and cost-efficient scaling. Industries with distributed operations—such as logistics, retail, real estate, and telecom—benefit from centralized geospatial data management. The rising need for real-time visibility and cross-functional collaboration drives strong demand for cloud-native mapping services, creating growth potential for providers offering integrated APIs, analytics engines, and geospatial data marketplaces.
- For instance, Salesforce’s acquisition of MapAnything in 2019 enhanced its CRM with geospatial analytics, enabling sales teams to optimize territory management through integrated cloud mapping tools.
Key Challenges
Data Privacy, Security, and Regulatory Compliance Issues
One of the major challenges limiting market expansion is the growing complexity of data privacy and regulatory compliance. Location intelligence relies heavily on real-time tracking, personal movement data, and device-level geolocation, raising concerns around user consent, data anonymization, and cybersecurity. Stricter global frameworks such as GDPR and CCPA require vendors and enterprises to adopt robust governance practices, increasing compliance costs. Any misuse or breach of sensitive geospatial data can result in reputational and financial risks, making privacy management a persistent barrier.
High Implementation Costs and Integration Complexity
The deployment of location intelligence solutions often involves high initial investment, especially for enterprises transitioning from traditional systems to advanced geospatial platforms. Integration with existing IT infrastructure, legacy databases, and disparate data sources increases technical complexity and extends implementation timelines. Smaller organizations face financial barriers in adopting advanced spatial analytics, while larger enterprises struggle with data harmonization and workflow restructuring. These challenges can slow adoption rates, particularly in cost-sensitive sectors lacking technical expertise or digital maturity.
Regional Analysis
North America
North America leads the Location Intelligence Market with a 38.6% share in 2024, driven by strong adoption of GIS platforms, AI-enabled geospatial analytics, and advanced IoT infrastructure. The U.S. dominates regional demand as enterprises across retail, logistics, and public safety increasingly rely on real-time mapping tools for operational efficiency and risk mitigation. Heavy investments in smart cities, autonomous mobility, and 5G expansion further support market growth. Canada contributes steadily through growing applications in environmental monitoring and infrastructure planning. The presence of major technology providers and high digital maturity reinforces North America’s leadership position.
Europe
Europe holds a significant 27.4% share in 2024, supported by increasing demand for geospatial intelligence in transportation, energy management, environmental assessment, and urban development. Countries such as Germany, the U.K., France, and the Nordics drive adoption as governments and enterprises implement GIS-led digital transformation initiatives. The region benefits from strong regulatory support for spatial data standardization and open geodata accessibility. Expanding investments in smart mobility, renewable energy infrastructure, and climate resilience projects accelerate deployment of location analytics. European industries increasingly utilize spatial insights for optimizing workflows, strengthening compliance, and enhancing sustainability-driven decision-making.
Asia-Pacific
Asia-Pacific captures a growing 23.1% share in 2024, fueled by rapid urbanization, expanding smart city programs, and rising digital investments across China, India, Japan, and Southeast Asia. Enterprises across e-commerce, transportation, telecom, and utilities widely adopt location intelligence to manage large-scale operations and optimize logistics networks. Government-led initiatives supporting digital mapping, satellite imaging, and real-time surveillance strengthen regional adoption. The surge in mobile device usage and proliferation of cloud-based analytics platforms further boosts market expansion. Asia-Pacific remains the fastest-growing region, driven by strong demand for spatial intelligence in infrastructure development and public-services modernization.
Latin America
Latin America accounts for 6.9% share in 2024, with increasing adoption of location intelligence across transportation, agriculture, retail, and public safety. Brazil, Mexico, and Chile lead the regional market as enterprises leverage geospatial tools for route optimization, crop monitoring, and environmental risk assessment. Growing investments in urban mobility, digital infrastructure, and geospatial data modernization support market penetration. Cloud-based mapping solutions are gaining traction among small and mid-sized enterprises seeking cost-efficient data visualization capabilities. Despite infrastructural challenges, the region’s expanding digital transformation efforts continue to create new opportunities for location-based intelligence providers.
Middle East & Africa
The Middle East & Africa region holds a 4.0% share in 2024, driven by rising investments in smart infrastructure, security surveillance, and asset management systems. Gulf nations including the UAE, Saudi Arabia, and Qatar deploy location intelligence for urban planning, energy optimization, and smart mobility. Africa shows increasing adoption of GIS applications in agriculture, environmental monitoring, and public health. The region benefits from expanding satellite mapping programs, 5G rollout, and geospatial digitization initiatives. While adoption levels vary, growing government-backed development projects and enterprise modernization efforts contribute to steady market growth.
Market Segmentations:
By Application
- Workforce Management
- Facility Management
- Risk Management
- Asset Management
- Others
By Service
- Consulting
- System Integration and Implementation
- Support and Maintenance
By Solution
By Location Type
- Indoor Location
- Outdoor Location
By Vertical
- Retail and Consumer Goods
- Manufacturing & Industrial
- Government & Defense
- BFSI
- Others
By Geography
- North America
- Europe
- Germany
- France
- U.K.
- Italy
- Spain
- Rest of Europe
- Asia Pacific
- China
- Japan
- India
- South Korea
- South-east Asia
- Rest of Asia Pacific
- Latin America
- Brazil
- Argentina
- Rest of Latin America
- Middle East & Africa
- GCC Countries
- South Africa
- Rest of the Middle East and Africa
Competitive Landscape
Competitive landscape in the Location Intelligence Market features leading players such as Google LLC, Esri, Hexagon AB, Microsoft Corporation, Alteryx Inc., HERE Technologies, Oracle Corporation, Pitney Bowes Inc., Sisense Inc., and Precisely Holdings LLC, who collectively drive innovation and technological advancement across the industry. These companies compete by enhancing geospatial analytics capabilities, integrating AI and machine learning, and expanding cloud-based mapping platforms that support real-time decision-making. Vendors increasingly focus on delivering scalable APIs, advanced visualization tools, and interoperable GIS solutions to meet enterprise digital transformation needs. Strategic partnerships with governments, telecom operators, and IoT solution providers strengthen their market presence, while acquisitions help diversify product portfolios and expand geographic reach. As demand grows for precision-driven location insights, these key players emphasize continuous R&D, high-quality spatial data, and industry-specific solutions to differentiate themselves. Overall, competitive dynamics remain strong, shaped by technological innovation, platform integration, and rising enterprise reliance on spatial intelligence.
Key Player Analysis
Recent Developments
- In July 2025, Esri and Microsoft Corporation integrated Azure OpenAI Service into ArcGIS, bringing AI-powered assistants for easier geospatial data analysis and mapping.
- In July 2025, HERE Technologies launched its new “GIS Data Suite” at the 2025 Esri User Conference, offering enhanced foundational GIS data to support location-based applications.
- In March 2025, Google LLC and Esri announced a partnership to integrate Google Maps’ photorealistic 3D tiles into Esri’s mapping platform, enabling richer, high-resolution global 3D base maps for location-intelligence users.
Shape Your Report to Specific Countries or Regions & Enjoy 30% Off!
Report Coverage
The research report offers an in-depth analysis based on Application, Service, Solution, Location Type, Vertical and Geography. It details leading market players, providing an overview of their business, product offerings, investments, revenue streams, and key applications. Additionally, the report includes insights into the competitive environment, SWOT analysis, current market trends, as well as the primary drivers and constraints. Furthermore, it discusses various factors that have driven market expansion in recent years. The report also explores market dynamics, regulatory scenarios, and technological advancements that are shaping the industry. It assesses the impact of external factors and global economic changes on market growth. Lastly, it provides strategic recommendations for new entrants and established companies to navigate the complexities of the market.
Future Outlook
- Demand for AI-driven geospatial analytics will increase as enterprises prioritize predictive and real-time intelligence.
- Cloud-based location platforms will expand rapidly, supporting scalable and cross-functional data integration.
- Smart city initiatives will accelerate adoption across transportation, utilities, and public safety sectors.
- Integration of digital twins will enhance infrastructure planning, asset monitoring, and urban simulation.
- Growing use of IoT devices will generate richer spatial data for operational optimization.
- Retail, logistics, and e-commerce sectors will adopt advanced mapping tools for improved customer experience and route efficiency.
- Location intelligence will gain deeper penetration in risk management and climate-resilience planning.
- Privacy-preserving geospatial technologies will advance as regulatory compliance becomes more complex.
- Spatial intelligence applications will increase in agriculture, mining, and energy for productivity and sustainability outcomes.
- Partnerships between technology vendors, governments, and telecom providers will strengthen ecosystem innovation.


