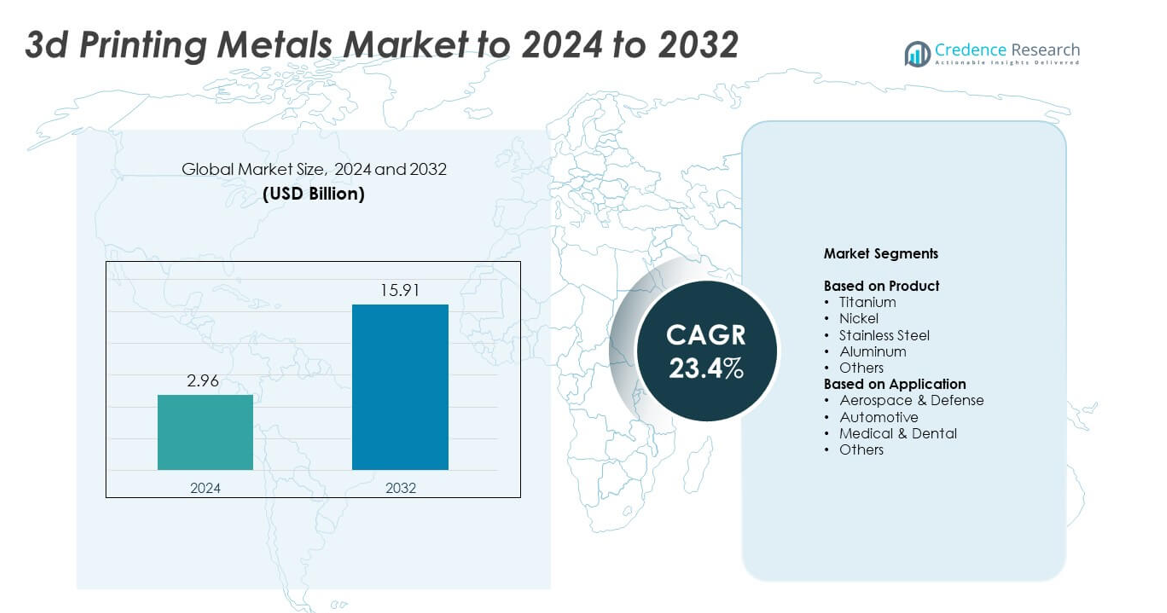
3D Printing Metals Market By Form (Powder and Filament) By Product (Titanium, Nickel, Stainless Steel, Aluminum, and Others) By Application (Aerospace & Defense, Automotive, Medical & Dental, and Others)-Growth, Future Prospects & Competitive Analysis, 2016 – 2030

Price: $4999

Published: | Report ID: 15656 | Report Format : PDF

Key Highlights of the report

How are the major segments performing in the 3D Printing Metals market?

  • In 2022, powder-based 3D printing metals are currently the dominant form, holding the largest market share. This is because powder-based printing allows for higher precision, better surface finish, and faster printing speeds compared to filament-based printing.
  • In 2022, titanium is often considered the “gold standard” for 3D printing metals due to its high strength-to-weight ratio, corrosion resistance, and biocompatibility. It is widely used in aerospace, medical, and dental applications, among others.
  • In 2022, the aerospace and defense industry has been the largest adopter of 3D printing metals due to the need for lightweight, high-strength, and complex components. This industry has also been an early adopter of the technology, with many leading aerospace companies investing heavily in 3D printing research and development.

What is the Market Size of 3D Printing Metals regarding value?

The global 3D Printing Metals market is anticipated to grow at a substantial CAGR of 31.00% in the upcoming years. The global 3D Printing Metals industry was estimated to be worth USD 1,648.6 million in 2022 and was expected to be worth USD 10,914.7 billion by 2030.

Design Element 2

Access crucial information at unmatched prices!

Request your free sample report today & start making informed decisions powered by Credence Research!

Download Free Sample
CTA Design Element 3

Which region dominated the 3D Printing Metals market?

In 2022, the North America region dominated the 3D Printing Metals market. North America is dominating the 3D printing metals market due to several factors. Firstly, the region has a strong presence of key industries such as aerospace, automotive, and medical, which are early adopters of 3D printing metals. These industries require high-strength, lightweight, and complex components that can be produced more efficiently and cost-effectively using 3D printing technology. Additionally, North America has a well-developed research and development infrastructure, which has led to innovations in 3D printing metals technology. The region is home to some of the largest 3D printing metals companies, which have significant market share in the global market. Finally, the North American market has favorable regulatory policies and a supportive ecosystem for the adoption of 3D printing metals technology, which has helped to drive growth in the market.

How is US Market Performing in the 3D Printing Metals market?

In 2022, the US region dominated the 3D Printing Metals market. The United States is a significant player in the 3D printing metals market, with a well-developed ecosystem of companies, research institutions, and government support. The US market for 3D printing metals has seen steady growth in recent years due to increasing demand from various industries. The United States has a strong presence of key industries such as aerospace, automotive, and medical, which are early adopters of 3D printing metals. These industries require high-strength, lightweight, and complex components that can be produced more efficiently and cost-effectively using 3D printing technology.

How is the economy impacting the global 3D Printing Metals growth?

The COVID-19 pandemic has had a significant impact on the global economy and the 3D printing metals market. While some industries have seen increased demand for 3D printing metals due to changing market conditions, such as the increased demand for medical equipment and supplies, other industries have experienced decreased demand due to supply chain disruptions and reduced consumer spending.

What is the competitive environment of the 3D Printing Metals market?

The competitive environment of the 3D printing metals market is extremely fragmented, with a large number of players operating in the market. Some of the major market players include 3D Systems Corporation, EOS GmbH, Sandvik AB, Hoganas AB, Materialise NV, Carpenter Technology Corporation, GKN plc, Renishaw plc, Concept Laser GmbH, and SLM Solutions Group AG, among others. These companies compete on the basis of various factors such as product quality, performance, innovation, price, and customer service. Many of these companies have a strong focus on research and development in order to enhance the quality & performance of their products and gain a competitive edge in the market. Additionally, they are investing in strategic collaborations to expand their market presence and enhance their product offerings.

The market is witnessing a trend towards consolidation as companies look to expand their market share and gain a competitive edge. In recent years, there have been several mergers and acquisitions in the industry as companies seek to strengthen their positions in the market and gain access to new technologies and markets. The market is also characterized by high competition between established players and new entrants. New players are entering the market with innovative technologies and business models, which are disrupting the traditional business models of established players.

Executive Summary

What are the key trends in the 3D Printing Metals market?

  • The demand for metal powders used in 3D printing metals is on the rise. Companies are investing in the development of new and improved metal powders that can offer better performance and quality.
  • The 3D printing metals market is constantly evolving with new technological advancements. For example, new printing technologies such as binder jetting and metal injection molding are emerging, which offer faster printing speeds and greater design flexibility.

How is technology advancement driving 3D Printing Metals Market?

The 3D printing metals market is being driven by rapid technological advancement. Over the years, significant strides have been made in the development of 3D printing technology that has resulted in the increased adoption of 3D printing metals across various industries. Technological advancements have improved the quality and performance of 3D printed metal parts while reducing the cost and time required for production.

One of the key technological advancements in the 3D printing metals market is the emergence of new printing technologies, such as binder jetting and metal injection molding. These technologies offer faster printing speeds, greater design flexibility, and the ability to create complex geometries that were previously impossible. Additionally, improvements in software tools used in 3D printing metals have enabled designers and engineers to create more complex parts with greater precision and accuracy.

Furthermore, the development of new materials is also driving the growth of the 3D printing metals market. Businesses are spending money on creating new, enhanced metal powders that can provide greater performance and quality. Adoption of new alloys and materials that can provide improved qualities and performance, such as greater strength, durability, and heat resistance, is also on the rise.

Which are the key investments by the 3D Printing Metals market players?

As the 3D printing metals market continues to grow, key players in the industry are making significant investments in research and development, strategic partnerships, and acquisitions. These investments are aimed at enhancing their product portfolios, expanding their market presence, and staying ahead of the competition. One area where players are investing heavily is in research and development activities. Companies are spending in the development of new and improved metal powders, alloys, and printing technologies that offer better performance and quality. They are also investing in the development of new applications for 3D printing metals, such as in the aerospace and medical industries. In addition to research and development, strategic partnerships are another key area of investment. By partnering with other companies, players can leverage their strengths and resources to develop new products and expand their market reach. For example, EOS GmbH has formed partnerships with leading aerospace companies such as Airbus and Boeing to develop new 3D printing metal solutions for the aerospace industry.

In 2020, GE acquired a 3D printing metal company called Concept Laser to expand its metal additive manufacturing capabilities. In addition, GE has also developed new 3D printing metal alloys, such as Titanium Beta 21S and Inconel 718. EOS GmbH. In 2021, EOS announced that it had developed a new 3D printing metal powder called EOS NickelAlloy IN939, which is designed for use in the aerospace industry. The company has also entered into strategic partnerships with leading aerospace companies such as Airbus and Boeing. Some major players in the 3D Printing Metals market are Arcam AB; ExOne GmbH; Carpenter Technology Corp.; Renishaw PLC; Materialise NV; 3D Systems Corp.; Voxeljet AG; Sandvik AB; Hoganas AB; GKN PLC.

3D Printing Metals Market

What are the Major Driving Factors for the 3D Printing Metals Market?

One major driving factor for the 3D printing metals market is the increasing adoption of 3D printing technology in various industries. 3D printing offers several advantages over traditional manufacturing processes, such as reduced costs, faster production times, and greater design flexibility. This has led to the widespread adoption of 3D printing across a range of industries, including aerospace, automotive, medical, and dental. The aerospace industry, in particular, has emerged as a key driver of the 3D printing metals market. 3D printing allows aerospace companies to produce lightweight, high-strength components that can withstand the extreme conditions of space travel. By using 3D printing, aerospace companies can reduce the weight of their components, which in turn reduces the weight of the entire spacecraft. This is critical for space missions, as every pound of weight saved can translate to significant cost savings.

Another industry that has embraced 3D printing metals is the medical industry. 3D printing allows medical professionals to produce customized implants and prosthetics that are perfectly tailored to individual patients. This has the potential to improve patient outcomes and reduce recovery times. The automotive industry is also seeing increased adoption of 3D printing metals.

What are the Major Risks for the 3D Printing Metals Market?

One major restraint for the 3D printing metals market is the high cost of 3D printing compared to traditional manufacturing processes. Although 3D printing offers several advantages such as faster production times and greater design flexibility, the cost of 3D printing is still higher than traditional manufacturing processes such as casting, forging, and milling. The cost of 3D printing metals can be attributed to several factors, such as the high cost of metal powders, the cost of 3D printing equipment, and the cost of skilled labor required for 3D printing. Additionally, the production of large or complex parts using 3D printing can be time-consuming and require multiple iterations, further increasing the overall cost of production.

This high cost of 3D printing metals can be a significant barrier for some industries, especially those with low profit margins or those that rely heavily on large-scale production. As a result, many companies may be hesitant to adopt 3D printing technology, opting instead for more cost-effective traditional manufacturing processes. However, as the technology continues to evolve and improve, the cost of 3D printing is expected to decrease, making it more accessible to a wider range of industries. Additionally, the benefits of 3D printing, such as greater design flexibility and faster production times, may ultimately outweigh the initial investment in 3D printing equipment and materials.

Which is the key application in the 3D Printing Metals market?

The key application for 3D printing metals is in the aerospace and defense industry. This industry requires high-performance parts that are lightweight, strong, and durable, and 3D printing metals provide a solution to these requirements. With 3D printing metals, aerospace and defense manufacturers can produce complex geometries and designs that are not possible with traditional manufacturing methods. This can result in improved performance and reduced weight, which is critical for aerospace applications. In addition to aerospace and defense, 3D printing metals are also used in other industries such as automotive, medical, and dental. In the automotive industry, 3D printing metals are used for prototyping, tooling, and production of low-volume components. In the medical and dental industry, 3D printing metals are used for the production of custom implants and prosthetics.

How is the 3D Printing Metals market performing in regions?

The market for 3D printing metals is anticipated to expand significantly in the Asia Pacific region as a result of the rising use of 3D printing technology across a variety of industries, particularly in China. The Chinese government has been making significant investments in R&D projects to encourage the use of 3D printing technology in the nation, which is fueling the expansion of the 3D printing metals market in the area. In addition, the growing automotive industry in Asia Pacific is driving the demand for 3D printing metals, as many automotive manufacturers are adopting 3D printing technology for the production of automotive parts. Moreover, the increasing adoption of 3D printing technology in the medical and dental industry in the region is also driving the growth of the 3D printing metals market.

Japan, South Korea, and India are also contributing to the growth of the 3D printing metals market in the Asia Pacific region. In Japan, the aerospace and defense industry is a significant contributor to the 3D printing metals market, while in South Korea, the government has been promoting the adoption of 3D printing technology in the manufacturing sector. In India, the growing medical and dental industry is driving the demand for 3D printing metals. Thus, the Asia Pacific region is expected to continue to experience significant growth in the 3D printing metals market in the coming years, driven by increasing demand from various industries and government initiatives to promote the adoption of 3D printing technology.

Shape Your Report to Specific Countries or Regions & Enjoy 30% Off!

What is the regulatory landscape for the 3D Printing Metals market?

A regulatory development in the 3D printing metals market is the European Union’s Medical Devices Regulation (MDR), which became effective in May 2021. The MDR includes specific requirements for medical devices manufactured using 3D printing, including the need to demonstrate the biocompatibility and performance of 3D printed medical devices.

What are the major players planning for the future of the 3D Printing Metals market?

The major players in the 3D printing metals market are focusing on expanding their market presence, enhancing their product portfolios, and investing in research and development activities to drive innovation and meet evolving customer needs. One key area of focus for the future of the 3D printing metals market is the development of new materials and alloys that offer improved performance and functionality. Companies are investing in research and development to develop new 3D printing metals with properties such as higher strength, improved thermal conductivity, and better corrosion resistance.

Another important area of focus is the development of new 3D printing technologies and processes that offer faster printing speeds, higher accuracy, and lower costs. For example, some companies are exploring the use of metal powders with improved flowability and particle size distribution to enable faster and more efficient printing. Additionally, companies are exploring new applications for 3D printing metals beyond traditional industries such as aerospace and medical. For example, the automotive industry is increasingly using 3D printing metals for prototyping and tooling applications, while the consumer products industry is exploring the use of 3D printing metals for mass customization and personalized products.

REPORT ATTRIBUTE DETAILS
3D Printing Metals Market by Volume Yes
3D Printing Metals Market by Value Yes
3D Printing Metals Market, Tornado Analysis Yes
3D Printing Metals Market, STAR Analysis Yes
3D Printing Metals Market, SRC Analysis Yes
3D Printing Metals Market, Import-Export Data Yes (On Demand)
3D Printing Metals Market Pricing Analysis Yes (On Demand)
3D Printing Metals Market Segment Analysis By Form (Powder and Filament)

By Product (Titanium, Nickel, Stainless Steel, Aluminum, and Others)

By Application (Aerospace & Defense, Automotive, Medical & Dental, and Others)

3D Printing Metals Market, Regional Analysis North America (US and Canada)

Europe (Germany, UK, France, Italy, Spain, and Rest of Europe)

Asia Pacific (China, India, Japan, South Korea, South East Asia, and Rest of Asia Pacific)

Latin America (Brazil, Mexico, and Rest of Latin America)

Middle East and Africa (GCC Countries, South Africa, and Rest of Middle East and Africa)

3D Printing Metals Market Key Companies Arcam AB; ExOne GmbH; Carpenter Technology Corp.; Renishaw PLC; Materialise NV; 3D Systems Corp.; Voxeljet AG; Sandvik AB; Hoganas AB; GKN PLC
3D Printing Metals Market Competitive Landscape Market Share Analysis

Competitive Benchmarking

Key Players Market Positioning

Geographical Presence Analysis

Major Strategies Adopted

Segmentation of Global 3D Printing Metals Market-

Global 3D Printing Metals Market – By Form

  • Powder
  • Filament

Global 3D Printing Metals Market – By Product

  • Titanium
  • Nickel
  • Stainless Steel
  • Aluminum
  • Others

Global 3D Printing Metals Market – By Application

  • Aerospace & Defense
  • Automotive
  • Medical & Dental
  • Others

Global 3D Printing Metals Market – By Region

  • North America
    • U.S.
    • Canada
  • Europe
    • Germany
    • France
    • U.K.
    • Italy
    • Spain
    • Rest of Europe
  • Asia Pacific
    • China
    • Japan
    • India
    • South Korea
    • South-east Asia
    • Rest of Asia Pacific
  • Latin America
    • Brazil
    • Mexico
    • Rest of Latin America
  • Middle East & Africa
    • GCC Countries
    • South Africa
    • Rest of Middle East and Africa

1. Preface
1.1. Report Description
1.1.1. Purpose of the Report
1.1.2. Target Audience
1.1.3. USP and Key Offerings
1.2. Research Scope
1.3. Research Methodology
1.3.1. Phase I – Secondary Research
1.3.2. Phase II – Primary Research
1.3.3. Phase III – Expert Panel Review
1.3.4. Approach Adopted
1.3.4.1. Top-Down Approach
1.3.4.2. Bottom-Up Approach
1.3.5. Assumptions
1.4. Market Introduction
1.5. Market Research Scope

2. Executive Summary
2.1. Market Snapshot: Global 3D Printing Metals Market
2.2. Global 3D Printing Metals Market, By Form
2.3. Global 3D Printing Metals Market, By Product
2.4. Global 3D Printing Metals Market, By Application
2.5. Global 3D Printing Metals Market, By Region

3. Market Dynamics & Factors Analysis
3.1. Introduction
3.1.1. Global 3D Printing Metals Market Value, 2017-2030, (US$ Mn)
3.1.2. Y-o-Y Growth Trend Analysis
3.2. Market Dynamics
3.2.1. Market Drivers
3.2.2. Market Restraints
3.2.3. Market Opportunities
3.2.4. Major Application Challenges
3.3. Growth and Development Patterns
3.4. Investment Feasibility Analysis
3.5. Market Opportunity Analysis
3.5.1. Form
3.5.2. Product
3.5.3. Application
3.5.4. Geography

4. Premium Insights
4.1. STAR (Situation, Task, Action, Results) Analysis
4.2. Porter’s Five Forces Analysis
4.2.1. Threat of New Entrants
4.2.2. Bargaining Power of Buyers/Consumers
4.2.3. Bargaining Power of Suppliers
4.2.4. Threat of Substitute Forms
4.2.5. Intensity of Competitive Rivalry
4.3. Key Market Trends
4.3.1. Demand Side Trends
4.3.2. Supply Side Trends
4.4. Value Chain Analysis
4.5. Technology Analysis
4.6. Analysis and Recommendations
4.7. Marketing Strategy Analysis
4.7.1. Direct Marketing
4.7.2. Indirect Marketing
4.7.3. Marketing Channel Development Trend

5. Market Positioning of Key Players, 2021
5.1. Company market share of key players, 2021
5.2. Competitive Benchmarking
5.3. Market Positioning of Key Vendors
5.4. Geographical Presence Analysis
5.5. Major Strategies Adopted by Key Players
5.5.1. Key Strategies Analysis
5.5.2. Mergers and Acquisitions
5.5.3. Partnerships
5.5.4. Form Launch
5.5.5. Geographical Expansion
5.5.6. Others

6. Economic Impact Analysis
6.1. Recession Impact
6.1.1. North America
6.1.2. Europe
6.1.3. Asia Pacific
6.1.4. Latin America
6.1.5. Middle East and Africa
6.2. Ukraine-Russia War Impact
6.2.1. North America
6.2.2. Europe
6.2.3. Asia Pacific
6.2.4. Latin America
6.2.5. Middle East and Africa
6.3. COVID-19 Impact Analysis
6.3.1. North America
6.3.2. Europe
6.3.3. Asia Pacific
6.3.4. Latin America
6.3.5. Middle East and Africa

7. Global 3D Printing Metals Market
7.1. Global 3D Printing Metals Market, by Form, 2017-2030(US$ Mn)
7.1.1. Overview
7.1.2. Global 3D Printing Metals Market, By Form, 2021 vs 2030 (in%)
7.1.3. Global 3D Printing Metals Market, By Powder, 2017-2030 (US$ Mn)
7.1.4. Global 3D Printing Metals Market, By Filament, 2017-2030 (US$ Mn)
7.2. Global 3D Printing Metals Market, by Product, 2017-2030(US$ Mn)
7.2.1. Overview
7.2.2. Global 3D Printing Metals Market, By Product, 2021 vs 2030 (in%)
7.2.3. Global 3D Printing Metals Market, By Titanium, 2017-2030 (US$ Mn)
7.2.4. Global 3D Printing Metals Market, By Nickel, 2017-2030 (US$ Mn)
7.2.5. Global 3D Printing Metals Market, By Stainless Steel, 2017-2030 (US$ Mn)
7.2.6. Global 3D Printing Metals Market, By Aluminum, 2017-2030 (US$ Mn)
7.2.7. Global 3D Printing Metals Market, By Others, 2017-2030 (US$ Mn)

7.3. Global 3D Printing Metals Market, by Application, 2017-2030(US$ Mn)
7.3.1. Overview
7.3.2. Global 3D Printing Metals Market, By Application, 2021 vs 2030 (in%)
7.3.3. Global 3D Printing Metals Market, By Aerospace & Defense, 2017-2030 (US$ Mn)
7.3.4. Global 3D Printing Metals Market, By Automotive, 2017-2030 (US$ Mn)
7.3.5. Global 3D Printing Metals Market, By Medical & Dental, 2017-2030 (US$ Mn)
7.3.6. Global 3D Printing Metals Market, By Others, 2017-2030 (US$ Mn)
7.3.7.


8. North America 3D Printing Metals Market Analysis
8.1. North America 3D Printing Metals Market, by Form, 2017-2030(US$ Mn)
8.1.1. Overview
8.1.2. SRC Analysis
8.2. North America 3D Printing Metals Market, by Product, 2017-2030(US$ Mn)
8.2.1. Overview
8.2.2. SRC Analysis
8.3. North America 3D Printing Metals Market, by Application, 2017-2030(US$ Mn)
8.3.1. Overview
8.3.2. SRC Analysis
8.4. North America 3D Printing Metals Market, by Country, 2017-2030 (US$ Mn)
8.4.1. U.S.
8.4.1.1. U.S. 3D Printing Metals Market Estimates and Forecast, 2017-2030 (US$ Mn)
8.4.1.2. U.S. 3D Printing Metals, By Form, 2017-2030 (US$ Mn)
8.4.1.3. U.S. 3D Printing Metals, By Product, 2017-2030 (US$ Mn)
8.4.1.4. U.S. 3D Printing Metals, By Application, 2017-2030 (US$ Mn)
8.4.2. Canada
8.4.2.1. Canada 3D Printing Metals Market Estimates and Forecast, 2017-2030 (US$ Mn)
8.4.2.2. Canada 3D Printing Metals, By Form, 2017-2030 (US$ Mn)
8.4.2.3. Canada 3D Printing Metals, By Product, 2017-2030 (US$ Mn)
8.4.2.4. Canada 3D Printing Metals, By Application, 2017-2030 (US$ Mn)


9. Europe 3D Printing Metals Market Analysis
9.1. Europe 3D Printing Metals Market, by Form, 2017-2030(US$ Mn)
9.1.1. Overview
9.1.2. SRC Analysis
9.2. Europe 3D Printing Metals Market, by Product, 2017-2030(US$ Mn)
9.2.1. Overview
9.2.2. SRC Analysis
9.3. Europe 3D Printing Metals Market, by Application, 2017-2030(US$ Mn)
9.3.1. Overview
9.3.2. SRC Analysis

9.4. Europe 3D Printing Metals Market, by Country, 2017-2030 (US$ Mn)
9.4.1. Germany
9.4.1.1. Germany 3D Printing Metals Market Estimates and Forecast, 2017-2030 (US$ Mn)
9.4.1.2. Germany 3D Printing Metals, By Form, 2017-2030 (US$ Mn)
9.4.1.3. Germany 3D Printing Metals, By Product, 2017-2030 (US$ Mn)
9.4.1.4. Germany 3D Printing Metals, By Application, 2017-2030 (US$ Mn)

9.4.2. France
9.4.2.1. France 3D Printing Metals Market Estimates and Forecast, 2017-2030 (US$ Mn)
9.4.2.2. France 3D Printing Metals, By Form, 2017-2030 (US$ Mn)
9.4.2.3. France 3D Printing Metals, By Product, 2017-2030 (US$ Mn)
9.4.2.4. France 3D Printing Metals, By Application, 2017-2030 (US$ Mn)

9.4.3. UK
9.4.3.1. UK 3D Printing Metals Market Estimates and Forecast, 2017-2030 (US$ Mn)
9.4.3.2. UK 3D Printing Metals, By Form, 2017-2030 (US$ Mn)
9.4.3.3. UK 3D Printing Metals, By Product, 2017-2030 (US$ Mn)
9.4.3.4. UK 3D Printing Metals, By Application, 2017-2030 (US$ Mn)

9.4.4. Italy
9.4.4.1. Italy 3D Printing Metals Market Estimates and Forecast, 2017-2030 (US$ Mn)
9.4.4.2. Italy 3D Printing Metals, By Form, 2017-2030 (US$ Mn)
9.4.4.3. Italy 3D Printing Metals, By Product, 2017-2030 (US$ Mn)
9.4.4.4. Italy 3D Printing Metals, By Application, 2017-2030 (US$ Mn)

9.4.5. Spain
9.4.5.1. Spain 3D Printing Metals Market Estimates and Forecast, 2017-2030 (US$ Mn)
9.4.5.2. Spain 3D Printing Metals, By Form, 2017-2030 (US$ Mn)
9.4.5.3. Spain 3D Printing Metals, By Product, 2017-2030 (US$ Mn)
9.4.5.4. Spain 3D Printing Metals, By Application, 2017-2030 (US$ Mn)
9.4.6. Rest of Europe
9.4.6.1. Rest of Europe 3D Printing Metals Market Estimates and Forecast, 2017-2030 (US$ Mn)
9.4.6.2. Rest of Europe 3D Printing Metals, By Form, 2017-2030 (US$ Mn)
9.4.6.3. Rest of Europe 3D Printing Metals, By Product, 2017-2030 (US$ Mn)
9.4.6.4. Rest of Europe 3D Printing Metals, By Application, 2017-2030 (US$ Mn)


10. Asia Pacific 3D Printing Metals Market Analysis
10.1. Asia Pacific 3D Printing Metals Market, by Form, 2017-2030(US$ Mn)
10.1.1. Overview
10.1.2. SRC Analysis
10.2. Asia Pacific 3D Printing Metals Market, by Product, 2017-2030(US$ Mn)
10.2.1. Overview
10.2.2. SRC Analysis
10.3. Asia Pacific 3D Printing Metals Market, by Application, 2017-2030(US$ Mn)
10.3.1. Overview
10.3.2. SRC Analysis

10.4. Asia Pacific 3D Printing Metals Market, by Country, 2017-2030 (US$ Mn)
10.4.1. China
10.4.1.1. China 3D Printing Metals Market Estimates and Forecast, 2017-2030 (US$ Mn)
10.4.1.2. China 3D Printing Metals, By Form, 2017-2030 (US$ Mn)
10.4.1.3. China 3D Printing Metals, By Product, 2017-2030 (US$ Mn)
10.4.1.4. China 3D Printing Metals, By Application, 2017-2030 (US$ Mn)

10.4.2. Japan
10.4.2.1. Japan 3D Printing Metals Market Estimates and Forecast, 2017-2030 (US$ Mn)
10.4.2.2. Japan 3D Printing Metals, By Form, 2017-2030 (US$ Mn)
10.4.2.3. Japan 3D Printing Metals, By Product, 2017-2030 (US$ Mn)
10.4.2.4. Japan 3D Printing Metals, By Application, 2017-2030 (US$ Mn)

10.4.3. India
10.4.3.1. India 3D Printing Metals Market Estimates and Forecast, 2017-2030 (US$ Mn)
10.4.3.2. India 3D Printing Metals, By Form, 2017-2030 (US$ Mn)
10.4.3.3. India 3D Printing Metals, By Product, 2017-2030 (US$ Mn)
10.4.3.4. India 3D Printing Metals, By Application, 2017-2030 (US$ Mn)

10.4.4. South Korea
10.4.4.1. South Korea 3D Printing Metals Market Estimates and Forecast, 2017-2030 (US$ Mn)
10.4.4.2. South Korea 3D Printing Metals, By Form, 2017-2030 (US$ Mn)
10.4.4.3. South Korea 3D Printing Metals, By Product, 2017-2030 (US$ Mn)
10.4.4.4. South Korea 3D Printing Metals, By Application, 2017-2030 (US$ Mn)

10.4.5. South-East Asia
10.4.5.1. South-East Asia 3D Printing Metals Market Estimates and Forecast, 2017-2030 (US$ Mn)
10.4.5.2. South-East Asia 3D Printing Metals, By Form, 2017-2030 (US$ Mn)
10.4.5.3. South-East Asia 3D Printing Metals, By Product, 2017-2030 (US$ Mn)
10.4.5.4. South-East Asia 3D Printing Metals, By Application, 2017-2030 (US$ Mn)

10.4.6. Rest of Asia Pacific
10.4.6.1. Rest of Asia Pacific 3D Printing Metals Market Estimates and Forecast, 2017-2030 (US$ Mn)
10.4.6.2. Rest of Asia Pacific 3D Printing Metals, By Form, 2017-2030 (US$ Mn)
10.4.6.3. Rest of Asia Pacific 3D Printing Metals, By Product, 2017-2030 (US$ Mn)
10.4.6.4. Rest of Asia Pacific 3D Printing Metals, By Application, 2017-2030 (US$ Mn)


11. Latin America 3D Printing Metals Market Analysis
11.1. Latin America 3D Printing Metals Market, by Form, 2017-2030(US$ Mn)
11.1.1. Overview
11.1.2. SRC Analysis
11.2. Latin America 3D Printing Metals Market, by Product, 2017-2030(US$ Mn)
11.2.1. Overview
11.2.2. SRC Analysis
11.3. Latin America 3D Printing Metals Market, by Application, 2017-2030(US$ Mn)
11.3.1. Overview
11.3.2. SRC Analysis

11.4. Latin America 3D Printing Metals Market, by Country, 2017-2030 (US$ Mn)
11.4.1. Brazil
11.4.1.1. Brazil 3D Printing Metals Market Estimates and Forecast, 2017-2030 (US$ Mn)
11.4.1.2. Brazil 3D Printing Metals, By Form, 2017-2030 (US$ Mn)
11.4.1.3. Brazil 3D Printing Metals, By Product, 2017-2030 (US$ Mn)
11.4.1.4. Brazil 3D Printing Metals, By Application, 2017-2030 (US$ Mn)

11.4.2. Mexico
11.4.2.1. Mexico 3D Printing Metals Market Estimates and Forecast, 2017-2030 (US$ Mn)
11.4.2.2. Mexico 3D Printing Metals, By Form, 2017-2030 (US$ Mn)
11.4.2.3. Mexico 3D Printing Metals, By Product, 2017-2030 (US$ Mn)
11.4.2.4. Mexico 3D Printing Metals, By Application, 2017-2030 (US$ Mn)

11.4.3. Rest of Latin America
11.4.3.1. Rest of Latin America 3D Printing Metals Market Estimates and Forecast, 2017-2030 (US$ Mn)
11.4.3.2. Rest of Latin America 3D Printing Metals, By Form, 2017-2030 (US$ Mn)
11.4.3.3. Rest of Latin America 3D Printing Metals, By Product, 2017-2030 (US$ Mn)
11.4.3.4. Rest of Latin America 3D Printing Metals, By Application, 2017-2030 (US$ Mn)


12. Middle East and Africa 3D Printing Metals Market Analysis
12.1. Middle East and Africa 3D Printing Metals Market, by Form, 2017-2030(US$ Mn)
12.1.1. Overview
12.1.2. SRC Analysis
12.2. Middle East and Africa 3D Printing Metals Market, by Product, 2017-2030(US$ Mn)
12.2.1. Overview
12.2.2. SRC Analysis
12.3. Middle East and Africa 3D Printing Metals Market, by Application, 2017-2030(US$ Mn)
12.3.1. Overview
12.3.2. SRC Analysis

12.4. Middle East and Africa 3D Printing Metals Market, by Country, 2017-2030 (US$ Mn)
12.4.1. GCC Countries
12.4.1.1. GCC Countries il 3D Printing Metals Market Estimates and Forecast, 2017-2030 (US$ Mn)
12.4.1.2. GCC Countries 3D Printing Metals, By Form, 2017-2030 (US$ Mn)
12.4.1.3. GCC Countries 3D Printing Metals, By Product, 2017-2030 (US$ Mn)
12.4.1.4. GCC Countries 3D Printing Metals, By Application, 2017-2030 (US$ Mn)

12.4.2. South Africa
12.4.2.1. South Africa 3D Printing Metals Market Estimates and Forecast, 2017-2030 (US$ Mn)
12.4.2.2. South Africa 3D Printing Metals, By Form, 2017-2030 (US$ Mn)
12.4.2.3. South Africa 3D Printing Metals, By Product, 2017-2030 (US$ Mn)
12.4.2.4. South Africa 3D Printing Metals, By Application, 2017-2030 (US$ Mn)

12.4.3. Rest of Middle East and Africa
12.4.3.1. Rest of Middle East and Africa 3D Printing Metals Market Estimates and Forecast, 2017-2030 (US$ Mn)
12.4.3.2. Rest of Middle East and Africa 3D Printing Metals, By Form, 2017-2030 (US$ Mn)
12.4.3.3. Rest of Middle East and Africa 3D Printing Metals, By Product, 2017-2030 (US$ Mn)
12.4.3.4. Rest of Middle East and Africa 3D Printing Metals, By Application, 2017-2030 (US$ Mn)


13. Company Profiles
13.1. Arcam AB
13.1.1. Company Overview
13.1.2. Forms/Services Portfolio
13.1.3. Geographical Presence
13.1.4. Financial Summary
13.1.4.1. Market Revenue and Net Profit (2019-2022)
13.1.4.2. Business Segment Revenue Analysis
13.1.4.3. Geographical Revenue Analysis
13.2. ExOne GmbH
13.3. Carpenter Technology Corp.
13.4. Renishaw PLC
13.5. Materialise NV
13.6. 3D Systems Corp.
13.7. Voxeljet AG
13.8. Sandvik AB
13.9. Hoganas AB
13.10. GKN PLC
13.11. Others

List of Figures
FIG. 1 Global 3D Printing Metals Market: Research Methodology
FIG. 2 Market Size Estimation – Top Down & Bottom up Approach
FIG. 3 Global 3D Printing Metals Market Segmentation
FIG. 4 Global 3D Printing Metals Market, by Form, 2022 (US$ Mn)
FIG. 5 Global 3D Printing Metals Market, by Product, 2022 (US$ Mn)
FIG. 6 Global 3D Printing Metals Market, by Application, 2022 (US$ Mn)
FIG. 7 Global 3D Printing Metals Market, by Geography, 2022 (US$ Mn)
FIG. 8 Attractive Investment Proposition, by Form, 2022
FIG. 9 Attractive Investment Proposition, by Product, 2022
FIG. 10 Attractive Investment Proposition, by Application, 2022
FIG. 11 Attractive Investment Proposition, by Geography, 2022
FIG. 12 Global Market Share Analysis of Key 3D Printing Metals Market Manufacturers, 2022
FIG. 13 Global Market Positioning of Key 3D Printing Metals Market Manufacturers, 2022
FIG. 14 Global 3D Printing Metals Market Value Contribution, By Form, 2022 & 2030 (Value %)
FIG. 15 Global 3D Printing Metals Market, by Powder, Value, 2017-2030 (US$ Mn)
FIG. 16 Global 3D Printing Metals Market, by Filament, Value, 2017-2030 (US$ Mn)
FIG. 17 Global 3D Printing Metals Market Value Contribution, By Product, 2022 & 2030 (Value %)
FIG. 18 Global 3D Printing Metals Market, by Titanium, Value, 2017-2030 (US$ Mn)
FIG. 19 Global 3D Printing Metals Market, by Nickel, Value, 2017-2030 (US$ Mn)
FIG. 20 Global 3D Printing Metals Market, by Stainless Steel, Value, 2017-2030 (US$ Mn)
FIG. 21 Global 3D Printing Metals Market, by Aluminum, Value, 2017-2030 (US$ Mn)
FIG. 22 Global 3D Printing Metals Market, by Others, Value, 2017-2030 (US$ Mn)
FIG. 23 Global 3D Printing Metals Market Value Contribution, By Application, 2022 & 2030 (Value %)
FIG. 24 Global 3D Printing Metals Market, by Aerospace & Defense, Value, 2017-2030 (US$ Mn)
FIG. 25 Global 3D Printing Metals Market, by Automotive, Value, 2017-2030 (US$ Mn)
FIG. 26 Global 3D Printing Metals Market, by Medical & Dental, Value, 2017-2030 (US$ Mn)
FIG. 27 Global 3D Printing Metals Market, by Others, Value, 2017-2030 (US$ Mn)
FIG. 28 North America 3D Printing Metals Market, 2017-2030 (US$ Mn)
FIG. 29 U.S. 3D Printing Metals Market, 2017-2030 (US$ Mn)
FIG. 30 Canada 3D Printing Metals Market, 2017-2030 (US$ Mn)
FIG. 31 Europe 3D Printing Metals Market, 2017-2030 (US$ Mn)
FIG. 32 Germany 3D Printing Metals Market, 2017-2030 (US$ Mn)
FIG. 33 France 3D Printing Metals Market, 2017-2030 (US$ Mn)
FIG. 34 U.K. 3D Printing Metals Market, 2017-2030 (US$ Mn)
FIG. 35 Italy 3D Printing Metals Market, 2017-2030 (US$ Mn)
FIG. 36 Spain 3D Printing Metals Market, 2017-2030 (US$ Mn)
FIG. 37 Rest of Europe 3D Printing Metals Market, 2017-2030 (US$ Mn)
FIG. 38 Asia Pacific 3D Printing Metals Market, 2017-2030 (US$ Mn)
FIG. 39 China 3D Printing Metals Market, 2017-2030 (US$ Mn)
FIG. 40 Japan 3D Printing Metals Market, 2017-2030 (US$ Mn)
FIG. 41 India 3D Printing Metals Market, 2017-2030 (US$ Mn)
FIG. 42 South Korea 3D Printing Metals Market, 2017-2030 (US$ Mn)
FIG. 43 Southeast Asia 3D Printing Metals Market, 2017-2030 (US$ Mn)
FIG. 44 Rest of Asia Pacific 3D Printing Metals Market, 2017-2030 (US$ Mn)
FIG. 45 Latin America 3D Printing Metals Market, 2017-2030 (US$ Mn)
FIG. 46 Brazil 3D Printing Metals Market, 2017-2030 (US$ Mn)
FIG. 47 Mexico 3D Printing Metals Market, 2017-2030 (US$ Mn)
FIG. 48 Rest of Latin America 3D Printing Metals Market, 2017-2030 (US$ Mn)
FIG. 49 Middle East & Africa 3D Printing Metals Market, 2017-2030 (US$ Mn)
FIG. 50 GCC Countries 3D Printing Metals Market, 2017-2030 (US$ Mn)
FIG. 51 South Africa 3D Printing Metals Market, 2017-2030 (US$ Mn)
FIG. 52 Rest of Middle East and Africa 3D Printing Metals Market, 2017-2030 (US$ Mn)

List of Tables
TABLE 1 Market Snapshot: Global 3D Printing Metals Market
TABLE 2 Global 3D Printing Metals Market, by Competitive Benchmarking, 2022
TABLE 3 Global 3D Printing Metals Market, by Geographical Presence Analysis, 2022
TABLE 4 Global 3D Printing Metals Market, by Key Strategies Analysis, 2022
TABLE 5 Global 3D Printing Metals Market, by Form, 2017-2030 (US$ Mn)
TABLE 6 Global 3D Printing Metals Market, by Product, 2017-2030 (US$ Mn)
TABLE 7 Global 3D Printing Metals Market, by Application, 2017-2030 (US$ Mn)
TABLE 8 Global 3D Printing Metals Market, by Geography, 2017-2030 (US$ Mn)
TABLE 9 North America 3D Printing Metals Market, by Form, 2017-2030 (US$ Mn)
TABLE 10 North America 3D Printing Metals Market, by Product, 2017-2030 (US$ Mn)
TABLE 11 North America 3D Printing Metals Market, by Application, 2017-2030 (US$ Mn)
TABLE 12 North America 3D Printing Metals Market, by Country, 2017-2030 (US$ Mn)
TABLE 13 US 3D Printing Metals Market, by Form, 2017-2030 (US$ Mn)
TABLE 14 US 3D Printing Metals Market, by Product, 2017-2030 (US$ Mn)
TABLE 15 US 3D Printing Metals Market, by Application, 2017-2030 (US$ Mn)
TABLE 16 Canada 3D Printing Metals Market, by Form, 2017-2030 (US$ Mn)
TABLE 17 Canada 3D Printing Metals Market, by Product, 2017-2030 (US$ Mn)
TABLE 18 Canada 3D Printing Metals Market, by Application, 2017-2030 (US$ Mn)
TABLE 19 Europe 3D Printing Metals Market, by Form, 2017-2030 (US$ Mn)
TABLE 20 Europe 3D Printing Metals Market, by Product, 2017-2030 (US$ Mn)
TABLE 21 Europe 3D Printing Metals Market, by Application, 2017-2030 (US$ Mn)
TABLE 22 Europe 3D Printing Metals Market, by Country, 2017-2030 (US$ Mn)
TABLE 23 Germany 3D Printing Metals Market, by Form, 2017-2030 (US$ Mn)
TABLE 24 Germany 3D Printing Metals Market, by Product, 2017-2030 (US$ Mn)
TABLE 25 Germany 3D Printing Metals Market, by Application, 2017-2030 (US$ Mn)
TABLE 26 France 3D Printing Metals Market, by Form, 2017-2030 (US$ Mn)
TABLE 27 France 3D Printing Metals Market, by Product, 2017-2030 (US$ Mn)
TABLE 28 France 3D Printing Metals Market, by Application, 2017-2030 (US$ Mn)
TABLE 29 UK 3D Printing Metals Market, by Form, 2017-2030 (US$ Mn)
TABLE 30 UK 3D Printing Metals Market, by Product, 2017-2030 (US$ Mn)
TABLE 31 UK 3D Printing Metals Market, by Application, 2017-2030 (US$ Mn)
TABLE 32 Italy 3D Printing Metals Market, by Form, 2017-2030 (US$ Mn)
TABLE 33 Italy 3D Printing Metals Market, by Product, 2017-2030 (US$ Mn)
TABLE 34 Italy 3D Printing Metals Market, by Application, 2017-2030 (US$ Mn)
TABLE 35 Spain 3D Printing Metals Market, by Form, 2017-2030 (US$ Mn)
TABLE 36 Spain 3D Printing Metals Market, by Product, 2017-2030 (US$ Mn)
TABLE 37 Spain 3D Printing Metals Market, by Application, 2017-2030 (US$ Mn)
TABLE 38 Rest of Europe 3D Printing Metals Market, by Form, 2017-2030 (US$ Mn)
TABLE 39 Rest of Europe 3D Printing Metals Market, by Product, 2017-2030 (US$ Mn)
TABLE 40 Rest of Europe 3D Printing Metals Market, by Application, 2017-2030 (US$ Mn)
TABLE 41 Asia Pacific 3D Printing Metals Market, by Form, 2017-2030 (US$ Mn)
TABLE 42 Asia Pacific 3D Printing Metals Market, by Product, 2017-2030 (US$ Mn)
TABLE 43 Asia Pacific 3D Printing Metals Market, by Application, 2017-2030 (US$ Mn)
TABLE 44 Asia Pacific 3D Printing Metals Market, by Country, 2017-2030 (US$ Mn)
TABLE 45 China 3D Printing Metals Market, by Form, 2017-2030 (US$ Mn)
TABLE 46 China 3D Printing Metals Market, by Product, 2017-2030 (US$ Mn)
TABLE 47 China 3D Printing Metals Market, by Application, 2017-2030 (US$ Mn)
TABLE 48 Japan 3D Printing Metals Market, by Form, 2017-2030 (US$ Mn)
TABLE 49 Japan 3D Printing Metals Market, by Product, 2017-2030 (US$ Mn)
TABLE 50 Japan 3D Printing Metals Market, by Application, 2017-2030 (US$ Mn)
TABLE 51 India 3D Printing Metals Market, by Form, 2017-2030 (US$ Mn)
TABLE 52 India 3D Printing Metals Market, by Product, 2017-2030 (US$ Mn)
TABLE 53 India 3D Printing Metals Market, by Application, 2017-2030 (US$ Mn)
TABLE 54 South Korea 3D Printing Metals Market, by Form, 2017-2030 (US$ Mn)
TABLE 55 South Korea 3D Printing Metals Market, by Product, 2017-2030 (US$ Mn)
TABLE 56 South Korea 3D Printing Metals Market, by Application, 2017-2030 (US$ Mn)
TABLE 57 South East Asia 3D Printing Metals Market, by Form, 2017-2030 (US$ Mn)
TABLE 58 South East Asia 3D Printing Metals Market, by Product, 2017-2030 (US$ Mn)
TABLE 59 South East Asia 3D Printing Metals Market, by Application, 2017-2030 (US$ Mn)
TABLE 60 Rest of Asia Pacific 3D Printing Metals Market, by Form, 2017-2030 (US$ Mn)
TABLE 61 Rest of Asia Pacific 3D Printing Metals Market, by Product, 2017-2030 (US$ Mn)
TABLE 62 Rest of Asia Pacific 3D Printing Metals Market, by Application, 2017-2030 (US$ Mn)
TABLE 63 Latin America 3D Printing Metals Market, by Form, 2017-2030 (US$ Mn)
TABLE 64 Latin America 3D Printing Metals Market, by Product, 2017-2030 (US$ Mn)
TABLE 65 Latin America 3D Printing Metals Market, by Application, 2017-2030 (US$ Mn)
TABLE 66 Latin America 3D Printing Metals Market, by Country, 2017-2030 (US$ Mn)
TABLE 67 Brazil 3D Printing Metals Market, by Form, 2017-2030 (US$ Mn)
TABLE 68 Brazil 3D Printing Metals Market, by Product, 2017-2030 (US$ Mn)
TABLE 69 Brazil 3D Printing Metals Market, by Application, 2017-2030 (US$ Mn)
TABLE 70 Mexico 3D Printing Metals Market, by Form, 2017-2030 (US$ Mn)
TABLE 71 Mexico 3D Printing Metals Market, by Product, 2017-2030 (US$ Mn)
TABLE 72 Mexico 3D Printing Metals Market, by Application, 2017-2030 (US$ Mn)
TABLE 73 Rest of Latin America 3D Printing Metals Market, by Form, 2017-2030 (US$ Mn)
TABLE 74 Rest of Latin America 3D Printing Metals Market, by Product, 2017-2030 (US$ Mn)
TABLE 75 Rest of Latin America 3D Printing Metals Market, by Application, 2017-2030 (US$ Mn)
TABLE 76 Middle East and Africa 3D Printing Metals Market, by Form, 2017-2030 (US$ Mn)
TABLE 77 Middle East and Africa 3D Printing Metals Market, by Product, 2017-2030 (US$ Mn)
TABLE 78 Middle East and Africa 3D Printing Metals Market, by Application, 2017-2030 (US$ Mn)
TABLE 79 Middle East and Africa 3D Printing Metals Market, by Country, 2017-2030 (US$ Mn)
TABLE 80 GCC Countries 3D Printing Metals Market, by Form, 2017-2030 (US$ Mn)
TABLE 81 GCC Countries 3D Printing Metals Market, by Product, 2017-2030 (US$ Mn)
TABLE 82 GCC Countries 3D Printing Metals Market, by Application, 2017-2030 (US$ Mn)
TABLE 83 South Africa 3D Printing Metals Market, by Form, 2017-2030 (US$ Mn)
TABLE 84 South Africa 3D Printing Metals Market, by Product, 2017-2030 (US$ Mn)
TABLE 85 South Africa 3D Printing Metals Market, by Application, 2017-2030 (US$ Mn)
TABLE 86 Rest of Middle East and Africa 3D Printing Metals Market, by Form, 2017-2030 (US$ Mn)
TABLE 87 Rest of Middle East and Africa 3D Printing Metals Market, by Product, 2017-2030 (US$ Mn)
TABLE 88 Rest of Middle East and Africa 3D Printing Metals Market, by Application, 2017-2030 (US$ Mn)

Frequently Asked Questions:

How does COVID-19 Impact the global 3D Printing Metals market?

The COVID-19 pandemic has had a mixed impact on the global 3D printing metals market. On the one hand, the pandemic has disrupted global supply chains and caused a slowdown in industrial activity, leading to a decrease in demand for 3D printing metals. On the other hand, the pandemic has also highlighted the importance of local manufacturing and supply chain resilience, which has led to an increased interest in 3D printing as a way to produce critical parts and components locally.

Which is the leading region of the market for 3D Printing Metals?

North America accounted for the most heightened share in the global 3D Printing Metals market.

What are the key drivers for the growth of the 3D Printing Metals market?

Advancements in 3D printing technologies and materials, making it more efficient and cost-effective and Increasing adoption of 3D printing in various industries such as aerospace, automotive, healthcare, and manufacturing.

Which is the major segment in the 3D Printing Metals market by Form?

The Powder segment had a major share in the global market in 2022.

Which is the major segment in the 3D Printing Metals market by Product?

The Titanium segment had a major share in the global market.

Saudi Arabia Managed Security Services Market

Published:
Report ID: 36393

Microwave Oven Market

Published:
Report ID: 36314

Inkjet Coders Market

Published:
Report ID: 6669

Rich Communication Services Market

Published:
Report ID: 35774

Middle East and Africa Real-Time Payments Market

Published:
Report ID: 35770

Vietnam Managed Security Services (MSS) Market

Published:
Report ID: 35766

Middle East and Africa EdTech and Smart Classroom Market

Published:
Report ID: 35756

Digital Business Support System (DBSS) Market

Published:
Report ID: 35732

China Artificial Intelligence (AI) Market

Published:
Report ID: 35729

Asia-Pacific Workforce Management Software Market

Published:
Report ID: 35719

Mobile Wallet Market

Published:
Report ID: 8977

Recirculating Chillers Market

Published:
Report ID: 8862

Purchase Options

$2999
Delivery Format: Excel.
$4999
Designed for the individual purchaser.
$6999
Users located at a single corporate site or regional office.
$7999
Allowed for unlimited sharing globally within one company.
Smallform of Sample request

Have a question?

User Profile

Don’t settle for less – trust Mitul to help you find the best solution.

Report delivery within 24 to 48 hours

– Other Info –

What people say?-

User Review

I am very impressed with the information in this report. The author clearly did their research when they came up with this product and it has already given me a lot of ideas.

Jana Schmidt
CEDAR CX Technologies

– Connect with us –

Phone

+91 6232 49 3207


support

24/7 Research Support


sales@credenceresearch.com

– Research Methodology –

Going beyond the basics: advanced techniques in research methodology

– Trusted By –

Pepshi, LG, Nestle
Motorola, Honeywell, Johnson and johnson
LG Chem, SIEMENS, Pfizer
Unilever, Samsonite, QIAGEN