Home » Advanced Materials » Water Infrastructure and Repair Technology (WIRT) Market

Water Infrastructure and Repair Technology (WIRT) Market By Type (Drinking Water Infrastructure, Wastewater Infrastructure); By Technology (Remote Assessment and Monitoring, Pipe Repair [Open and Cut], Spot Assessment and Repair, Trenchless Pipe Repair); By End Use (Residential, Commercial) – Growth, Share, Opportunities & Competitive Analysis, 2024 – 2032

Report ID: 14568 | Report Format : Excel, PDF

Market overview

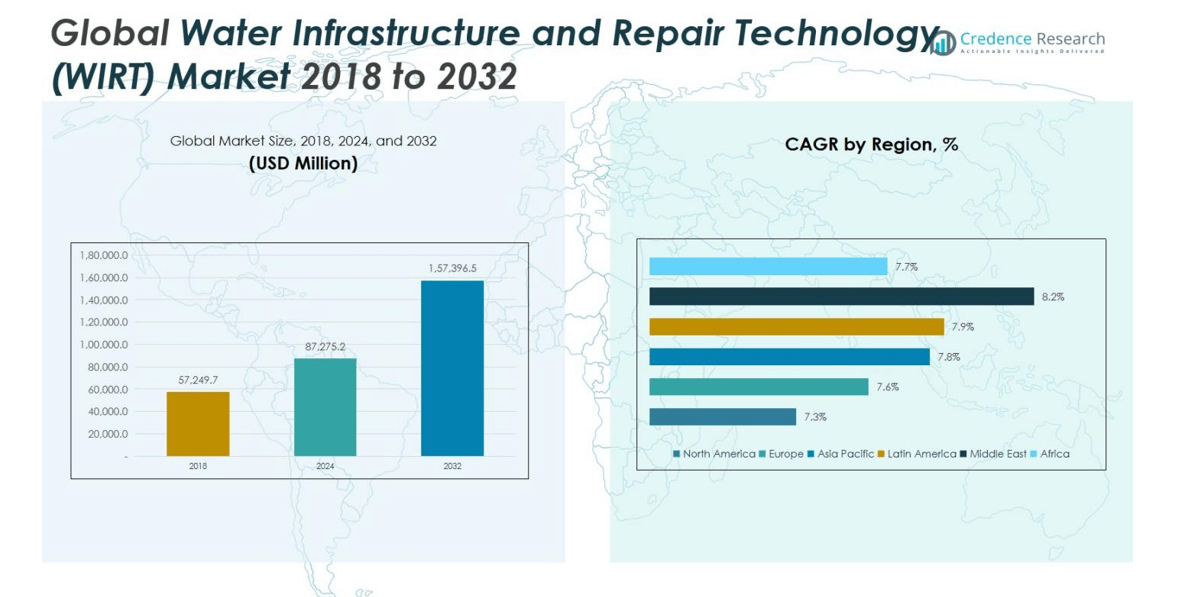
The Global Water Infrastructure and Repair Technology (WIRT) Market was valued at USD 57,249.7 million in 2018, reaching USD 87,275.2 million in 2024. It is anticipated to grow to USD 157,396.5 million by 2032, expanding at a CAGR of 7.70% during the forecast period.

REPORT ATTRIBUTE DETAILS
Historical Period 2020-2023
Base Year 2024
Forecast Period 2025-2032
Water Infrastructure and Repair Technology (WIRT) Market Size 2024 USD 87,275.2 million
Water Infrastructure and Repair Technology (WIRT) Market, CAGR 7.70%
Water Infrastructure and Repair Technology (WIRT) Market Size 2032 USD 157,396.5 million

The Global Water Infrastructure and Repair Technology (WIRT) Market features leading players such as 3M Company, Veolia Water Technologies & Solutions, Core & Main Inc., Xylem Inc., Kurita Water Industries Ltd., Mueller Water Products Inc. and Aegion Corporation, each leveraging broad product portfolios and global service networks. The market is regionally led by the Asia Pacific region, which holds approximately 22% share, followed by Europe at 14%, and North America with around 11%. These regions attract strong investment due to urbanisation, regulatory pressures and infrastructure renewal programmes that drive demand for advanced repair technologies and digital water solutions.

Water Infrastructure and Repair Technology (WIRT) Market Market size

Market Insights

  • The Global Water Infrastructure and Repair Technology (WIRT) Market was valued at USD 87,275.2 million in 2024 and is expected to reach USD 157,396.5 million by 2032, growing at a CAGR of 7.70%.
  • The market is primarily driven by rapid urbanization, population growth, and stringent environmental regulations pushing the need for infrastructure upgrades and maintenance.
  • Key trends include the growing adoption of smart water management systems, digital monitoring, and sustainable repair solutions like trenchless pipe repair and IoT-based technologies.
  • Major players in the market include 3M Company, Veolia Water Technologies & Solutions, Xylem Inc., and Mueller Water Products Inc., with ongoing mergers and acquisitions to expand global reach.
  • Regionally, Asia Pacific leads with 22% market share, followed by Europe at 14% and North America at 11%, driven by infrastructure renewal programs and regulatory mandates across urban centers.

Access crucial information at unmatched prices!

Request your sample report today & start making informed decisions powered by Credence Research Inc.!

Download Sample

Market Segmentation Analysis:

By Type

The Drinking Water Infrastructure segment leads the WIRT market, holding 60% market share, driven by the need to upgrade aging water distribution systems and comply with stricter quality regulations. Urbanization, population growth, and water stress are the key growth drivers, pushing investments in smart, corrosion-resistant, and retrofitted systems. Wastewater Infrastructure, capturing 40% of the market, is also expanding rapidly due to increasing environmental regulations and the need for resilient sewer systems. Growing urban populations and stricter regulations continue to fuel demand for repairs and upgrades in both potable water and wastewater infrastructure.

  • For instance, Xylem Inc., which introduced smart monitoring systems equipped with real-time leak detection that have helped municipalities reduce water loss by up to 15%.

By Technology

In terms of technology, Remote Assessment and Monitoring dominates with a 40% share, fueled by the need for real-time data and minimal-disruption inspections, especially for buried pipelines. Trenchless Pipe Repair, with 30% share, is also gaining traction for its non-invasive methods, reducing the costs and environmental impact of traditional excavation techniques. Other technologies like Spot Assessment and Repair and Pipe Repair (Open and Cut) follow, with 20% and 10% share respectively, focused on smaller-scale repairs or full replacements in high-risk areas.

  • For instance, ExxonMobil uses drones and ultrasonic smart sensors to detect corrosion and pressure anomalies along pipeline networks, enhancing safety and inspection efficiency.

By End Use

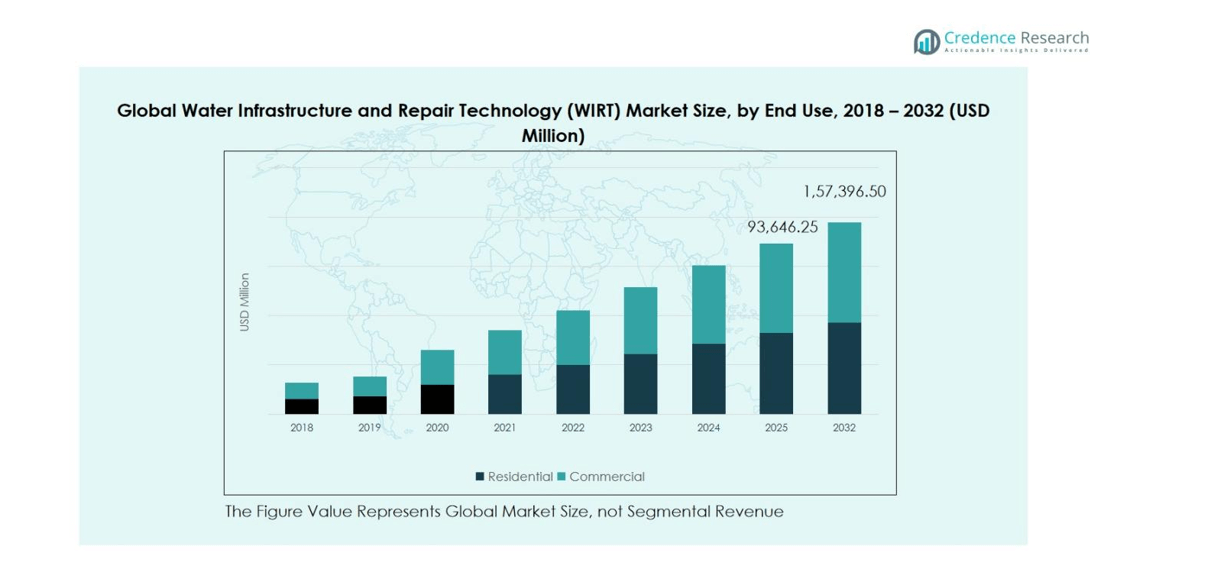
In the end-use segment, Residential applications lead with 65% share, driven by the expansion of urban housing and retrofitting of older infrastructure. This segment benefits from growing consumer awareness of water conservation and leak detection technologies. The Commercial segment holds 35% share, fueled by corporate sustainability initiatives and regulatory pressures for continuous service, especially in sectors like healthcare and hospitality. Water infrastructure repairs in commercial establishments increasingly include smart monitoring and maintenance contracts.

Key Growth Drivers

Urbanization and Population Growth

Rapid urbanization and the increasing global population are driving the demand for robust water infrastructure and repair technologies. As more people move into cities, existing water systems face pressure to expand and maintain service levels. This results in greater investments in upgrading aging infrastructure and the development of resilient water systems that can cope with higher demand and more frequent service interruptions. Urban areas require advanced solutions to address infrastructure challenges, thereby boosting the adoption of innovative repair technologies, such as smart meters, trenchless repairs, and remote monitoring.

  • For instance, the Water Infrastructure Modernization Act of 2025 in the U.S. promotes real-time monitoring, AI analytics, and advanced metering to upgrade aging water systems and improve management.

Stricter Environmental Regulations

Governments worldwide are enforcing stricter environmental regulations that mandate the upgrade and maintenance of water infrastructure. These regulations are focused on water quality, resource conservation, and reducing environmental pollution, which directly impacts the demand for advanced repair technologies. As utilities face penalties for non-compliance, the push to adopt modern repair methods, such as trenchless pipe repairs and advanced monitoring systems, has grown. These technologies offer cost-effective, environmentally friendly solutions, allowing utilities to meet regulatory demands while maintaining operational efficiency.

  • For instance, the European Union’s Water Framework Directive compels member states to restore water bodies to “good ecological status,” leading cities like Copenhagen to deploy smart leak detection systems from companies such as Siemens for continuous monitoring.

Technological Advancements

Ongoing technological advancements in water infrastructure and repair technologies are one of the key drivers of market growth. Innovations like IoT-based sensors, AI-powered monitoring systems, and data analytics are transforming how water networks are assessed and maintained. These technologies enable real-time monitoring of water quality, pressure, and leakage, helping utilities predict failures before they occur. As these technologies become more affordable and accessible, the global adoption of advanced repair methods and preventive maintenance practices is expected to rise, leading to greater efficiency and reduced operational costs for utilities.

Water Infrastructure and Repair Technology (WIRT) Market Market share

Key Trends & Opportunities

Smart Water Management Systems

The growing trend towards digitalization and smart water management is creating significant opportunities within the WIRT market. Utilities are increasingly adopting AI, machine learning, and IoT to monitor water usage, detect leaks, and predict maintenance needs. These systems enhance operational efficiency, reduce water wastage, and improve overall system performance. As cities and utilities modernize their infrastructure, there is a considerable opportunity for companies that provide smart solutions to water infrastructure, especially in regions with aging systems or those dealing with water scarcity.

  • For instance, The Talbot Collection Hotels in Ireland reduced water wastage by 77%, saving 36.5 million liters annually and €91,000 in costs, with SMART FLOW’s advanced monitoring identifying hidden leaks and inefficiencies.

Focus on Sustainability and Green Solutions

Sustainability is becoming a central theme in the water infrastructure sector, with a rising emphasis on eco-friendly and energy-efficient repair solutions. There is increasing demand for trenchless repair technologies that minimize environmental disruption, as well as for water reuse and recycling systems that contribute to resource conservation. This shift toward green solutions provides significant growth opportunities for companies offering technologies that reduce water loss, enhance system longevity, and minimize the environmental impact of water infrastructure maintenance.

  • For instance, Zeoturb offers an NSF-certified natural bio-organic liquid flocculant used in municipal and industrial water treatment, which reduces sludge volumes by up to 30%, providing an eco-friendly alternative to conventional chemicals.

Key Challenges

High Installation and Maintenance Costs

One of the main challenges in the WIRT market is the high initial costs associated with advanced water infrastructure repair technologies, including trenchless repairs and smart monitoring systems. Although these solutions offer long-term benefits, the upfront capital investment required can be a barrier for utilities, especially in developing regions or municipalities with limited budgets. Additionally, the costs of ongoing maintenance, training, and integration with existing systems can further hinder the widespread adoption of these advanced technologies.

Aging Infrastructure and Resource Constraints

Aging water infrastructure is a persistent challenge that limits the effectiveness of water repair technologies. Many cities worldwide still rely on outdated piping systems that are prone to frequent failures, leaks, and inefficiencies. The need for constant repairs and upgrades, combined with limited financial resources, creates a significant hurdle for utilities trying to implement advanced technologies. This issue is particularly pronounced in regions where funding for infrastructure renewal is insufficient, leading to continued reliance on older, less efficient repair methods.

Regional Analysis

North America

The North American Water Infrastructure and Repair Technology (WIRT) Market was valued at USD 10,820.19 million in 2018, grew to USD 16,165.85 million in 2024, and is projected to reach USD 28,362.85 million by 2032, at a CAGR of 7.3%. Holding 11% of the global market share in 2024, the region is propelled by aging pipelines, regulatory mandates for water quality, and widespread investment in smart‑water solutions. Utilities in the U.S. and Canada increasingly adopt IoT‑enabled monitoring, leak detection, and refurbishment technologies to extend asset life and reduce non‑revenue water.

Europe

In Europe, the WIRT market was valued at USD 13,808.62 million in 2018, reached USD 20,923.60 million in 2024, and is forecasted to grow to USD 37,428.89 million by 2032, representing a CAGR of 7.6%. The region captured 14% of the global market share in 2024. Growth is driven by stringent EU regulations on water‑infrastructure renewal, urban‑system resilience programmes, and infrastructure modernisation initiatives in the U.K., Germany, and France. Demand for trenchless repair and digital monitoring technologies remains robust as cities retrofit and upgrade ageing networks.

Asia Pacific

The Asia Pacific market stood at USD 21,497.25 million in 2018, increased to USD 32,977.54 million in 2024, and is projected to hit USD 59,968.07 million by 2032, at a CAGR of 7.8%. Commanding 22% of global market share in 2024, this region benefits from rapid urbanisation, large‑scale infrastructure investments in China, India, and Southeast Asia, and persistent water‑stress challenges. Governments and utilities are turning to advanced repair solutions, such as smart‑monitoring systems and trenchless renewal, to address both service reliability and sustainability objectives.

Latin America

In Latin America, the WIRT market valued at USD 6,171.51 million in 2018 rose to USD 9,494.29 million in 2024 and is estimated to reach USD 17,329.36 million by 2032, achieving a CAGR of 7.9%. The region held 6% of the global market share in 2024. Growth is supported by urban infrastructure expansion, rising water‑supply and sanitation initiatives in Brazil and Mexico, and increased private‑public investment in modern repair technologies aimed at reducing leakages and improving network performance.

Middle East

The Middle East market was USD 3,881.53 million in 2018, grew to USD 6,085.57 million in 2024, and is expected to reach USD 11,379.77 million by 2032, representing a CAGR of 8.2%. Accounting for 4% of the global share in 2024, growth here is fueled by severe water‑scarcity conditions, major desalination and pipeline‑renewal programmes, and government focus on resilient water networks. Gulf Cooperation Council (GCC) states and other arid‑region economies are investing heavily in smart repair and monitoring solutions to optimise scarce resources.

Africa

Africa’s WIRT market grew from USD 1,070.57 million in 2018 to USD 1,628.31 million in 2024, and is projected to reach USD 2,927.57 million by 2032, with a CAGR of 7.7%. The region represented about 1% of the global market share in 2024. Key drivers include urban‑population growth, infrastructure‑renewal needs in South Africa and Egypt, and external funding for water‑system upgrades. Providers of quick‑deployment repair technologies and digital‑monitoring solutions are increasingly active in this underserved region as utilities seek to improve service reliability.

Water Infrastructure and Repair Technology (WIRT) Market Market segmentation

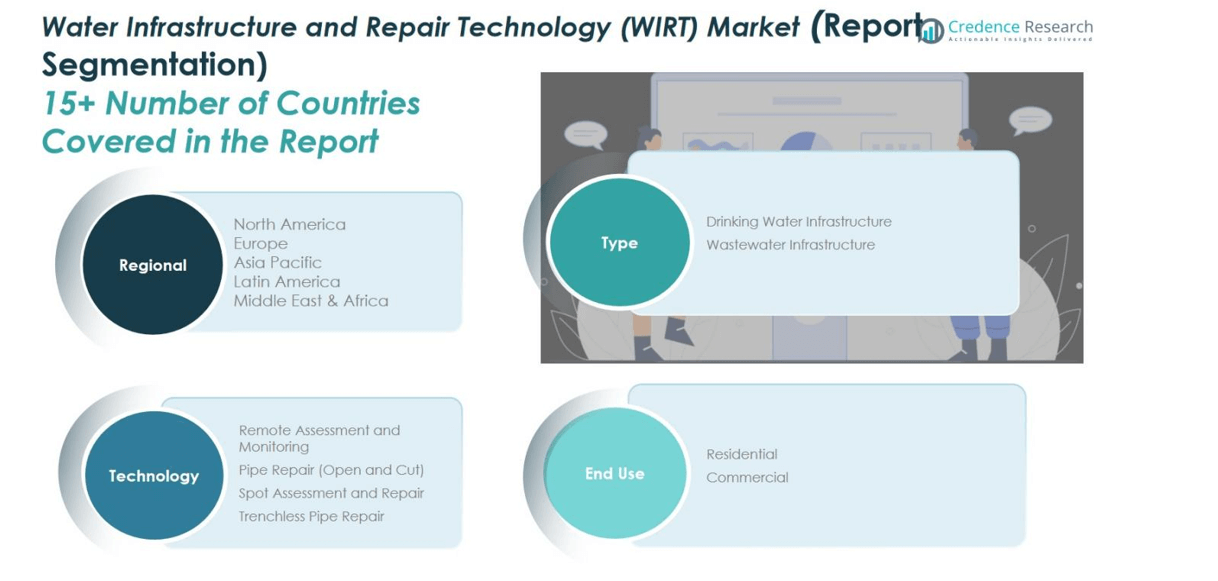
Market Segmentations:

By Type:

  • Drinking Water Infrastructure
  • Wastewater Infrastructure

By Technology:

  • Remote Assessment and Monitoring
  • Pipe Repair (Open and Cut)
  • Spot Assessment and Repair
  • Trenchless Pipe Repair

By End Use:

  • Residential
  • Commercial

 By Geography

  • North America
    • U.S.
    • Canada
    • Mexico
  • Europe
    • Germany
    • France
    • U.K.
    • Italy
    • Spain
    • Rest of Europe
  • Asia Pacific
    • China
    • Japan
    • India
    • South Korea
    • South-east Asia
    • Rest of Asia Pacific
  • Latin America
    • Brazil
    • Argentina
    • Rest of Latin America
  • Middle East & Africa
    • GCC Countries
    • South Africa
    • Rest of the Middle East and Africa

Competitive Landscape

The global Water Infrastructure and Repair Technology (WIRT) market is led by companies such as 3M Company, Veolia Water Technologies & Solutions, Core & Main Inc., Xylem Inc., Kurita Water Industries Ltd., Mueller Water Products Inc. and Aegion Corporation. These organisations compete on the basis of broad service portfolios, geographic reach, technological innovation, and strategic partnerships. They are investing in remote monitoring sensors, trenchless rehabilitation methods, and smart‑water analytics to stay ahead. Smaller niche firms are also gaining traction by offering specialist solutions such as robotic inspection and leak‑detection platforms, forcing larger players to diversify their offerings. Consolidation through mergers and acquisitions is growing, with major players acquiring regional specialists to bolster service footprints and enter emerging markets. As utilities push for reduction in water loss and more efficient asset management, competition is intensifying around digital‑enabled solutions and lifecycle services.

Shape Your Report to Specific Countries or Regions & Enjoy 30% Off!

Key Player Analysis

  • 3M
  • Aclara Technology LLC
  • Veolia Water Technologies & Solutions
  • Core & Main Inc.
  • Kurita Water Industries Ltd.
  • Mueller Water Products Inc.
  • Aegion Corporation
  • GE Water & Process Technologies
  • Aqua Innovative Solutions Pvt Ltd.
  • Other Key Players

Recent Developments

  • In February 2025, Veolia Water Technologies & Solutions partnered with ADNOC to optimise water‑management across industrial sites, focusing on flow monitoring and consumption reduction.
  • In September 2025, Xylem Inc. and Amazon announced a partnership to deploy smart‑water upgrades in Mexico, aimed at saving more than 1.3 billion litres of water annually in urban systems.
  • In June 2024, Azuria Corporation acquired Infrastructure Services Group LLC (ISG) and its partner companies including Mr. Rehab LLC, Green Mountain Pipeline Services LLC, and Inland Waters LLC, to enhance its water and wastewater infrastructure inspection and rehabilitation services.
  • In June 2025, CRH Ventures (venture arm of CRH plc) invested in VODA.ai (Series A) to support their AI‑driven platform for managing aging water infrastructure and pipe‑condition risk across utilities.

Report Coverage

The research report offers an in-depth analysis based on Type, Technology, End Use and Geography. It details leading market players, providing an overview of their business, product offerings, investments, revenue streams, and key applications. Additionally, the report includes insights into the competitive environment, SWOT analysis, current market trends, as well as the primary drivers and constraints. Furthermore, it discusses various factors that have driven market expansion in recent years. The report also explores market dynamics, regulatory scenarios, and technological advancements that are shaping the industry. It assesses the impact of external factors and global economic changes on market growth. Lastly, it provides strategic recommendations for new entrants and established companies to navigate the complexities of the market.

Future Outlook

  1. Adoption of AI‑driven predictive analytics will enable utilities to forecast pipeline failures before they occur.
  2. Expansion of trenchless repair techniques will accelerate, especially in dense urban areas seeking minimal disruption.
  3. Deployment of IoT‑based sensors across distribution networks will become standard for real‑time monitoring and leak detection.
  4. Integration of digital twin models for water infrastructure assets will support lifecycle management and optimise maintenance strategies.
  5. Increasing investment in water reuse and recycling systems will drive demand for advanced repair technologies in wastewater networks.
  6. Governments in emerging economies will escalate funding for water infrastructure renewal, driving regional market growth.
  7. Public‑private partnerships will proliferate, enabling faster roll‑out of advanced repair solutions in underserved regions.
  8. Sustainability mandates and carbon‑reduction targets will shift preference to eco‑friendly repair methods and materials.
  9. Retrofit opportunities in ageing networks will intensify, compelling utilities to replace or repair legacy assets with smart technologies.
  10. Consolidation among technology vendors will increase as companies acquire complementary service capabilities and expand global reach.

CHAPTER NO. 1 :   GENESIS OF THE MARKET       

1.1 Market Prelude – Introduction & Scope

1.2 The Big Picture – Objectives & Vision

1.3 Strategic Edge – Unique Value Proposition

1.4 Stakeholder Compass – Key Beneficiaries       

CHAPTER NO. 2 :   EXECUTIVE LENS

2.1 Pulse of the Industry – Market Snapshot

2.2 Growth Arc – Revenue Projections (USD Million)      

2.3. Premium Insights – Based on Primary Interviews  

CHAPTER NO. 3 :   WATER INFRASTRUCTURE AND REPAIR TECHNOLOGY (WIRT) MARKET FORCES & INDUSTRY PULSE

3.1 Foundations of Change – Market Overview
3.2 Catalysts of Expansion – Key Market Drivers
3.2.1 Momentum Boosters – Growth Triggers
3.2.2 Innovation Fuel – Disruptive Technologies
3.3 Headwinds & Crosswinds – Market Restraints
3.3.1 Regulatory Tides – Compliance Challenges
3.3.2 Economic Frictions – Inflationary Pressures
3.4 Untapped Horizons – Growth Potential & Opportunities
3.5 Strategic Navigation – Industry Frameworks
3.5.1 Market Equilibrium – Porter’s Five Forces
3.5.2 Ecosystem Dynamics – Value Chain Analysis
3.5.3 Macro Forces – PESTEL Breakdown

CHAPTER NO. 4 : KEY INVESTMENT EPICENTER 

4.1 Regional Goldmines – High-Growth Geographies

4.2 Product Frontiers – Lucrative Type Categories

4.3 End Use Sweet Spots – Emerging Demand Segments    

CHAPTER NO. 5: REVENUE TRAJECTORY & WEALTH MAPPING

5.1 Momentum Metrics – Forecast & Growth Curves

5.2 Regional Revenue Footprint – Market Share Insights

5.3 Segmental Wealth Flow – Type, Technology, and End Use Revenue

CHAPTER NO. 6 : TRADE & COMMERCE ANALYSIS         

6.1.      Import Analysis By Region   

6.1.1.   Global Water Infrastructure and Repair Technology (WIRT) Market Import Revenue By Region

6.2.      Export Analysis By Region   

6.2.1.   Global Water Infrastructure and Repair Technology (WIRT) Market Export Revenue By Region

CHAPTER NO. 7 :   COMPETITION ANALYSIS         

7.1.      Company Market Share Analysis      

7.1.1.   Global Water Infrastructure and Repair Technology (WIRT) Market: Company Market Share

7.2.      Global Water Infrastructure and Repair Technology (WIRT) Market Company Revenue Market Share

7.3.      Strategic Developments        

7.3.1.   Acquisitions & Mergers        

7.3.2.   New Product Launch

7.3.3.   Regional Expansion

7.4.      Competitive Dashboard

7.5.      Company Assessment Metrics, 2024

CHAPTER NO. 8 : WATER INFRASTRUCTURE AND REPAIR TECHNOLOGY (WIRT) MARKET – BY TYPE SEGMENT ANALYSIS

8.1.      Water Infrastructure and Repair Technology (WIRT) Market Overview By Type Segment

8.1.1.   Water Infrastructure and Repair Technology (WIRT) Market Revenue Share By Type

8.2.       Drinking Water Infrastructure

8.3.       Wastewater Infrastructure

CHAPTER NO. 9 : WATER INFRASTRUCTURE AND REPAIR TECHNOLOGY (WIRT) MARKET – BY TECHNOLOGY SEGMENT ANALYSIS

9.1.      Water Infrastructure and Repair Technology (WIRT) Market Overview By Technology Segment

9.1.1.   Water Infrastructure and Repair Technology (WIRT) Market Revenue Share By Technology

9.2.      Remote Assessment and Monitoring

9.3.     Pipe Repair (Open and Cut)

9.4.    Spot Assessment and Repair

9.5.    Trenchless Pipe Repair

CHAPTER NO. 10 : WATER INFRASTRUCTURE AND REPAIR TECHNOLOGY (WIRT) MARKET – BY END USE SEGMENT ANALYSIS

10.1.    Water Infrastructure and Repair Technology (WIRT) Market Overview By End Use Segment

10.1.1. Water Infrastructure and Repair Technology (WIRT) Market Revenue Share By End Use

10.2.    Residential

10.3.    Commercial

CHAPTER NO. 11 : WATER INFRASTRUCTURE AND REPAIR TECHNOLOGY (WIRT) MARKET – REGIONAL ANALYSIS

11.1.    Water Infrastructure and Repair Technology (WIRT) Market Overview By Region Segment

11.1.1. Global Water Infrastructure and Repair Technology (WIRT) Market Revenue Share By Region

10.1.2. Regions          

11.1.3. Global Water Infrastructure and Repair Technology (WIRT) Market Revenue By Region      

11.1.4. Type   

11.1.5. Global Water Infrastructure and Repair Technology (WIRT) Market Revenue By Type

11.1.6. Technology

11.1.7. Global Water Infrastructure and Repair Technology (WIRT) Market Revenue By Technology

11.1.8. End Use

11.1.9. Global Water Infrastructure and Repair Technology (WIRT) Market Revenue By End Use

CHAPTER NO. 12 : NORTH AMERICA WATER INFRASTRUCTURE AND REPAIR TECHNOLOGY (WIRT) MARKET – COUNTRY ANALYSIS

12.1.    North America Water Infrastructure and Repair Technology (WIRT) Market Overview By Country Segment

12.1.1. North America Water Infrastructure and Repair Technology (WIRT) Market Revenue Share By Region

12.2.    North America

12.2.1. North America Water Infrastructure and Repair Technology (WIRT) Market Revenue By Country

12.2.2. Type

12.2.3. North America Water Infrastructure and Repair Technology (WIRT) Market Revenue By Type

12.2.4. Technology

12.2.5. North America Water Infrastructure and Repair Technology (WIRT) Market Revenue By Technology

12.2.6. End Use

12.2.7. North America Water Infrastructure and Repair Technology (WIRT) Market Revenue By End Use

12.3.    U.S.    

12.4.    Canada           

12.5.    Mexico           

CHAPTER NO. 13 : EUROPE WATER INFRASTRUCTURE AND REPAIR TECHNOLOGY (WIRT) MARKET – COUNTRY ANALYSIS

13.1.    Europe Water Infrastructure and Repair Technology (WIRT) Market Overview By Country Segment

13.1.1. Europe Water Infrastructure and Repair Technology (WIRT) Market Revenue Share By Region

13.2.    Europe

13.2.1. Europe Water Infrastructure and Repair Technology (WIRT) Market Revenue By Country

13.2.2. Type   

13.2.3. Europe Water Infrastructure and Repair Technology (WIRT) Market Revenue By Type

13.2.4. Technology

13.2.5. Europe Water Infrastructure and Repair Technology (WIRT) Market Revenue By Technology

13.2.6. End Use

13.2.7. Europe Water Infrastructure and Repair Technology (WIRT) Market Revenue By End Use

13.3.    UK     

13.4.    France

13.5.    Germany        

13.6.    Italy   

13.7.    Spain  

13.8.    Russia

13.9.    Rest of Europe           

CHAPTER NO. 14 : ASIA PACIFIC WATER INFRASTRUCTURE AND REPAIR TECHNOLOGY (WIRT) MARKET – COUNTRY ANALYSIS

14.1.    Asia Pacific Water Infrastructure and Repair Technology (WIRT) Market Overview By Country Segment

14.1.1. Asia Pacific Water Infrastructure and Repair Technology (WIRT) Market Revenue Share By Region

14.2.    Asia Pacific   

14.2.1. Asia Pacific Water Infrastructure and Repair Technology (WIRT) Market Revenue By Country

14.2.2. Type

14.2.3. Asia Pacific Water Infrastructure and Repair Technology (WIRT) Market Revenue By Type

14.2.4. Technology

14.2.5. Asia Pacific Water Infrastructure and Repair Technology (WIRT) Market Revenue By Technology

14.2.6. End Use

14.2.7. Asia Pacific Water Infrastructure and Repair Technology (WIRT) Market Revenue By End Use

14.3.    China 

14.4.    Japan  

14.5.    South Korea   

14.6.    India   

14.7.    Australia        

14.8.    Southeast Asia

14.9.    Rest of Asia Pacific

CHAPTER NO. 15 : LATIN AMERICA WATER INFRASTRUCTURE AND REPAIR TECHNOLOGY (WIRT) MARKET – COUNTRY ANALYSIS

15.1.    Latin America Water Infrastructure and Repair Technology (WIRT) Market Overview By Country Segment

15.1.1. Latin America Water Infrastructure and Repair Technology (WIRT) Market Revenue Share By Region

15.2.    Latin America

15.2.1. Latin America Water Infrastructure and Repair Technology (WIRT) Market Revenue By Country

15.2.2. Type

15.2.3. Latin America Water Infrastructure and Repair Technology (WIRT) Market Revenue By Type

15.2.4. Technology

15.2.5. Latin America Water Infrastructure and Repair Technology (WIRT) Market Revenue By Technology

15.2.6. End Use        

15.2.7. Latin America Water Infrastructure and Repair Technology (WIRT) Market Revenue By End Use

15.3.    Brazil 

15.4.    Argentina       

15.5.    Rest of Latin America

CHAPTER NO. 16 : MIDDLE EAST WATER INFRASTRUCTURE AND REPAIR TECHNOLOGY (WIRT) MARKET – COUNTRY ANALYSIS

16.1.    Middle East Water Infrastructure and Repair Technology (WIRT) Market Overview By Country Segment

16.1.1. Middle East Water Infrastructure and Repair Technology (WIRT) Market Revenue Share By Region

16.2.    Middle East   

16.2.1. Middle East Water Infrastructure and Repair Technology (WIRT) Market Revenue By Country

16.2.2. Type   

16.2.3. Middle East Water Infrastructure and Repair Technology (WIRT) Market Revenue By Type

16.2.4. Technology

16.2.5. Middle East Water Infrastructure and Repair Technology (WIRT) Market Revenue By Technology

16.2.6. End Use

16.2.7. Middle East Water Infrastructure and Repair Technology (WIRT) Market Revenue By End Use

16.3.    GCC Countries          

16.4.    Israel

16.5.    Turkey

16.6.    Rest of Middle East   

CHAPTER NO. 17 : AFRICA WATER INFRASTRUCTURE AND REPAIR TECHNOLOGY (WIRT) MARKET – COUNTRY ANALYSIS

17.1.    Africa Water Infrastructure and Repair Technology (WIRT) Market Overview By Country Segment

17.1.1. Africa Water Infrastructure and Repair Technology (WIRT) Market Revenue Share By Region

17.2.    Africa

17.2.1. Africa Water Infrastructure and Repair Technology (WIRT) Market Revenue By Country

17.2.2. Type   

17.2.3. Africa Water Infrastructure and Repair Technology (WIRT) Market Revenue By Type

17.2.4. Technology

17.2.5. Africa Water Infrastructure and Repair Technology (WIRT) Market Revenue By Technology

17.2.6. End Use

17.2.7. Africa Water Infrastructure and Repair Technology (WIRT) Market Revenue By End Use

17.3.    South Africa

17.4.    Egypt 

17.5.    Rest of Africa

CHAPTER NO. 18 : COMPANY PROFILES      

18.1.    3M

18.1.1. Company Overview   

18.1.2. Product Portfolio       

18.1.3. Financial Overview   

18.1.4. Recent Developments

18.1.5. Growth Strategy        

18.1.6. SWOT Analysis         

18.2.    Aclara Technology LLC

18.3.   Veolia Water Technologies & Solutions

18.4.   Core & Main Inc.

18.5.   Kurita Water Industries Ltd.

18.6.   Mueller Water Products Inc.

18.7.   Aegion Crporation

18.8.   GE Water & Process Technologies

18.9.   Aqua Innovative Solutions Pvt Ltd.

18.10.  Other Key Players

Request Free Sample

We prioritize the confidentiality and security of your data. Our promise: your information remains private.

Ready to Transform Data into Decisions?

Request Your Sample Report and Start Your Journey of Informed Choices


Providing the strategic compass for industry titans.

cr-clients-logos

Frequently Asked Questions:

What is the current market size for the Global Water Infrastructure and Repair Technology (WIRT) Market, and what is its projected size in 2032?

The Global Water Infrastructure and Repair Technology (WIRT) Market was valued at USD 87,275.2 million in 2024 and is projected to reach USD 157,396.5 million by 2032.

At what Compound Annual Growth Rate is the Global Water Infrastructure and Repair Technology (WIRT) Market projected to grow between 2025 and 2032?

The Global Water Infrastructure and Repair Technology (WIRT) Market is projected to grow at a CAGR of 7.70% between 2025 and 2032.

What are the primary factors fueling the growth of the Global Water Infrastructure and Repair Technology (WIRT) Market

The growth of the Global Water Infrastructure and Repair Technology (WIRT) Market is primarily fueled by urbanization, population growth, stricter environmental regulations, and ongoing technological advancements in water management solutions.

Who are the major players in this Market?

3M Company,Aclara Technology LLC,Action Products Marketing Corp.,Advanced Trenchless Inc.,Black & Veatch are some of the major players in the global market.

Who are the leading companies in the Global Water Infrastructure and Repair Technology (WIRT) Market?

Leading companies in the Global Water Infrastructure and Repair Technology (WIRT) Market include 3M, Veolia Water Technologies & Solutions, Core & Main Inc., Xylem Inc., Kurita Water Industries Ltd., Mueller Water Products Inc., and Aegion Corporation.

About Author

Ganesh Chandwade

Ganesh Chandwade

Senior Industry Consultant

Ganesh is a senior industry consultant specializing in heavy industries and advanced materials.

View Profile

Related Reports

GCC Textile Market

The GCC Textile Market was valued at USD 11,767.9 million in 2018 and is projected to reach USD 17,777.2 million by 2024, growing at a CAGR of 6.92%. It is expected to continue its growth trajectory, reaching USD 30,345.2 million by 2032 during the forecast period.

Radiation Shielding Glass Market

The Radiation Shielding Glass Market is projected to grow from USD 1340.5 million in 2024 to an estimated USD 2104.52 million by 2032, with a compound annual growth rate (CAGR) of 5.8% from 2024 to 2032.

PVDC Barrier Material Market

The PVDC Barrier Material Market is projected to grow from USD 1,266.5 million in 2024 to an estimated USD 1,845.69 million by 2032, with a compound annual growth rate (CAGR) of 4.82% from 2024 to 2032.

Polysulfide Construction Sealant Market

The Polysulfide Construction Sealant Market is projected to grow from USD 1,147.15 million in 2024 to an estimated USD 1,487.38 million by 2032, with a CAGR of 3.3% from 2024 to 2032.

Liquid Silicone Rubber Market

Liquid Silicone Rubber Market size was valued USD 2.31 billion in 2024 and is anticipated to reach USD 4.5 billion by 2032, at a CAGR of 8.69% during the forecast period.

Flame Resistant Fabrics Market

The Flame-Resistant Fabrics market size was valued at USD 6.59 billion in 2024 and is anticipated to reach USD 10.66 billion by 2032, at a CAGR of 6.2% during the forecast period.

Tire Cord & Tire Fabrics Market

Tire Cord and Tire Fabrics Market size was valued USD 5.8 billion in 2024 and is anticipated to reach USD 9.04 billion by 2032, at a CAGR of 5.7% during the forecast period.

Pre-Painted Galvanized Iron (PPGI) Market

Pre-Painted Galvanized Iron (PPGI) Market size was valued USD 153.81 billion in 2024 and is anticipated to reach USD 297.81 billion by 2032, at a CAGR of 8.61% during the forecast period.

Calcined Petcoke Market

The Calcined Petcoke Market size was valued at USD 1,895.59 Million in 2024 and is anticipated to reach USD 2,737.28 Million by 2032, at a CAGR of 8.7% during the forecast period.

PVC Shrink Films Market

PVC Shrink Films Market size was valued at USD 3.62 billion in 2024 and is anticipated to reach USD 5.26 billion by 2032, growing at a CAGR of 4.8% during the forecast period.

Advanced Insulation Material Market

The Advanced Insulation Material market size was valued at USD 3.8 Billion in 2024 and is anticipated to reach USD 5.27 Billion by 2032, at a CAGR of 4.2% during the forecast period.

Rubber Antioxidant Market

The Rubber Antioxidant Market size was valued at USD 1,792.8 Million in 2024 and is anticipated to reach USD 2,508.84 Million by 2032, at a CAGR of 4.29% during the forecast period.

Licence Option

The report comes as a view-only PDF document, optimized for individual clients. This version is recommended for personal digital use and does not allow printing. Use restricted to one purchaser only.
$4999

To meet the needs of modern corporate teams, our report comes in two formats: a printable PDF and a data-rich Excel sheet. This package is optimized for internal analysis. Unlimited users allowed within one corporate location (e.g., regional office).
$6999

The report will be delivered in printable PDF format along with the report’s data Excel sheet. This license offers 100 Free Analyst hours where the client can utilize Credence Research Inc. research team. Permitted for unlimited global use by all users within the purchasing corporation, such as all employees of a single company.
$12999

Report delivery within 24 to 48 hours

Credence Staff 3

WILLIAM, North America

Support Staff at Credence Research

KEITH PHILLIPS, Europe

Lee - CR Sales Staff

LEE VALLANCE, Asia Pacific

Kieran Jameson

KIERAN JAMESON, Australia

Smallform of Sample request
User Review

Thank you for the data! The numbers are exactly what we asked for and what we need to build our business case.

Materials Scientist
(privacy requested)

User Review

The report was an excellent overview of the Industrial Burners market. This report does a great job of breaking everything down into manageable chunks.

Imre Hof
Management Assistant, Bekaert

cr-clients-logos

Request Sample