| REPORT ATTRIBUTE |
DETAILS |
| Historical Period |
2020-2023 |
| Base Year |
2024 |
| Forecast Period |
2025-2032 |
| Wireless Display Market Size 2023 |
USD 7,295.47 million |
| Wireless Display Market, CAGR |
11.31% |
| Wireless Display Market Size 2032 |
USD 17,156.60 million |
Market Overview
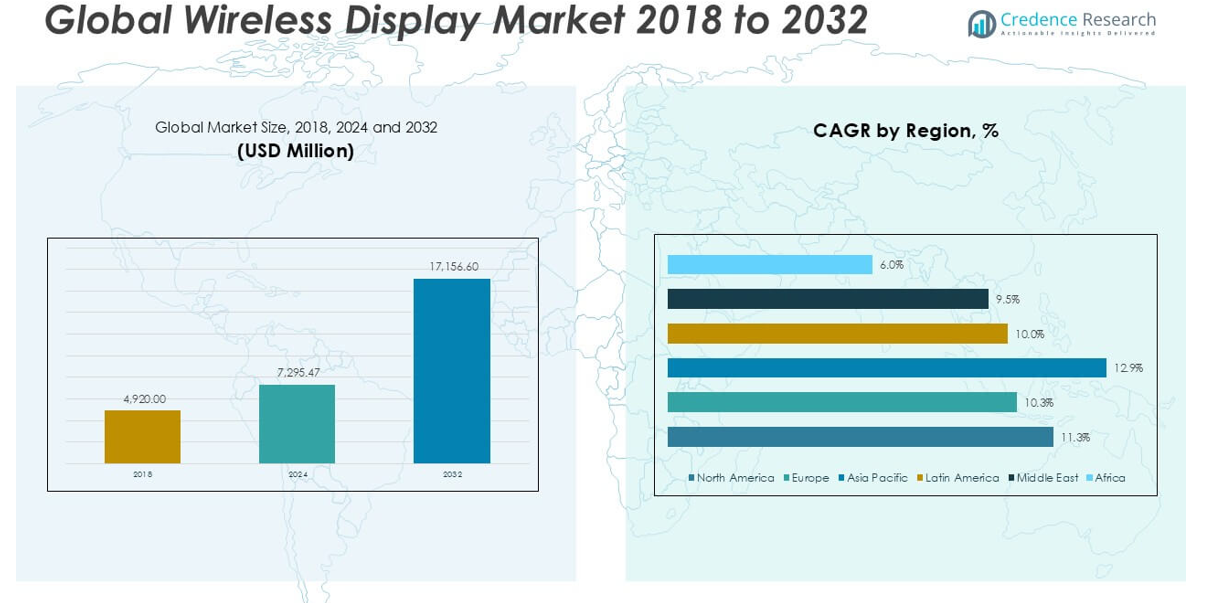
Wireless Display Market size was valued at USD 4,920.00 million in 2018 to USD 7,295.47 million in 2024 and is anticipated to reach USD 17,156.60 million by 2032, at a CAGR of 11.31% during the forecast period.
The Wireless Display Market is witnessing robust growth, driven by increasing demand for seamless content sharing and screen mirroring solutions across consumer electronics, education, and corporate sectors. Advancements in wireless communication technologies, such as Wi-Fi Direct and Miracast, are enabling faster and more reliable connections, encouraging widespread adoption of wireless display devices. The shift toward remote work and hybrid learning environments has elevated the need for efficient collaboration tools, further accelerating market expansion. Growing integration of wireless display technology in smart TVs, projectors, and smartphones is enhancing user experience and convenience, while manufacturers are investing in product innovation to support higher resolutions and lower latency. The rising popularity of Bring Your Own Device (BYOD) policies in organizations and the proliferation of smart homes are shaping key trends, with the market expected to benefit from ongoing technological advancements and expanding application areas across both personal and professional domains.
The geographical analysis of the Wireless Display Market highlights significant growth across major regions, driven by rapid adoption of digital technologies and increasing investments in smart infrastructure. North America leads the market due to strong demand for advanced collaboration tools in both residential and commercial settings, supported by a mature technology ecosystem. Europe and Asia Pacific are experiencing substantial expansion, fueled by rising consumer electronics penetration, smart home integration, and government initiatives to promote digital transformation. Key players such as Apple Inc., Google LLC, and Intel Corporation hold a strong position in the market by offering innovative wireless display solutions tailored for diverse applications. These companies focus on continuous product development and strategic partnerships to address evolving consumer and enterprise needs, maintaining a competitive edge across global markets.
Market Insights
The Wireless Display Market reached USD 7,295.47 million in 2024 and is projected to grow to USD 17,156.60 million by 2032, at a CAGR of 11.31%.
· The market benefits from increased demand for seamless content sharing, driven by digital transformation across consumer electronics, education, and enterprise sectors.
· Trends include strong integration with smart devices, improvements in video quality and latency, and a focus on user-friendly wireless display experiences.
· Major companies such as Apple Inc., Google LLC, and Intel Corporation lead the competitive landscape by leveraging innovation, strong product portfolios, and global reach.
· Market restraints include interoperability issues, security concerns, and network performance limitations that can hinder adoption and seamless operation.
· North America and Asia Pacific are key growth regions, supported by advanced digital infrastructure and widespread technology adoption in the United States, China, Japan, and India.
· Ongoing investments in smart homes, IoT integration, and government-led digital initiatives are shaping market opportunities and driving long-term growth across diverse application areas.
Access crucial information at unmatched prices!
Request your sample report today & start making informed decisions powered by Credence Research Inc.!
Download Sample
Market Drivers
Growing Demand for Seamless Connectivity and Enhanced User Experience Drives Market Expansion
The Wireless Display Market is experiencing significant momentum due to a strong demand for seamless connectivity in both consumer and professional environments. End users expect uninterrupted content sharing, easy screen mirroring, and smooth multimedia streaming across multiple devices. The push toward smarter living and working spaces has prompted consumers and organizations to seek technologies that eliminate cables and improve efficiency. The integration of wireless display solutions in smart TVs, laptops, and projectors is simplifying operations and creating more interactive experiences. Consumers value instant sharing capabilities, while enterprises benefit from improved collaboration and faster decision-making. The convenience and flexibility offered by wireless displays are transforming the way content is presented, discussed, and utilized in daily operations.
- For instance, event company CEOs in India reported that the fastest growth in digital and interactive technology adoption is occurring in emerging urban markets, where brands and organizations are leveraging wireless solutions to reach wider audiences and facilitate dynamic presentations.
Rapid Technological Advancements in Wireless Communication Propel Adoption Rates
Innovation in wireless communication protocols such as Wi-Fi Direct, Miracast, and Chromecast is fueling the adoption of wireless display devices. These technologies provide robust, low-latency, and high-resolution transmission, supporting an enhanced user experience. Manufacturers are developing products that support 4K and even 8K resolutions, appealing to tech-savvy consumers and professional users who require crisp visuals. The deployment of 5G networks is expected to further improve wireless display performance, supporting uninterrupted streaming and quick device synchronization. It is driving the market forward by meeting the increasing requirements for bandwidth and speed. Such advancements are removing technical barriers, making wireless display solutions accessible to a broader audience.
- For instance, a Deloitte consumer survey reported that users identified improved speed and connection reliability as primary benefits of 5G-enabled display devices.
Expanding Remote Work, Hybrid Learning, and BYOD Policies Support Market Growth
Workplace transformation trends and hybrid learning models are key drivers for the Wireless Display Market. Organizations are adopting Bring Your Own Device (BYOD) policies, which increase the need for secure, reliable, and compatible wireless display solutions. It streamlines workflows, enabling employees to present and share information without compatibility concerns. Educational institutions are integrating wireless displays to facilitate interactive lessons and collaborative projects, responding to the need for remote and hybrid education. The flexibility of wireless solutions aligns well with changing work and learning environments. This market benefits from the ongoing evolution of workplace and classroom technologies.
Proliferation of Smart Homes and IoT Devices Expands Market Opportunities
The rising adoption of smart homes and Internet of Things (IoT) devices is expanding the application landscape for the Wireless Display Market. Consumers are connecting a wide array of devices, including smartphones, tablets, home entertainment systems, and home automation tools. It creates new opportunities for wireless display technology to serve as a central hub for visual communication and content sharing. Manufacturers are responding with products that offer compatibility across a broad device ecosystem. Demand for multi-device synchronization and user-friendly interfaces supports continuous innovation in this sector. The expanding digital ecosystem is expected to sustain strong market growth in the coming years.
Market Trends
Advancements in Video Quality, Latency Reduction, and Multi-Device Synchronization Lead Market Evolution
The Wireless Display Market continues to benefit from rapid advancements in video resolution, transmission speed, and multi-device support. Manufacturers are introducing products that deliver ultra-high-definition (UHD) and 4K streaming with reduced latency, meeting the needs of both entertainment enthusiasts and professional users. It has resulted in growing demand from sectors where high-fidelity visuals and real-time collaboration are critical. The capability to synchronize and display content on multiple screens simultaneously is attracting businesses seeking efficient presentation and collaboration tools. Video compression techniques and low-latency protocols are at the forefront of product development. Continuous innovation is raising performance benchmarks, encouraging further adoption.
- For example, in India, the number of connected TV screens is projected to rise from 190 million in 2024 to 214 million by 2026, reflecting growing consumer appetite for advanced display solutions that support immersive viewing experiences and multi-device connectivity.
Integration of Wireless Display Solutions with Smart Devices and Consumer Electronics Shapes Market Direction
The Wireless Display Market is experiencing a surge in integration with smart devices and consumer electronics. Device manufacturers are embedding wireless display technology directly into smartphones, tablets, smart TVs, and streaming devices, enabling effortless content sharing. It is improving convenience for end users and creating a seamless multimedia experience across interconnected home and office environments. Consumers expect their devices to communicate and share content without cables, prompting brands to prioritize native wireless display compatibility. The trend toward connected living is fueling investments in interoperable solutions, which support multiple operating systems and platforms. Product launches increasingly focus on user-friendly interfaces and automatic pairing features to strengthen market adoption.
- For instance, a Consumer Technology Association (CTA) study revealed that a growing proportion of consumers use screen mirroring features on their mobile devices to share content with TVs and projectors at home.
Growing Adoption in Corporate, Education, and Healthcare Environments Expands Market Reach
Enterprises, educational institutions, and healthcare providers are accelerating adoption of wireless display technology to improve communication and collaboration. The Wireless Display Market is seeing strong traction in conference rooms, lecture halls, and healthcare facilities where easy sharing of data and visuals is essential. It supports remote diagnostics, real-time consultations, and interactive teaching, aligning with broader digital transformation trends. Companies value the agility of wireless presentations and the elimination of complex wiring setups. Schools and universities are leveraging the technology to create dynamic and interactive learning experiences. The broadening application base reinforces the market’s growth prospects.
Increased Focus on Security, Compatibility, and User Experience Drives Innovation
Security and compatibility have become central themes in the Wireless Display Market. Product developers are prioritizing encrypted connections and robust authentication protocols to safeguard sensitive information, especially in enterprise and healthcare deployments. It is essential for fostering trust and expanding usage in professional environments. Solutions that support cross-platform compatibility appeal to organizations with diverse device fleets. User experience enhancements, such as one-touch connectivity and intuitive setup processes, are becoming standard expectations. The focus on secure, accessible, and seamless wireless display solutions is shaping ongoing product differentiation and market competitiveness.
Market Challenges Analysis
Complexity of Interoperability, Security Concerns, and Network Limitations Create Market Barriers
The Wireless Display Market faces significant challenges related to interoperability, security, and network performance. Devices from different manufacturers may not always support the same wireless protocols, leading to compatibility issues and inconsistent user experiences. Security concerns are prominent, especially in enterprise and healthcare settings where data confidentiality and integrity are critical. It must address risks of unauthorized access, data breaches, and network vulnerabilities to gain trust among institutional users. Network limitations such as bandwidth constraints, signal interference, and latency impact the reliability of wireless display connections. Organizations require robust and resilient solutions to maintain seamless content sharing and avoid workflow disruptions.
- For instance, a survey by the Ponemon Institute indicated that IT managers in healthcare and financial services listed network security as a major challenge in deploying new wireless display systems.
Cost Constraints, Technical Complexity, and User Adoption Slow Market Expansion
High initial investment and technical complexity can limit adoption of wireless display solutions, particularly among small and medium-sized businesses. The Wireless Display Market must overcome the perception that advanced display technologies are costly or require specialized expertise to implement and manage. User training and support become necessary to help new users adapt to evolving systems, which can increase deployment costs. It often faces resistance from stakeholders who are accustomed to traditional wired setups. Concerns about device compatibility, software updates, and ongoing maintenance further influence buying decisions. Addressing these challenges requires comprehensive customer support, clear value propositions, and continuous product improvement.
Market Opportunities
Rising Demand for Wireless Solutions in Hybrid Work and Learning Environments Unlocks New Growth Avenues
The Wireless Display Market presents substantial opportunities amid the growing adoption of hybrid work models and digital classrooms. Organizations are investing in advanced collaboration tools to facilitate seamless content sharing across remote and in-person participants. Educational institutions seek interactive display solutions to enhance student engagement and enable real-time communication. It stands to benefit from government and private sector initiatives that prioritize digital transformation and smart infrastructure development. The shift toward flexible working and learning spaces is expected to drive demand for user-friendly, scalable, and secure wireless display technologies. Expanding application areas across education, corporate, and public sectors will sustain market momentum.
Integration with IoT and Smart Home Ecosystems Creates Innovation Potential
Integration with the broader Internet of Things (IoT) and smart home environments creates further opportunity for the Wireless Display Market. Manufacturers are designing products compatible with a wide range of smart devices, including speakers, security systems, and home automation hubs. It enables consumers to centralize control, share visual content, and enhance the connected living experience. The proliferation of 5G networks and edge computing technologies will support high-speed, low-latency wireless display applications. Brands can leverage this convergence to offer value-added features and differentiated user experiences. The growing consumer focus on smart homes and connected lifestyles will continue to generate demand for advanced wireless display solutions.
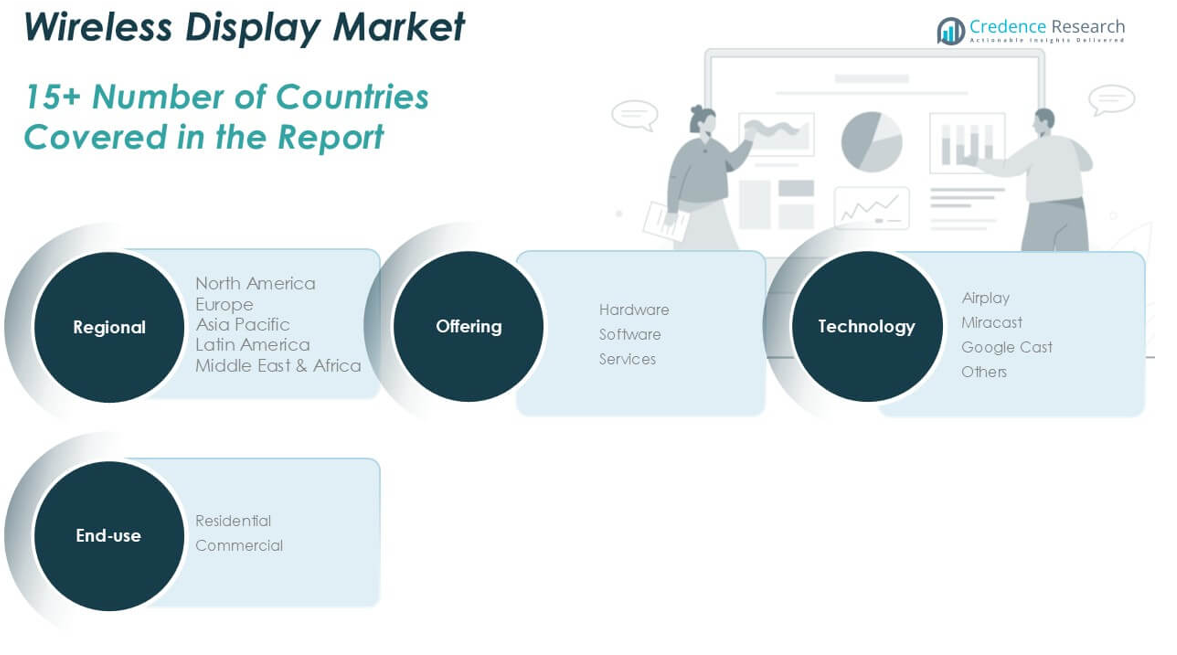
Market Segmentation Analysis:
By Offering:
Hardware dominates market share, driven by the widespread adoption of wireless display adapters, dongles, receivers, and embedded solutions in smart TVs and projectors. The proliferation of consumer electronics and integration of wireless display modules in entertainment devices support hardware’s continued prominence. Software plays a vital role by enabling seamless interoperability, device pairing, and advanced content management, appealing to both enterprise and consumer applications. Services represent a growing segment, as organizations and end-users seek ongoing technical support, integration services, and regular software updates to maximize device performance and minimize operational disruptions.
By Technology:
The Wireless Display Market is characterized by a diverse ecosystem that includes Airplay, Miracast, Google Cast, and other proprietary or emerging standards. Airplay appeals to users invested in Apple’s device ecosystem, offering simple, high-quality content sharing across compatible devices. Miracast remains a popular choice for Android and Windows users, providing peer-to-peer connectivity without requiring an internet connection. Google Cast supports seamless integration with Android devices and the Google ecosystem, powering a broad array of home and commercial applications. Other technologies, including vendor-specific and open-source solutions, continue to emerge, supporting greater compatibility and customization across different user scenarios.
By End-Use:
The Wireless Display Market serves both residential and commercial segments. The residential segment benefits from growing consumer demand for smart home solutions, multi-room streaming, and convenient content sharing between devices. Consumers value the ability to mirror screens and stream multimedia content without cables, prompting strong adoption in homes. The commercial segment is expanding rapidly, driven by the need for collaborative tools in offices, conference rooms, educational institutions, and healthcare facilities. It supports efficient presentations, interactive learning, and telemedicine, catering to organizations seeking productivity and flexibility. Together, these segments highlight the evolving role of wireless display solutions across multiple sectors, reinforcing the market’s sustained growth.
Segments:
Based on Offering:
- Hardware
- Software
- Services
Based on Technology:
- Airplay
- Miracast
- Google Cast
- Others
Based on End-Use:
Based on the Geography:
- North America
- Europe
- UK
- France
- Germany
- Italy
- Spain
- Russia
- Belgium
- Netherlands
- Austria
- Sweden
- Poland
- Denmark
- Switzerland
- Rest of Europe
- Asia Pacific
- China
- Japan
- South Korea
- India
- Australia
- Thailand
- Indonesia
- Vietnam
- Malaysia
- Philippines
- Taiwan
- Rest of Asia Pacific
- Latin America
- Brazil
- Argentina
- Peru
- Chile
- Colombia
- Rest of Latin America
- Middle East
- UAE
- KSA
- Israel
- Turkey
- Iran
- Rest of Middle East
- Africa
- Egypt
- Nigeria
- Algeria
- Morocco
- Rest of Africa
Regional Analysis
North America Wireless Display Market
North America Wireless Display Market grew from USD 1,751.52 million in 2018 to USD 2,575.56 million in 2024 and is projected to reach USD 6,068.99 million by 2032, reflecting a compound annual growth rate (CAGR) of 11.3%. North America is holding a 35% market share. The United States and Canada lead regional adoption due to advanced digital infrastructure, early uptake of smart home technologies, and strong presence of major wireless display solution providers. Demand is concentrated in both residential and commercial applications, with enterprises, educational institutions, and healthcare organizations actively investing in wireless collaboration tools.
Europe Wireless Display Market
Europe Wireless Display Market grew from USD 1,161.12 million in 2018 to USD 1,647.12 million in 2024 and is anticipated to reach USD 3,598.99 million by 2032, registering a CAGR of 10.3%. Europe is holding a 21% market share. Key countries such as Germany, the United Kingdom, and France are major contributors, supported by growing investments in digital education and connected office environments. Regulatory support for smart city initiatives and rapid proliferation of IoT devices create opportunities for wireless display technology across public and private sectors.
Asia Pacific Wireless Display Market
Asia Pacific Wireless Display Market grew from USD 1,409.58 million in 2018 to USD 2,146.62 million in 2024 and is forecasted to reach USD 5,629.23 million by 2032, achieving the fastest CAGR of 12.9%. Asia Pacific is holding a 33% market share. China, Japan, South Korea, and India drive growth, supported by rising consumer electronics penetration, urbanization, and government focus on digital transformation. The region’s diverse consumer base and rapid expansion of the education and enterprise sectors reinforce long-term demand.
Latin America Wireless Display Market
Latin America Wireless Display Market grew from USD 301.10 million in 2018 to USD 442.03 million in 2024 and is estimated to reach USD 947.56 million by 2032, at a CAGR of 10.0%. Latin America is holding a 6% market share. Brazil and Mexico stand out as key countries, benefitting from expanding IT infrastructure, rising disposable incomes, and adoption of wireless display solutions in both corporate and educational settings. The market remains in a growth phase with increasing technology awareness.
Middle East Wireless Display Market
Middle East Wireless Display Market grew from USD 169.74 million in 2018 to USD 234.14 million in 2024 and is expected to reach USD 481.99 million by 2032, demonstrating a CAGR of 9.5%. The Middle East is holding a 3% market share. The United Arab Emirates and Saudi Arabia are leading countries, with investments in smart cities and modern commercial spaces driving adoption. Emphasis on digitalization and innovation in corporate environments supports ongoing market expansion.
Africa Wireless Display Market
Africa Wireless Display Market grew from USD 126.94 million in 2018 to USD 250.00 million in 2024 and is projected to reach USD 429.85 million by 2032, growing at a CAGR of 6.0%. Africa is holding a 3% market share. South Africa and Nigeria are prominent markets, supported by gradual improvements in connectivity and digital education initiatives. While the market is in early stages, expanding access to internet and mobile devices presents future opportunities for wireless display adoption.
Shape Your Report to Specific Countries or Regions & Enjoy 30% Off!
Key Player Analysis
- Actiontec Electronics, Inc.
- Apple Inc.
- Belkin
- Google LLC
- IOGEAR
- Intel Corporation
- Lattice Semiconductor
- LG Electronics
- Marvell
- MediaTek Inc.
- Microsoft Corporation
- MiraScreen
- NETGEAR
- com
Competitive Analysis
The competitive landscape of the Wireless Display Market is shaped by innovation, product differentiation, and strategic partnerships among leading players. Key companies in this sector include Apple Inc., Google LLC, Intel Corporation, Microsoft Corporation, LG Electronics, MediaTek Inc., and Actiontec Electronics, Inc. These organizations maintain strong market positions by continuously investing in research and development to improve wireless display performance, compatibility, and security features. Leading companies in this market prioritize research and development to deliver wireless display solutions with improved performance, higher resolution, and robust security. They invest in expanding their product portfolios, integrating wireless display features into a variety of smart devices, and forming strategic alliances to strengthen their market presence. Competition centers on offering seamless connectivity, compatibility across multiple platforms, and support for new standards such as 4K and 8K streaming. Companies also emphasize reliability and ease of use, targeting growth in both residential and commercial applications. Global distribution networks, strong customer support, and tailored solutions for specific industries further distinguish competitors. By responding to evolving market needs and technological advancements, these players maintain strong positions and drive overall market growth.
Recent Developments
- In January 2024, LG unveiled world’s first wireless TV with transparent display The Signature OLED T’s Zero Connect Box boasts LG’s cutting-edge wireless transmission technology that can send 4K images and sound seamlessly to the TV.
- In March 2023, Google announced the launch of its new wireless display product, Chromecast with Google TV. The product is designed to make it easy to stream content from a variety of devices to a TV.
- In February 2023, Amazon announced the launch of its new wireless display product, Fire TV Stick 4K Max. The product is designed to offer a faster and more responsive streaming experience than previous Fire TV Stick models.
- In January 2023, Roku announced the launch of its new wireless display product, Roku Express 4K+. The product is designed to offer a 4K streaming experience at a lower price than previous Roku models.
Market Concentration & Characteristics
The Wireless Display Market exhibits a moderate to high level of market concentration, with a handful of global technology leaders holding significant influence through innovation, proprietary technologies, and strong distribution networks. It is characterized by rapid technological advancements, high product differentiation, and continuous integration with smart devices and IoT ecosystems. Leading companies focus on expanding their product portfolios to address the diverse needs of residential, commercial, and educational users. The market shows dynamic competition, where both established brands and emerging players invest in R&D to deliver improved performance, security, and user experience. It demonstrates high entry barriers due to the need for advanced technical expertise, intellectual property, and substantial capital investment. The Wireless Display Market thrives on partnerships, strategic alliances, and adaptability to evolving connectivity standards, ensuring ongoing growth and sustained demand across regions.
Report Coverage
The research report offers an in-depth analysis based on Offering, Technology, End-Use and Geography. It details leading market players, providing an overview of their business, product offerings, investments, revenue streams, and key applications. Additionally, the report includes insights into the competitive environment, SWOT analysis, current market trends, as well as the primary drivers and constraints. Furthermore, it discusses various factors that have driven market expansion in recent years. The report also explores market dynamics, regulatory scenarios, and technological advancements that are shaping the industry. It assesses the impact of external factors and global economic changes on market growth. Lastly, it provides strategic recommendations for new entrants and established companies to navigate the complexities of the market.
Future Outlook
- Wireless display devices will become standard features in most smart TVs, laptops, and mobile devices.
- Vendors will focus on reducing latency and increasing data transmission speeds to enhance streaming quality.
- Integration with voice assistants and AI-driven platforms will improve the user experience.
- Wireless display adoption will increase in public venues, such as airports, shopping malls, and hotels, to support digital signage.
- Collaboration with content providers and streaming platforms will broaden the scope of wireless display solutions.
- Sustainability and energy efficiency will emerge as important product development goals.
- Demand for wireless display technology in automotive infotainment systems will rise.
- Software updates and cloud-based management tools will streamline deployment and maintenance for enterprise users.
- Regulatory standards for data security and device compatibility will shape market evolution.
- Cross-platform interoperability will be a top priority for manufacturers to ensure seamless operation across diverse ecosystems.


