Market Overview
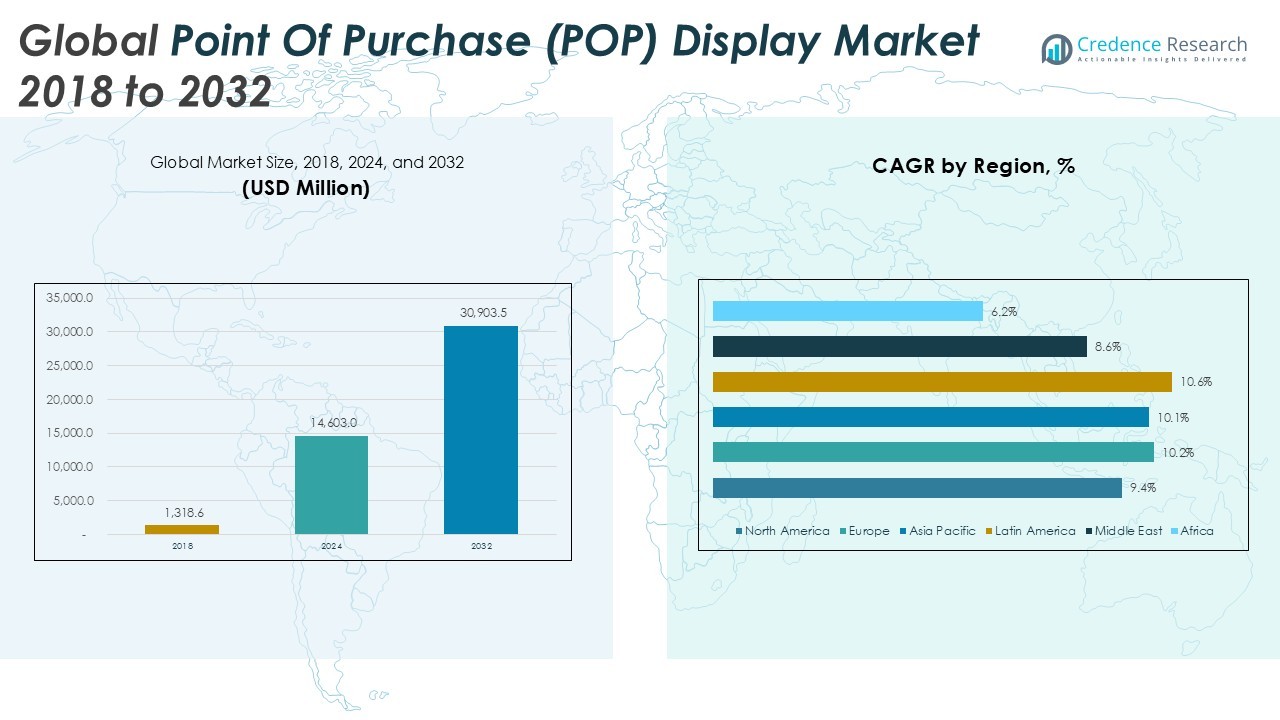
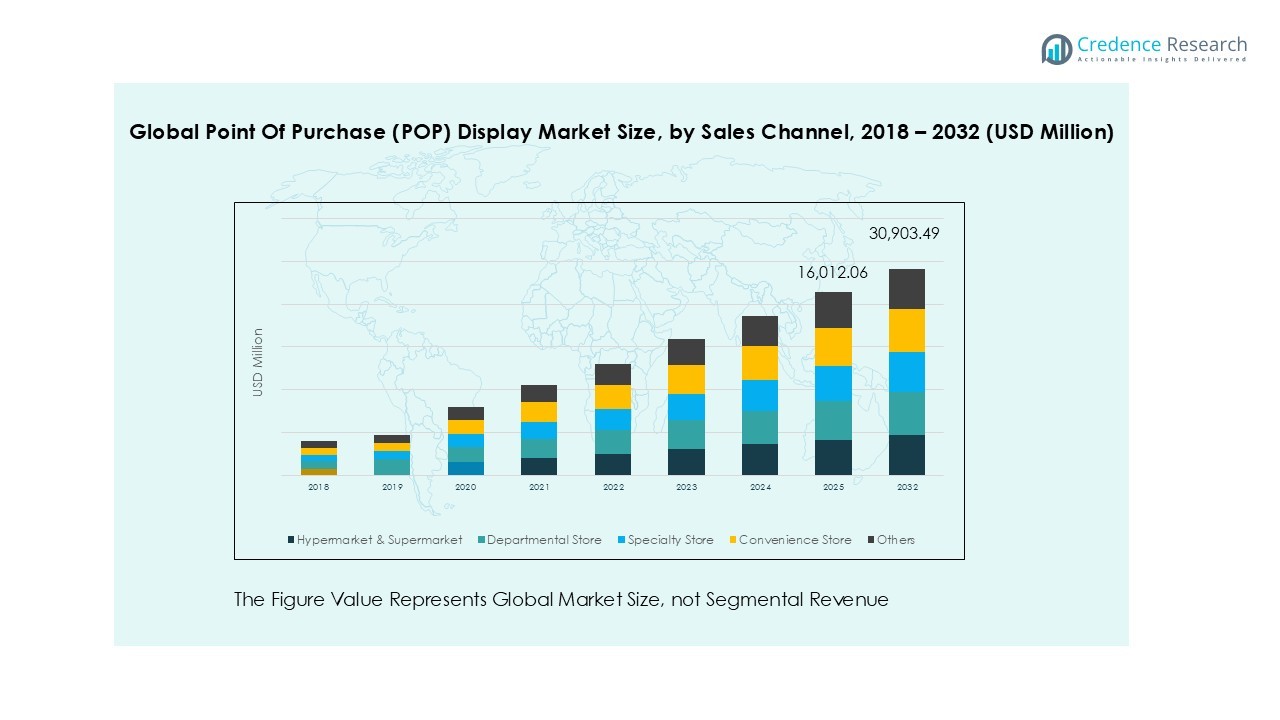
The Global Point of Purchase (POP) Display market size was valued at USD 1,318.6 million in 2018, growing to USD 14,603.0 million in 2024, and is anticipated to reach USD 30,903.5 million by 2032, at a CAGR of 9.85% during the forecast period.
| REPORT ATTRIBUTE |
DETAILS |
| Historical Period |
2020-2023 |
| Base Year |
2024 |
| Forecast Period |
2025-2032 |
| Point of Purchase (POP) Display Market Size 2024 |
USD 14,603.0 Million |
| Point of Purchase (POP) Display Market, CAGR |
9.85% |
| Point of Purchase (POP) Display Market Size 2032 |
USD 30,903.5 Million |
The Global Point of Purchase (POP) Display market is dominated by major players including DS Smith Plc, Smurfit Kappa Group, International Paper Company, WestRock Company, and Sonoco Products Company, supported by strong contributions from Menasha Packaging, Pratt Industries, Georgia-Pacific, and Mondi Group. These companies emphasize sustainable, corrugated, and recyclable solutions while leveraging advanced printing technologies to strengthen brand visibility at retail outlets. Regionally, Asia Pacific led the market with a 34.4% share in 2024, driven by expanding organized retail and rising consumer spending, followed by Europe with 29.7% and North America at 21.6%. Latin America, the Middle East, and Africa collectively contributed smaller shares but are expected to grow rapidly due to increasing retail infrastructure and brand investments. The combination of global players’ innovation strategies and strong regional demand positions the industry for steady expansion across diverse retail formats worldwide.
Access crucial information at unmatched prices!
Request your sample report today & start making informed decisions powered by Credence Research Inc.!
Download Sample
Market Insights
- The Global Point of Purchase (POP) Display market was valued at USD 14,603.0 million in 2024 and is projected to reach USD 30,903.5 million by 2032, growing at a CAGR of 9.85%.
- Rising consumer goods competition and retail expansion drive adoption of POP displays, with corrugated board leading material use at 36.4% share due to cost-effectiveness and sustainability.
- Digital integration, customized formats, and eco-friendly materials represent key market trends, enhancing consumer engagement and supporting brand differentiation at retail points.
- The market is highly competitive with DS Smith, Smurfit Kappa, International Paper, WestRock, and Sonoco Products leading, supported by Mondi, Georgia-Pacific, Pratt Industries, and Menasha Packaging focusing on innovation and sustainability.
- Regionally, Asia Pacific led with 34.4% share in 2024, followed by Europe at 29.7% and North America at 21.6%, while Latin America (7.8%), Middle East (3.0%), and Africa (3.5%) are emerging with steady growth potential.
Market Segmentation Analysis:
By Material
The material segment in the Global POP Display market is led by corrugated board, which accounted for the largest share of 36.4% in 2024. Corrugated board dominates due to its lightweight, cost-effective, and recyclable nature, making it the preferred choice for retail promotions. Foam boards and plastic sheets follow, offering durability and print quality for premium displays. Expanded PVC, with acrylic and polycarbonate subtypes, is growing in adoption for high-end cosmetic and electronics displays. Glass and metal remain niche but are used in luxury and long-term brand campaigns requiring durability.
- For instance, DS Smith has partnered with L’Oréal to provide packaging solutions, with a notable collaboration involving the redesign of e-commerce packaging for L’Oréal’s luxury products”. “This partnership focuses on sustainable, fibre-based packaging solutions rather than foam board displays.
By Product
Among products, floor displays held the largest share of 34.7% in 2024, driven by their widespread use in supermarkets and hypermarkets. Floor displays attract higher consumer attention, maximize space utilization, and enhance product visibility. Pallet displays, including full, half, and quarter formats, also represent a significant share, supporting bulk sales in large retail chains. Counter displays remain important for impulse purchases in smaller retail formats, while sidekick displays, dump bins, and clip strips provide flexible solutions for promotional campaigns. The variety of formats ensures adaptability across retail environments.
By Application
Food and beverages emerged as the leading application, commanding a 39.2% share in 2024. The dominance is driven by rising in-store promotions for packaged foods, snacks, and beverages, where POP displays directly influence consumer buying decisions. Cosmetics and personal care follow strongly, as brands invest in visually appealing displays to boost product visibility. Pharmaceuticals and electronics are also growing segments, leveraging displays to highlight over-the-counter medicines and gadgets. Automotive and printing & stationery remain smaller segments but are expected to expand as manufacturers adopt creative POP display strategies for branding and customer engagement.
- For instance, Coca-Cola regularly deploys branded corrugated floor displays to market its products globally, targeting supermarkets and convenience chains.

Key Growth Drivers
Rising Retail Expansion and Modern Trade Formats
The rapid growth of modern retail formats such as supermarkets, hypermarkets, and specialty stores is a key driver for the POP display market. Retailers are investing in structured store layouts that rely heavily on display solutions to improve customer engagement and drive impulse purchases. Floor and pallet displays play a central role in enhancing brand visibility and product accessibility. The expansion of retail chains in emerging economies, coupled with rising disposable incomes, boosts demand for cost-effective yet impactful display materials like corrugated boards. This driver ensures consistent growth in both developed and developing markets.
- For instance, in 2023, Walmart operated over 10,500 stores across 20 countries. The company regularly deployed large-scale pallet and floor displays to promote seasonal items, a long-standing retail strategy.
Increasing Consumer Goods Competition and Brand Promotions
The growing competition among consumer goods manufacturers has intensified the use of POP displays as a direct marketing tool. Brands across food, beverages, cosmetics, and electronics are increasingly allocating larger budgets for in-store promotional activities. Counter displays, dump bins, and clip strips help capture consumer attention in crowded aisles, supporting immediate purchasing decisions. Customization in design, aided by advanced printing technologies, further strengthens brand messaging. With consumers often making buying choices at the point of sale, POP displays are becoming indispensable for companies seeking differentiation and higher market share.
- For instance, Unilever has regularly deployed a wide range of in-store Point-of-Purchase (POP) displays, including counter and clip strips, to promote brands like Dove and Sunsilk in Southeast Asia. This is part of the company’s established and aggressive retail merchandising strategy within the region.
Sustainability and Adoption of Eco-Friendly Materials
Sustainability initiatives across industries have significantly influenced POP display manufacturing. Brands are shifting toward recyclable and biodegradable materials such as corrugated boards and paper-based displays to align with environmental regulations and consumer expectations. Retailers and manufacturers are adopting green practices to reduce their carbon footprint and enhance brand reputation. Expanded PVC and plastic-based displays are being replaced or supplemented with eco-friendly alternatives without compromising durability or design quality. Government policies promoting sustainability, along with consumer preference for responsible brands, accelerate this transition. This driver not only expands adoption but also opens new opportunities in innovative green display solutions.
Key Trends & Opportunities
Integration of Digital and Interactive Displays
A major trend shaping the POP display market is the integration of digital elements, including interactive screens, QR codes, and LED-based features. These displays enhance consumer engagement by providing real-time product information, promotional videos, or personalized offers. Digital POP displays are particularly effective in electronics and cosmetics stores, where consumers value detailed product insights. The increasing adoption of digital retail technologies creates opportunities for hybrid solutions that combine traditional physical displays with advanced interactive features, bridging the gap between offline and online shopping.
- For instance, in 2023, Sephora continued to enhance its omnichannel retail strategy and expand its tech integration into its physical stores, particularly through the launch of its “Store of the Future” concept in Shanghai, China. A key part of its broader digital efforts in North America included expanding its partnership with Kohl’s and leveraging technology like the mobile app’s Virtual Artist and in-store Color IQ services to provide a seamless customer experience.
Customization and Personalization in Design
The demand for customized POP displays is rising, driven by brands seeking unique in-store experiences. Advanced digital printing and 3D design technologies allow manufacturers to deliver tailor-made displays that match specific campaigns, seasonal promotions, or regional preferences. This trend enhances brand recognition and boosts consumer loyalty, especially in highly competitive markets. Small and medium enterprises also benefit, as affordable customization tools make it easier to differentiate products in retail environments. The focus on personalization is creating opportunities for manufacturers to expand service portfolios beyond standardized display formats.
Growth of E-Commerce-Linked Offline Promotions
Although e-commerce is expanding rapidly, offline retail continues to dominate in categories like food, beverages, and cosmetics. A growing trend is the synergy between online and offline channels, where POP displays are used to reinforce brand presence in physical stores after online promotions. Retailers use QR codes and cross-channel marketing campaigns to create seamless shopping experiences. This integration enhances consumer trust and boosts conversions, making POP displays a crucial link between digital campaigns and in-store sales opportunities.
Key Challenges
Rising Raw Material Costs and Supply Chain Disruptions
One of the major challenges in the POP display market is the rising cost of raw materials such as corrugated boards, plastics, and foams. Supply chain disruptions, driven by global uncertainties, increase production and logistics expenses, directly affecting display manufacturers. Fluctuating costs reduce profitability and may push smaller players out of the market. Retailers and brands often seek low-cost display options, pressuring suppliers to deliver competitive pricing despite rising input costs. Balancing cost efficiency with quality and sustainability remains a difficult challenge for industry participants.
Short Lifecycle and High Replacement Needs
POP displays often have a short lifecycle, designed for specific promotions, seasonal campaigns, or limited-time offers. This high replacement rate increases costs for both brands and retailers. Disposable displays, especially those made from paper or cardboard, face durability issues, limiting reuse potential. The frequent need for new designs also adds to operational complexity and resource usage. Although this challenge drives continuous demand, it creates sustainability concerns and raises questions about long-term cost efficiency. Addressing lifecycle management while ensuring innovation is critical for the industry’s sustainable growth.

Regional Analysis
North America
North America accounted for 21.6% share of the Global POP Display market in 2024, valued at USD 3,159.25 million, up from USD 291.54 million in 2018. The region is projected to reach USD 6,489.73 million by 2032, registering a CAGR of 9.4%. Growth is supported by the expansion of supermarkets, hypermarkets, and specialty retail stores. High consumer spending on packaged food, beverages, and cosmetics drives display adoption. Strong brand competition across retail categories further accelerates demand for floor and pallet displays, reinforcing North America’s position as a significant revenue contributor.
Europe
Europe captured the 29.7% share of the global POP Display market in 2024, valued at USD 4,344.81 million, compared to USD 385.43 million in 2018. The region is anticipated to reach USD 9,410.11 million by 2032, with a CAGR of 10.2%. The European market benefits from rising investments in sustainable and eco-friendly display solutions, driven by strict environmental regulations. Cosmetics, personal care, and pharmaceutical industries contribute heavily to display adoption. The emphasis on premiumization and innovative store branding strategies ensures strong demand for customized and recyclable display formats across the retail landscape.
Asia Pacific
Asia Pacific emerged as the largest regional market, holding a 34.4% share in 2024 with USD 5,033.45 million, growing from USD 449.25 million in 2018. By 2032, the market is forecasted to reach USD 10,816.22 million, advancing at a CAGR of 10.1%. Rapid urbanization, rising disposable incomes, and expansion of organized retail chains across China, India, and Southeast Asia are key growth factors. Food and beverages dominate the display usage, while cosmetics and electronics show rising adoption. Increasing demand for corrugated board displays aligns with regional cost-sensitive and sustainability-driven preferences.
Latin America
Latin America accounted for a 7.8% share in 2024, with the market valued at USD 1,135.49 million, rising from USD 98.24 million in 2018. It is projected to reach USD 2,537.18 million by 2032, expanding at a CAGR of 10.6%. The region benefits from growing retail infrastructure and rising investments by multinational consumer goods companies. Supermarkets and convenience stores are driving higher adoption of counter and floor displays. While Brazil and Mexico lead market demand, smaller economies are also witnessing steady retail penetration, strengthening opportunities for both local and international POP display manufacturers.
Middle East
The Middle East contributed a 3.0% share in 2024, valued at USD 443.51 million, up from USD 42.59 million in 2018. The market is expected to reach USD 859.12 million by 2032, registering a CAGR of 8.6%. Increasing investments in retail malls, coupled with rising consumer demand for packaged goods and luxury cosmetics, are fueling adoption. Brands are leveraging high-quality, durable POP displays to enhance in-store promotions in premium outlets. However, the relatively smaller retail base compared to other regions limits large-scale deployment, although growth remains promising in countries such as the UAE and Saudi Arabia.
Africa
Africa held a 3.5% share of the global market in 2024, valued at USD 486.49 million, up from USD 51.56 million in 2018. The region is forecasted to reach USD 791.13 million by 2032, recording a CAGR of 6.2%. Retail modernization, especially in South Africa and Nigeria, is driving POP display adoption in food, beverages, and personal care segments. However, limited infrastructure and economic disparities restrict rapid growth. Cost-effective solutions like corrugated board displays dominate, as affordability and practicality are essential for regional retailers seeking to maximize brand visibility.

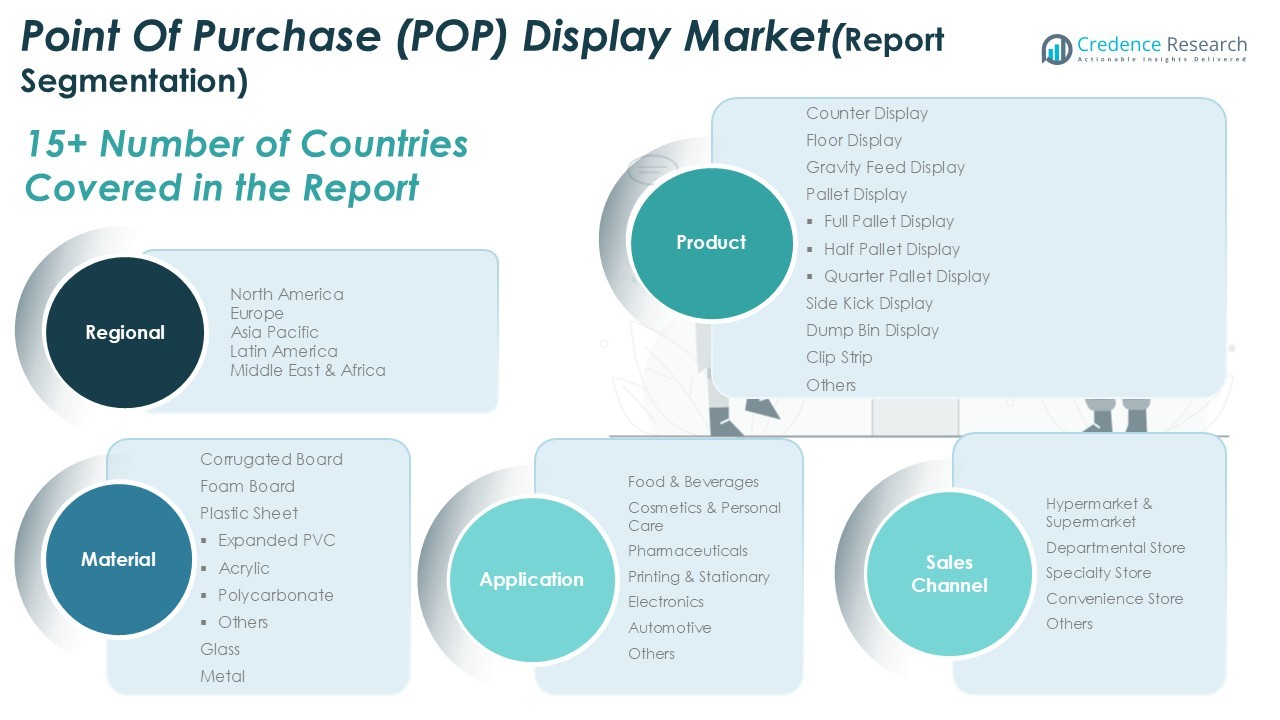
Market Segmentations:
By Material
- Corrugated Board
- Foam Board
- Plastic Sheet
- Expanded PVC
- Acrylic
- Polycarbonate
- Others
- Glass
- Metal
By Product
- Counter Display
- Floor Display
- Gravity Feed Display
- Pallet Display
- Full Pallet Display
- Half Pallet Display
- Quarter Pallet Display
- Side Kick Display
- Dump Bin Display
- Clip Strip
- Others
By Application
- Food & Beverages
- Cosmetics & Personal Care
- Pharmaceuticals
- Printing & Stationary
- Electronics
- Automotive
- Others
By Sales Channel
- Hypermarket & Supermarket
- Departmental Store
- Specialty Store
- Convenience Store
- Others
By Geography
- North America
- Europe
- Germany
- France
- U.K.
- Italy
- Spain
- Rest of Europe
- Asia Pacific
- China
- Japan
- India
- South Korea
- South-east Asia
- Rest of Asia Pacific
- Latin America
- Brazil
- Argentina
- Rest of Latin America
- Middle East & Africa
- GCC Countries
- South Africa
- Rest of the Middle East and Africa
Competitive Landscape
The competitive landscape of the Global Point of Purchase (POP) Display market is characterized by the presence of established multinational players and regional manufacturers competing on product innovation, material sustainability, and customized solutions. Key companies such as DS Smith Plc, Smurfit Kappa Group, International Paper Company, WestRock Company, and Sonoco Products Company lead the market with strong portfolios in corrugated and paper-based displays, leveraging eco-friendly designs to align with global sustainability standards. Firms like Menasha Packaging, Pratt Industries, and Georgia-Pacific focus on cost-effective solutions tailored to large retail chains and promotional campaigns, while Mondi Group emphasizes advanced printing and high-quality finishes for premium displays. Competitive differentiation is increasingly driven by the adoption of digital printing, modular designs, and recyclable materials, helping brands maximize visibility while meeting environmental goals. Strategic mergers, capacity expansions, and technological innovations remain central to maintaining market share and addressing the evolving needs of retail clients worldwide.
Shape Your Report to Specific Countries or Regions & Enjoy 30% Off!
Key Player Analysis
- DS Smith Plc
- Smurfit Kappa Group
- International Paper Company
- WestRock Company
- Sonoco Products Company
- Menasha Packaging Company, LLC
- Pratt Industries, Inc.
- Georgia-Pacific LLC
- Mondi Group
- Other Key Players
Recent Developments
- In June 2025, Green Bay Packaging committed USD 1 billion to expand its Arkansas kraft-liner facility, significantly boosting domestic board supply.
- In May 2025, Hotpack Global opened a USD 100 million New Jersey plant for customised sustainable food containers.
- In March 2025, Smurfit WestRock posted Q1 2025 revenue of USD 7.656 billion with adjusted EBITDA of USD 1.252 billion.
- In February 2025, ProMach welcomed BDT Capital Partners as co-investor to accelerate automation rollouts.
Report Coverage
The research report offers an in-depth analysis based on Material, Product, Application, Sales Channel and Geography. It details leading market players, providing an overview of their business, product offerings, investments, revenue streams, and key applications. Additionally, the report includes insights into the competitive environment, SWOT analysis, current market trends, as well as the primary drivers and constraints. Furthermore, it discusses various factors that have driven market expansion in recent years. The report also explores market dynamics, regulatory scenarios, and technological advancements that are shaping the industry. It assesses the impact of external factors and global economic changes on market growth. Lastly, it provides strategic recommendations for new entrants and established companies to navigate the complexities of the market.
Future Outlook
- The market will see strong demand from expanding modern retail formats worldwide.
- Eco-friendly and recyclable materials will become the primary choice for display manufacturing.
- Digital and interactive POP displays will gain higher adoption in premium retail outlets.
- Customization and personalization will drive brand differentiation and consumer engagement.
- Food and beverages will remain the dominant application segment for POP displays.
- Cosmetics and personal care will witness significant growth due to rising visual merchandising needs.
- Floor and pallet displays will continue leading product categories across large retail stores.
- Emerging markets in Latin America, the Middle East, and Africa will show steady adoption.
- Intense competition among global and regional players will accelerate innovation and strategic partnerships.
- Sustainability regulations and consumer preferences will push companies toward greener display solutions.


