Market Overview:
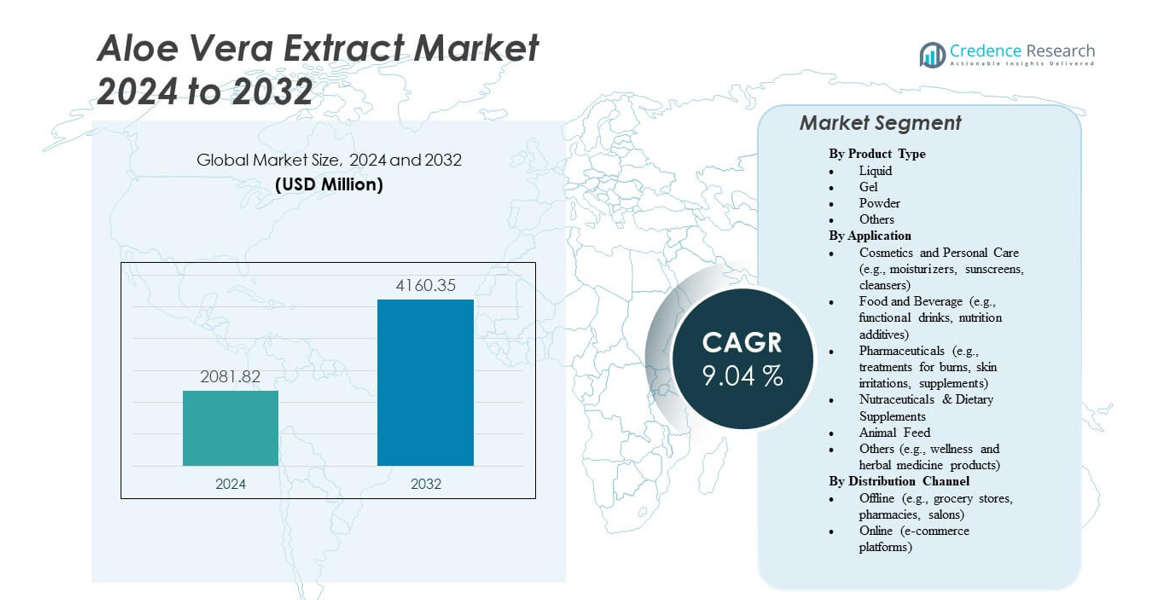
The Aloe Vera Extract Market is projected to grow from USD 2,081.82 million in 2024 to an estimated USD 4,160.35 million by 2032, with a compound annual growth rate (CAGR) of 9.04% from 2024 to 2032.
| REPORT ATTRIBUTE |
DETAILS |
| Historical Period |
2020-2023 |
| Base Year |
2024 |
| Forecast Period |
2025-2032 |
| Aloe Vera Extract Market Size 2024 |
USD 2,081.82 million |
| Aloe Vera Extract Market, CAGR |
9.04% |
| Aloe Vera Extract Market Size 2032 |
USD 4,160.35 million |
The rising demand for plant-based and chemical-free products drives market growth. Aloe vera’s proven properties in skin hydration, wound healing, and digestive health have made it a key ingredient in skincare and dietary supplements. Manufacturers are innovating with organic formulations and functional beverages to cater to wellness-oriented consumers. Increasing R&D investment in bioactive compounds further supports product diversification, expanding its presence across health, beauty, and food industries.
Asia-Pacific dominates the Aloe Vera Extract Market due to vast aloe cultivation and strong processing infrastructure in India, China, and Thailand. North America follows, with high demand for herbal skincare and nutraceuticals driven by consumer preference for natural formulations. Europe shows steady growth supported by regulatory approval for botanical ingredients. Emerging markets in Latin America and the Middle East are gaining traction as awareness of aloe-based health and cosmetic products spreads through expanding retail and online distribution networks.
Market Insights:
- The Aloe Vera Extract Market is projected to grow from USD 2,081.82 million in 2024 to USD 4,160.35 million by 2032, at a CAGR of 9.04%.
- Increasing consumer preference for herbal and natural ingredients drives strong adoption across cosmetics and food industries.
- Growing use of aloe vera in skincare, wound healing, and digestive health products supports sustained market expansion.
- Limited standardization in raw material quality and regulatory challenges restrain consistent global growth.
- Technological advancements in extraction processes enhance product purity and shelf stability.
- Asia-Pacific leads the market due to abundant raw material supply and strong manufacturing capabilities.
- North America and Europe maintain significant shares, while Latin America and the Middle East show emerging potential in aloe-based wellness products.
Access crucial information at unmatched prices!
Request your sample report today & start making informed decisions powered by Credence Research Inc.!
Download Sample
Market Drivers
Growing Demand for Natural and Herbal Ingredients in Cosmetic and Health Products
The Aloe Vera Extract Market benefits from a strong global shift toward natural, plant-based ingredients. Consumers are becoming more aware of the harmful effects of synthetic chemicals in cosmetics and health supplements. Aloe vera’s natural healing, anti-inflammatory, and moisturizing properties make it a preferred ingredient for skincare and pharmaceutical formulations. Companies are using aloe extracts in lotions, creams, and hair care lines targeting sensitive skin and anti-aging. The expansion of clean beauty and organic personal care products continues to boost market demand. Pharmaceutical manufacturers are also using aloe for wound healing and digestive applications. Retailers are expanding herbal product portfolios in response to wellness trends. It is gaining further acceptance among eco-conscious consumers seeking natural alternatives.
Rising Health Awareness and Expanding Functional Food and Beverage Industry
Increasing consumer focus on immunity and digestive health fuels aloe vera’s inclusion in beverages and dietary supplements. The extract’s rich nutrient composition supports product innovation in juices, yogurts, and functional drinks. The Aloe Vera Extract Market experiences growing adoption in nutraceuticals for detoxification and hydration benefits. Food manufacturers are promoting aloe-infused beverages for wellness-conscious consumers across all age groups. The trend toward preventive healthcare and self-care has strengthened the segment’s growth momentum. Global beverage brands are investing in aloe-based product lines targeting urban populations. R&D activities are optimizing formulations for taste, safety, and nutrient retention. It aligns with the global push for natural and health-enhancing ingredients.
- For instance, Lotte Chilsung Beverage exports its popular drinks “Let’s Be Aloe Juice” and “Milkis” to over 50 countries, including Russia, Europe, and Southeast Asia. The company’s 2025 financial reports indicate strong overseas growth supported by expanding global distribution and brand presence.
Advancements in Extraction Technologies and Improved Production Efficiency
Modern extraction processes have improved aloe vera’s yield and purity, ensuring consistent quality across industries. Cold-pressing, spray drying, and solvent-free techniques help maintain bioactive compound integrity. These technologies enable scalability, cost reduction, and sustainability in production. The Aloe Vera Extract Market is seeing investments in advanced processing plants in major producing countries. High-quality extracts enhance shelf life and product stability in food and cosmetic formulations. Producers are adopting energy-efficient systems to lower environmental impact. Government support for green technology adoption in the herbal sector strengthens manufacturing capabilities. It enhances overall competitiveness and aligns with sustainability objectives.
Increasing Applications in Pharmaceutical and Therapeutic Formulations
Pharmaceutical applications of aloe vera are expanding due to its proven efficacy in treating burns, ulcers, and skin disorders. The Aloe Vera Extract Market benefits from growing acceptance in drug formulations and dermatological preparations. Companies are developing standardized extracts for consistent medicinal properties. Its anti-inflammatory, antibacterial, and antioxidant qualities drive demand in topical and oral therapies. Hospitals and clinics prefer aloe-based ointments for wound healing and scar prevention. Research supports aloe’s effectiveness in metabolic and immune-boosting supplements. The rise in chronic skin and digestive conditions encourages product innovation. It strengthens aloe’s position as a trusted bioactive ingredient in modern medicine.
- For instance, Forever Living’s “Aloe Vera Gelly” was awarded an “EXCELLENT” rating in dermatological tests performed by Dermatest, as confirmed by product documentation and Dermatest assessments.
Market Trends
Rapid Expansion of Organic and Sustainable Product Offerings
The global shift toward organic living has accelerated the adoption of aloe-based products. Companies are launching certified organic aloe extracts to meet regulatory and consumer demands. The Aloe Vera Extract Market reflects strong alignment with sustainability principles through eco-friendly sourcing. Manufacturers are collaborating with certified growers to ensure traceable and pesticide-free supply chains. Packaging innovations using biodegradable materials enhance brand reputation. Consumers value transparency and prefer eco-conscious brands in beauty and wellness segments. Marketing campaigns highlighting ethical sourcing are influencing purchase decisions. It reinforces aloe vera’s image as a natural and sustainable solution.
- For instance: Aloecorp provides a self‑affirmed GRAS dossier for its aloe ingredients, documenting expert panel safety determination under U.S. food regulations; this primary filing gives buyers a verifiable quality and safety baseline in addition to certification‑based traceability.
Integration of Aloe Vera Extracts into Advanced Cosmeceutical Formulations
Aloe extracts are increasingly used in high-performance skincare and dermatological products. The Aloe Vera Extract Market benefits from innovation in serums, gels, and creams offering multi-functional benefits. Formulators are combining aloe with vitamins, peptides, and botanical antioxidants for targeted results. Companies are developing fast-absorbing and non-irritant formulations suitable for all skin types. Growing demand for clean-label and dermatologist-tested cosmetics fuels R&D in this direction. Social media trends highlight aloe-based products as essentials for sensitive and acne-prone skin. Brands emphasize clinically tested outcomes to enhance consumer trust. It encourages further investment in premium cosmeceutical innovation.
Expansion of Aloe-Based Beverages in Functional and Nutritional Categories
The food and beverage sector is adopting aloe extracts for healthy and functional drink formulations. Aloe juice, water, and infused products attract attention for their digestive and hydration benefits. The Aloe Vera Extract Market experiences increased product diversification targeting health-conscious consumers. Companies are experimenting with blends including fruit and herbal ingredients for improved flavor. Marketing focuses on natural energy and detoxification claims appealing to younger consumers. Product launches emphasize clean labeling and sugar-free options. The growth of e-commerce channels enhances accessibility across global regions. It supports consistent market expansion within wellness beverage categories.
- For instance: Grace Say Aloe Original 500 ml lists per‑100 ml nutrition of 81 kJ/19 kcal energy, 4.8 g carbohydrate, and 26 mg vitamin C (32% RI) on UK retail pages, with matching third‑party nutrition databases showing 19–39 kcal per 100 ml across SKUs, providing transparent, verifiable clean‑label metrics for consumers.
Rising Research on Therapeutic and Medicinal Applications of Aloe Compounds
Extensive studies on aloe’s bioactive compounds support its growing use in pharmaceuticals and nutraceuticals. Researchers explore aloe’s potential for anti-cancer, antimicrobial, and anti-diabetic properties. The Aloe Vera Extract Market benefits from patent filings and scientific validations driving new applications. Collaboration between academic and industry players accelerates clinical research. Regulatory recognition of aloe-based formulations promotes commercialization in new therapeutic areas. Investment in evidence-based herbal medicine continues to grow. Product developers are introducing standardized aloe extracts with improved efficacy. It supports aloe’s evolution from a traditional remedy to a scientifically backed ingredient.
Market Challenges Analysis
Inconsistent Quality and Limited Standardization in Raw Material Supply
The Aloe Vera Extract Market faces challenges related to uneven raw material quality and lack of standardization. Variations in cultivation practices, soil quality, and climate affect the concentration of active compounds. Inconsistent raw material supply impacts extraction efficiency and end-product stability. Manufacturers often struggle to maintain uniformity across batches, leading to regulatory and quality control issues. Smaller producers lack access to advanced testing facilities for purity verification. Supply chain gaps between growers and processors create inefficiencies. Market participants must adopt standardized cultivation and processing protocols. It requires stronger collaboration between farmers, certification bodies, and manufacturers.
Regulatory Barriers and Rising Competition from Synthetic Alternatives
The industry encounters complex regulations governing herbal extracts and nutraceutical ingredients. The Aloe Vera Extract Market must comply with varying safety and labeling norms across countries. Delays in approvals and limited harmonization restrict faster product launches. Synthetic alternatives with controlled formulations sometimes gain preference in pharmaceutical sectors. Competitive pressure from other herbal ingredients such as neem, turmeric, and green tea also challenges market dominance. Companies face difficulties in proving consistent efficacy and safety for medical-grade use. Certification and clinical validation add extra costs and time. It necessitates strategic investment in regulatory compliance and product differentiation.
Market Opportunities
Growing Expansion in Functional Beverages and Nutraceutical Formulations
The rising trend of health-oriented beverages presents strong growth opportunities for aloe-based drinks. Manufacturers are innovating with aloe-infused juices, smoothies, and dietary supplements. The Aloe Vera Extract Market benefits from increasing consumer interest in hydration and detox solutions. Nutraceutical companies are launching ready-to-drink formats emphasizing immune support and digestive balance. Advanced encapsulation techniques improve taste and nutrient stability. Marketing strategies highlight plant-based nutrition to attract vegan consumers. Partnerships with beverage companies expand aloe’s presence across convenience stores and online channels. It creates long-term potential for value-added product categories in wellness markets.
Emerging Scope in Pharmaceutical and Personal Care Applications Through Innovation
Technological innovation in extraction and formulation enables new product opportunities across pharmaceuticals and personal care. The Aloe Vera Extract Market can capitalize on rising research linking aloe compounds to faster wound healing and anti-inflammatory effects. Skincare brands are developing next-generation aloe-based serums, gels, and sprays for targeted results. Pharmaceutical producers explore aloe derivatives for controlled drug delivery systems. The trend toward clean and therapeutic skincare fosters collaborations between dermatologists and cosmetic scientists. Growing acceptance of plant-based medication in Asia-Pacific and Europe boosts development potential. Investments in R&D and clinical studies enhance market credibility. It positions aloe as a versatile bioactive ingredient with multi-industry relevance.
Market Segmentation Analysis:
By Product Type
The Aloe Vera Extract Market by product type includes liquid, gel, powder, and other forms. Liquid extracts dominate due to their widespread use in beverages and cosmetic formulations. Gel extracts are preferred for skincare products because of their soothing and hydrating qualities. Powder extracts are gaining demand in dietary supplements for their easy solubility and long shelf life. Other specialized forms are finding niche applications in pharmaceuticals and herbal preparations. Each form provides unique benefits that cater to specific end-user needs. Manufacturers are expanding portfolios with improved extraction methods. It enhances versatility across food, cosmetic, and wellness sectors.
- For instance, Lily of the Desert utilizes its patented Aloesorb™ process, which enriches aloe polysaccharides to improve nutrient absorption and support digestive health. The company highlights this technology in its product formulations to enhance the overall bioavailability of aloe’s natural compounds.
By Application
The Aloe Vera Extract Market finds major application in cosmetics and personal care, food and beverages, pharmaceuticals, nutraceuticals, and animal feed. Cosmetic and personal care uses lead the market, driven by demand for natural moisturizers and cleansers. Food and beverage applications are increasing with the rise of functional and detox drinks. Pharmaceuticals employ aloe in wound care and digestive supplements. Nutraceutical firms utilize its antioxidant properties in tablets and powders. Animal feed inclusion supports livestock immunity and health. Other segments, such as herbal wellness, continue to emerge. It shows wide adaptability across health-focused industries.
By Distribution Channel
Distribution in the Aloe Vera Extract Market occurs through offline and online channels. Offline retail, including pharmacies, supermarkets, and salons, continues to generate steady sales. Consumers prefer physical inspection of skincare and food products before purchase. However, online platforms are rapidly expanding due to convenience and product variety. E-commerce enables global access and supports small and organic brands. Retailers leverage digital marketing to reach health-conscious audiences. Hybrid distribution strategies are becoming common among major producers. It ensures higher visibility and broader market penetration.
- For instance, Walgreens retails a wide range of aloe vera gels, sprays, and juices through its nationwide network and online platform. The company supports both in-store pickup and same-day delivery, ensuring broad accessibility for aloe-based wellness and skincare products.
Segmentation:
By Product Type
By Application
- Cosmetics and Personal Care (e.g., moisturizers, sunscreens, cleansers)
- Food and Beverage (e.g., functional drinks, nutrition additives)
- Pharmaceuticals (e.g., treatments for burns, skin irritations, supplements)
- Nutraceuticals & Dietary Supplements
- Animal Feed
- Others (e.g., wellness and herbal medicine products)
By Distribution Channel
- Offline (e.g., grocery stores, pharmacies, salons)
- Online (e-commerce platforms)
By Region
- North America
- Europe
- Germany
- France
- U.K.
- Italy
- Spain
- Rest of Europe
- Asia Pacific
- China
- Japan
- India
- South Korea
- South-east Asia
- Rest of Asia Pacific
- Latin America
- Brazil
- Argentina
- Rest of Latin America
- Middle East & Africa
- GCC Countries
- South Africa
- Rest of the Middle East and Africa
Regional Analysis:
Asia-Pacific – Leading Market with 38% Share
Asia-Pacific holds the largest share of the Aloe Vera Extract Market, accounting for 38% of global revenue. The region benefits from abundant aloe cultivation in India, China, and Thailand. Strong demand for herbal cosmetics, functional beverages, and Ayurvedic products drives regional dominance. Governments in these countries support organic farming and herbal exports, strengthening market expansion. Local manufacturers have established efficient supply chains that lower production costs. Consumers show growing preference for clean-label and natural products. It continues to be the most dynamic region, supported by expanding wellness and personal care industries.
North America – Mature Market with 27% Share
North America represents 27% of the global Aloe Vera Extract Market, supported by the strong presence of skincare, nutraceutical, and beverage brands. The U.S. leads regional consumption due to high awareness of herbal and vegan ingredients. Consumers prioritize plant-based supplements and organic cosmetics, driving steady product uptake. Major companies focus on innovation and clinical testing to build trust in natural extracts. Retail channels such as health stores and e-commerce platforms play a vital role in accessibility. Regulatory standards for quality and safety encourage premium product development. It remains a stable, innovation-driven region emphasizing transparency and product authenticity.
Europe – Established Market with 21% Share; Other Regions Emerging
Europe captures 21% of the market, driven by rising interest in sustainable skincare and organic health solutions. Countries such as Germany, France, and the U.K. favor aloe-based formulations for dermatological use. Stringent product certification norms enhance consumer trust. Latin America and the Middle East & Africa are emerging markets with rising disposable incomes and growing preference for natural wellness products. Expanding retail networks and favorable trade partnerships improve product visibility. Investments in organic farming and local aloe processing are increasing. It positions emerging regions as new growth frontiers for global producers.
Shape Your Report to Specific Countries or Regions & Enjoy 30% Off!
Key Player Analysis:
- Terry Laboratories Inc.
- Aloe Laboratories Inc.
- Lily of the Desert Organic Aloeceuticals
- Forever Living Products International, LLC
- Herbalife Nutrition Ltd.
- Aloecorp Inc.
- Aloe Vera of America, Inc.
- Foodchem International Corporation
- Natural Aloe Costa Rica S.A.
- Aloe Farms Inc.
- Aloe Queen Inc.
- Pharmachem Laboratories Inc.
- Ashland LLC
Competitive Analysis:
The Aloe Vera Extract Market features strong competition among global and regional players focusing on product quality, sustainability, and innovation. Companies such as Terry Laboratories Inc., Aloecorp Inc., Herbalife Nutrition Ltd., and Forever Living Products International, LLC emphasize advanced extraction technologies and organic certification to strengthen brand credibility. It reflects a growing shift toward transparent sourcing and traceable supply chains. Firms are expanding portfolios with new formulations for cosmetics, pharmaceuticals, and functional beverages. Strategic collaborations with local farmers and investment in R&D help maintain steady supply and consistency in bioactive content. Online retail expansion and premium product launches enhance consumer reach and brand recognition. The market remains competitive, driven by differentiation through purity standards, sustainability initiatives, and diversification across multiple end-use industries.
Recent Developments:
- In June 2025, Herbalife Nutrition Ltd. achieved recognition from AOAC INTERNATIONAL for its proprietary method to detect aloins in aloe vera-derived ingredients, reinforcing its commitment to safety and quality standards.
- In July 2025, Herbalife announced that its aloin identification method for aloe vera had official certification, marking the first globally approved approach for measuring anthraquinones in ingestible botanical extracts.
Report Coverage:
The research report offers an in-depth analysis based on Product Type, Application and Distribution Channel. It details leading market players, providing an overview of their business, product offerings, investments, revenue streams, and key applications. Additionally, the report includes insights into the competitive environment, SWOT analysis, current market trends, as well as the primary drivers and constraints. Furthermore, it discusses various factors that have driven market expansion in recent years. The report also explores market dynamics, regulatory scenarios, and technological advancements that are shaping the industry. It assesses the impact of external factors and global economic changes on market growth. Lastly, it provides strategic recommendations for new entrants and established companies to navigate the complexities of the market.
Future Outlook:
- The Aloe Vera Extract Market will experience consistent growth driven by demand for herbal skincare and health products.
- Manufacturers will invest in advanced extraction technologies to enhance purity, shelf life, and bioactive efficiency.
- Functional food and beverage applications will expand, with aloe-infused drinks gaining mainstream adoption.
- Organic and vegan-certified products will strengthen global competitiveness among premium brands.
- Pharmaceutical firms will integrate standardized aloe extracts into dermatological and wound-healing formulations.
- E-commerce platforms will accelerate global product accessibility and drive small brand visibility.
- Research-backed product claims will gain importance, leading to more clinical trials and certifications.
- Sustainable farming practices and ethical sourcing will become essential for brand differentiation.
- Regional production in Asia-Pacific and Latin America will grow through government-backed cultivation programs.
- The Aloe Vera Extract Market will continue evolving toward diversified applications, ensuring steady global expansion.


