
| REPORT ATTRIBUTE | DETAILS |
|---|---|
| Historical Period | 2020-2023 |
| Base Year | 2024 |
| Forecast Period | 2025-2032 |
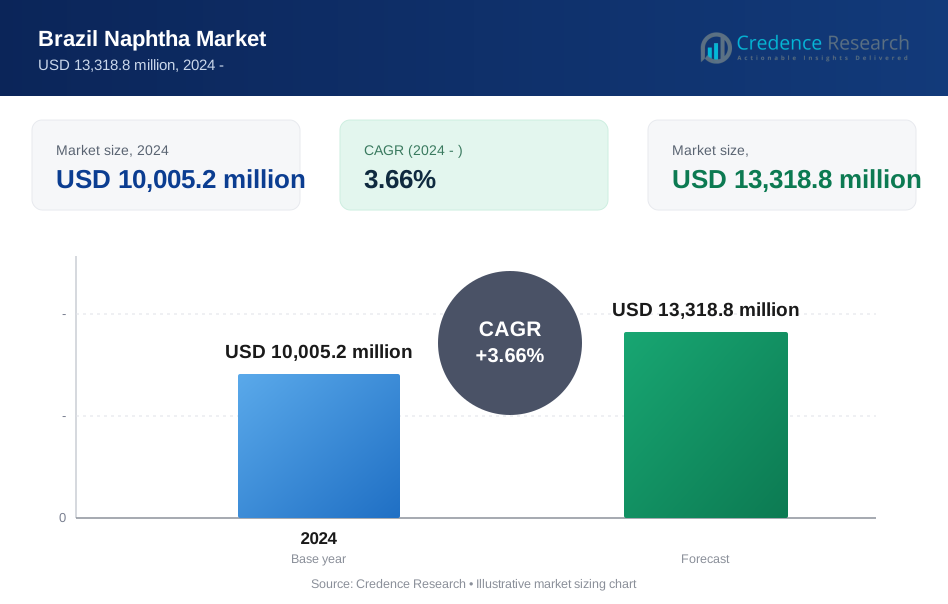
| Brazil Naphtha Market Size 2024 | USD 10,005.2 million |
| Brazil Naphtha Market, CAGR | 3.66% |
| Brazil Naphtha Market Size 2032 | USD 13,318.8 million |
Market Overview:
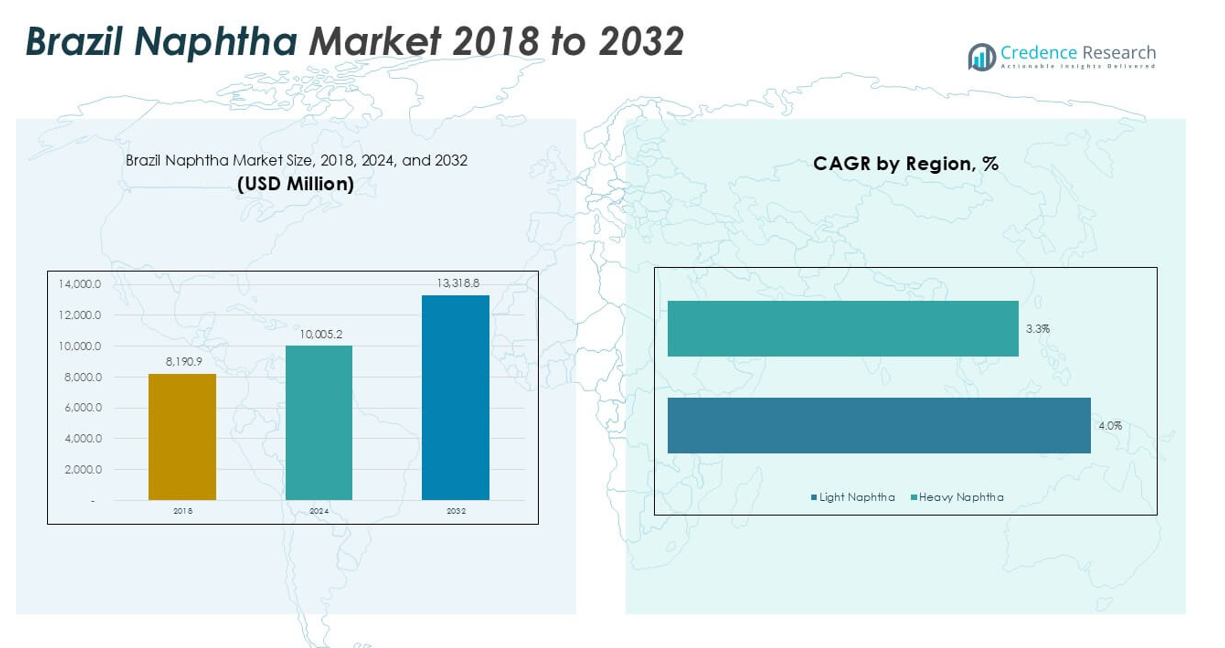
The Brazil Naphtha market size was valued at USD 8,190.9 million in 2018, reached USD 10,005.2 million in 2024, and is anticipated to reach USD 13,318.8 million by 2032, at a CAGR of 3.66% during the forecast period.
The Brazil Naphtha market is led by prominent players such as Petrobras, BP p.l.c., ADNOC, Chevron Corporation, Exxon Mobil Corporation, Reliance Industries, Shell, CNPC, PetroChina Company Limited, and Sinopec Corp. Petrobras maintains a dominant position through its extensive domestic refinery network and strong market integration. International companies strengthen their presence via advanced technologies and strategic alliances. The Southeast region stands out as the leading market, accounting for 46% of total market share in 2024, driven by its concentration of petrochemical complexes and well-established industrial infrastructure. This regional dominance supports ongoing investment and innovation among top industry participants.
Market Insights
- The Brazil Naphtha market reached USD 10,005.2 million in 2024 and is expected to grow to USD 13,318.8 million by 2032, reflecting a CAGR of 3.66% over the forecast period.
- Strong demand from the petrochemical industry, especially for light naphtha used as a feedstock, remains the primary market driver, with the segment holding approximately 62% share in 2024.
- Market trends highlight ongoing investments in refinery modernization and feedstock flexibility, as well as a shift toward advanced technologies to enhance production efficiency and environmental performance.
- The competitive landscape is shaped by major players such as Petrobras, BP p.l.c., Shell, Exxon Mobil Corporation, and Reliance Industries, all focusing on capacity expansions, strategic partnerships, and technological upgrades to secure market presence.
- The Southeast region leads with a 46% market share in 2024, followed by the South (19%) and Northeast (15%), while growth in less industrialized regions remains restrained by limited infrastructure and slower industrial development.
Market Segmentation Analysis:
By Product Type:
In the Brazil Naphtha market, Light Naphtha holds the dominant market share, accounting for approximately 62% of total volume in 2024. This sub-segment benefits from robust demand in petrochemical processing, particularly in the production of ethylene and propylene. Light Naphtha’s lower boiling range and high paraffin content make it a preferred choice for steam crackers. Growth in the country’s petrochemical industry, along with increasing investments in upgrading refinery infrastructure, further supports the expansion of this segment.
- For instance, Petrobras has invested in modernizing the Paulínia refinery (REPLAN) with a new distillation column capable of processing 434,000 barrels per day, enabling higher yield of light naphtha for ethylene crackers.
By Application:
Petrochemical Feedstock emerges as the leading application segment in the Brazil Naphtha market, representing nearly 72% of market share by volume in 2024. The widespread use of naphtha as a primary raw material in the manufacture of olefins and aromatics drives this dominance. The surging demand for plastics, synthetic fibers, and resins in both domestic and export markets reinforces the strategic importance of naphtha as a petrochemical feedstock. This segment’s growth is also propelled by ongoing expansion projects in Brazil’s downstream sector.
- For instance, Braskem operates a petrochemical complex in Camaçari that consumes 2.6 million tons of naphtha annually for production of ethylene and propylene.
By End-User:
The Petrochemical Industry is the principal end-user of naphtha in Brazil, commanding over 68% market share in 2024. Extensive consumption of naphtha for steam cracking and chemical manufacturing underlines this segment’s prominence. The rapid growth of Brazil’s plastics and chemicals sector, supported by favorable regulatory frameworks and investment incentives, continues to drive demand. Oil & Gas companies also utilize naphtha for gasoline blending and energy production, but their share remains secondary to the petrochemical industry’s requirements.
Market Overview
Strong Petrochemical Industry Expansion
The expansion of Brazil’s petrochemical sector serves as a primary growth driver for the naphtha market. Rising demand for plastics, synthetic resins, and specialty chemicals has led to increased consumption of naphtha as a key feedstock. Large-scale investments in new and upgraded petrochemical facilities, particularly in São Paulo and other industrial hubs, further accelerate this trend. The country’s growing role as a major supplier of basic chemicals to Latin American and global markets enhances the significance of naphtha in supporting downstream production capacity.
- For instance, Braskem completed an expansion at its Triunfo facility, increasing polyethylene production by 450,000 tons per year.
Growing Automotive Fuel Demand
An increase in automotive fuel requirements, particularly gasoline blending, is fueling naphtha demand across Brazil. As urbanization advances and vehicle ownership rises, refineries and blenders are leveraging naphtha to enhance fuel quality and meet tightening environmental standards. Government policies promoting cleaner fuels and advanced refinery technologies also stimulate growth in this segment. The evolving mobility landscape, coupled with rising fuel consumption in logistics and transportation, strengthens naphtha’s role in Brazil’s energy matrix.
- For instance, Petrobras’ REVAP refinery processes over 250,000 barrels of crude oil daily, blending naphtha to supply gasoline for major urban centers.
Favorable Regulatory and Investment Climate
Supportive regulatory frameworks and investment incentives provided by the Brazilian government have encouraged significant capital inflows into refining and petrochemical infrastructure. Streamlined permitting processes, tax benefits, and initiatives to attract foreign direct investment make Brazil an attractive destination for global chemical manufacturers. These factors collectively create a robust environment for capacity expansion, modernization of aging refineries, and integration of advanced technologies, all of which drive sustained growth in naphtha consumption.
Key Trends & Opportunities
Shift Toward Feedstock Flexibility
A major trend in the Brazil Naphtha market is the increasing adoption of flexible feedstock strategies by petrochemical producers. Companies are investing in technologies that allow seamless switching between naphtha, natural gas liquids, and alternative raw materials, optimizing costs and production yields. This trend enhances supply chain resilience, helps manage price volatility, and aligns with the industry’s drive for operational efficiency in response to dynamic market conditions.
- For instance, Shell’s Deer Park refinery has integrated a hydrocracking unit with a capacity of 70,000 barrels per day to process both naphtha and alternative feedstocks, supporting flexible production schedules.
Opportunities in Specialty Chemical Applications
Emerging opportunities for naphtha lie in its expanding use for specialty chemical production and value-added derivatives. As Brazilian manufacturers diversify their product portfolios, demand is rising for high-purity naphtha grades suitable for advanced applications, including solvents, specialty polymers, and performance materials. The development of downstream sectors and export-oriented chemical clusters further opens up avenues for market participants to capture higher margins in niche applications.
- For instance, Braskem has invested in a specialty chemicals unit capable of producing 120,000 tons of high-purity naphtha annually for solvents and pharmaceutical intermediates.
Key Challenges
Volatile Crude Oil Prices
Volatility in global crude oil prices remains a key challenge for the Brazil Naphtha market, as naphtha pricing is closely tied to oil benchmarks. Sudden fluctuations can disrupt procurement strategies, impact refinery margins, and lead to supply chain uncertainties. This volatility creates difficulties for market participants in planning production, budgeting, and maintaining long-term contracts, especially during periods of geopolitical instability or market shocks.
Competitive Pressure from Alternative Feedstocks
Brazilian naphtha producers face rising competitive pressure from alternative feedstocks, such as natural gas liquids and bio-based materials. The increasing adoption of ethane and propane in petrochemical production, driven by their cost-effectiveness and availability, threatens naphtha’s share in steam cracking applications. Companies must innovate and adapt to maintain competitiveness in the evolving feedstock landscape and respond to the industry’s focus on decarbonization and sustainability.
Environmental and Regulatory Compliance
Stringent environmental regulations regarding emissions, waste management, and fuel quality standards pose ongoing challenges for naphtha producers and end-users in Brazil. Compliance with evolving rules requires continuous investment in cleaner technologies, monitoring systems, and reporting mechanisms. Failure to adapt to stricter policies could result in financial penalties, operational restrictions, or reputational risks, making regulatory agility critical for long-term business viability.
Regional Analysis
Southeast Region
The Southeast region holds the largest share of the Brazil naphtha market, accounting for approximately 46% of the total, with a 2018 market value of USD 4,120 million. The region benefits from advanced petrochemical complexes and a high concentration of automotive and manufacturing industries, driving demand for both light and heavy naphtha. Light naphtha in this region grows at a robust CAGR of 4.00%, while heavy naphtha records a CAGR of 3.32%. Ongoing investments in infrastructure and technology further consolidate the Southeast as the market leader, leveraging port access and industrial integration for supply chain efficiency.
South Region
Representing nearly 19% of the national market, the South region posted a market value of USD 1,703 million in 2018. The area’s diversified manufacturing base, especially in chemicals and plastics, sustains solid demand for both light and heavy naphtha. Light naphtha demand advances at a 4.00% CAGR, with heavy naphtha following at 3.32%. Industrial modernization, coupled with effective logistics and regional investments, positions the South region for steady expansion. These dynamics ensure stable supply and support growing consumption across core industries, reinforcing the region’s important standing in Brazil’s naphtha landscape.
Northeast Region
The Northeast region comprises about 14% of the Brazil naphtha market, with a 2018 market value of USD 1,255 million. The chemical manufacturing and plastics sectors are primary growth engines, with light naphtha usage increasing at a CAGR of 4.00% and heavy naphtha at 3.32%. Strategic coastal location facilitates import and export activity, while government-backed industrial development programs continue to drive demand. As investments in new facilities rise, the region’s significance within the national naphtha supply chain grows, making it a focal point for future downstream expansion.
Midwest Region
Accounting for nearly 12% of national market value, the Midwest region recorded USD 1,076 million in 2018. The region’s agrochemical, packaging, and plastics industries are key consumers, with light naphtha showing a CAGR of 4.00% and heavy naphtha 3.32%. Infrastructure improvements and increased connectivity to upstream and downstream sectors bolster the Midwest’s role in the national supply network. The region’s industrial growth supports stable demand, enhancing its contribution to the broader Brazilian naphtha market and ensuring reliable supply to neighboring areas.
North Region
The North region holds around 9% market share, with a 2018 market value of USD 808 million. Light naphtha grows at a 4.00% CAGR, while heavy naphtha registers 3.32%, reflecting increasing consumption in energy and extractive industries. The region benefits from proximity to natural resource reserves and expanding industrialization, with recent infrastructure investments aimed at optimizing naphtha logistics and distribution. These efforts reinforce the North’s participation in the national market, ensuring continued supply chain integration and moderate but consistent market growth.
Market Segmentations:
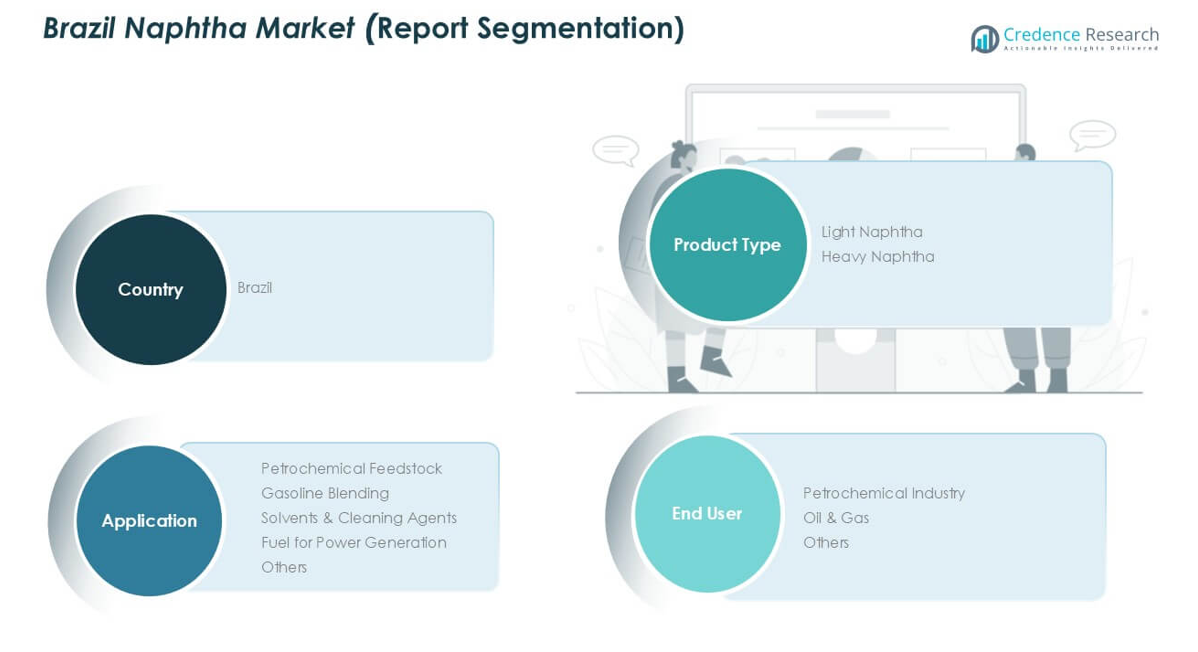
By Product Type:
- Light Naphtha
- Heavy Naphtha
By Application:
- Petrochemical Feedstock
- Gasoline Blending
- Solvents & Cleaning Agents
- Fuel for Power Generation
- Others
By End-User:
- Petrochemical Industry
- Oil & Gas
- Others
By Geography:
- Southeast Region
- South Region
- Northeast Region
- Midwest Region
- North Region
Competitive Landscape
The competitive landscape of the Brazil Naphtha market is characterized by the presence of major global and regional players that command significant market influence through integrated operations and robust supply chains. Leading companies such as BP p.l.c., ADNOC, Petrobras, Chevron Corporation, CNPC, Exxon Mobil Corporation, PetroChina Company Limited, Reliance Industries, Shell, and Sinopec Corp. compete based on product quality, production capacity, and distribution reach. Petrobras, as the country’s flagship energy company, leverages its strong domestic refinery network and deep-rooted industry relationships to maintain market leadership. International firms focus on technological advancements and strategic partnerships to optimize refinery output and enhance supply reliability. Ongoing investments in capacity expansions, feedstock flexibility, and sustainability initiatives are central to maintaining competitive advantage. The market also witnesses increased collaboration between local and international players, which enhances operational efficiency and accelerates the adoption of advanced technologies across the sector.
Key Player Analysis
- BP p.l.c.
- ADNOC
- Petrobras
- Chevron Corporation
- CNPC
- Exxon Mobil Corporation
- PetroChina Company Limited
- Reliance Industries
- Shell
- Sinopec Corp.
Recent Developments
- In June 2025, Petrobras and ExxonMobil formed a consortium that successfully bid for and secured ten blocks in the Foz do Amazonas basin during a Brazilian oil and gas auction. Petrobras and ExxonMobil will be equal partners in these ten blocks, with each company operating five blocks. Additionally, a Chevron-led consortium, including China's CNPC, also won nine blocks in the same auction.
- In June 2025, CNPC, alongside Chevron, acquired nine blocks in Brazil's Foz do Amazonas basin. This acquisition signifies a notable expansion of CNPC's presence in Brazil's upstream oil and gas sector. The Foz do Amazonas basin is part of Brazil's Equatorial Margin, which is considered a promising area for exploration due to its geological similarities with the prolific fields in Guyana.
- In June 2025, Petrobras led consortia that secured multiple offshore exploration blocks in Brazil’s Foz do Amazonas basin, a region considered resource-rich and strategically important for future feedstock supply, including naphtha.
- In June 2024, BP announced its intention to explore the production of second-generation ethanol and sustainable aviation fuel in Brazil, marking a significant shift towards renewable energy sources. This move, following BP's acquisition of Bunge's stake in their joint biofuel venture, BP Bunge Bioenergia, signals a strategic pivot away from traditional naphtha-based operations.
Market Concentration & Characteristics
The Brazil Naphtha market demonstrates a moderate to high level of market concentration, with a small group of multinational and domestic companies controlling a significant share of production and distribution. Leading industry participants such as Petrobras, BP p.l.c., Shell, Exxon Mobil Corporation, and Reliance Industries leverage integrated operations, extensive refinery networks, and established supply chains to maintain competitive advantage. The market features strong vertical integration, with major players involved from feedstock sourcing through to end-user delivery, which supports cost efficiency and supply reliability. Regional demand patterns reflect the concentration of Brazil’s industrial and petrochemical infrastructure, with the Southeast region accounting for the largest share due to its advanced manufacturing base and proximity to key ports. Product differentiation remains limited, with most competition centered on pricing, production capacity, and logistical efficiency. Investments in refinery modernization and advanced processing technologies shape the competitive dynamics, while regulatory standards and environmental requirements increasingly influence strategic decision-making in the sector.
Report Coverage
The research report offers an in-depth analysis based on Product Type, Application, End-User and Geography. It details leading market players, providing an overview of their business, product offerings, investments, revenue streams, and key applications. Additionally, the report includes insights into the competitive environment, SWOT analysis, current market trends, as well as the primary drivers and constraints. Furthermore, it discusses various factors that have driven market expansion in recent years. The report also explores market dynamics, regulatory scenarios, and technological advancements that are shaping the industry. It assesses the impact of external factors and global economic changes on market growth. Lastly, it provides strategic recommendations for new entrants and established companies to navigate the complexities of the market.
Future Outlook
- Brazil’s naphtha market is projected to witness steady expansion driven by continued growth in petrochemical output.
- Companies will focus on enhancing feedstock flexibility to optimize costs and adapt to variable oil markets.
- Refinery upgrades and capacity expansions will support increased naphtha production and quality improvements.
- Leading players will implement advanced processing technologies to meet tightening environmental regulations.
- Strategic partnerships between domestic and international firms will accelerate innovation and infrastructure development.
- Growing demand for specialty-grade naphtha will create opportunities in high-value chemical applications.
- Investment in downstream logistics will improve supply efficiency and reduce delivery lead times.
- The Southeast region will maintain dominance, but emerging regional hubs will gain traction through targeted infrastructure projects.
- Digitalization and automation will increase operational efficiency across the naphtha value chain.
- Companies will place greater emphasis on sustainability initiatives, including emissions reduction and clean energy integration.
Request a Free Sample
Fill in your details and we'll send you a free sample report.
- Sample data tables & charts
- Research methodology
Need a Custom Version of This Report?
Tailor the scope, geography, or segments to your exact requirements.
- Custom geography or segment scope
- Direct access to our analyst team
Frequently Asked Questions
What is the current size of the Brazil Naphtha Market?
What factors are driving the growth of the Brazil Naphtha Market?
What are some challenges faced by the Brazil Naphtha Market?
Who are the major players in the Brazil Naphtha Market?
Table of Content
Chapter 1. Report Introduction
- 1.1 Report Description & Purpose
- 1.1.1 Report Title & Market Definition
- 1.1.2 Unique Selling Propositions (USP) & Key Differentiators
- 1.1.3 Value Proposition for Stakeholders
- 1.2 Research Objectives
- 1.2.1 Market Sizing Objectives (Volume & Revenue)
- 1.2.2 Segmentation Objectives
- 1.2.3 Competitive Intelligence Objectives
- 1.2.4 Forecast & Scenario Objectives
- 1.3 Report Scope
- 1.3.1 Brazil Naphtha Scope – Types & Subtypes Covered
- 1.3.2 Geographic Scope – Regions & Countries Covered
- 1.3.3 Historical Period, Base Year & Forecast Period (2024; forecast to the forecast period)
- 1.3.4 Inclusions & Exclusions
- 1.4 HS Code & Classification Framework
- 1.5 Currency, Units & Pricing Basis
- 1.6 Target Stakeholders
- 1.7 Limitations & Assumptions
Chapter 2. Executive Summary
- 2.1 Global Brazil Naphtha Market Snapshot
- 2.1.1 Market Size – Historical (2024) & Forecast (the forecast period) (2024: USD 10,005.2 million → forecast year: USD 13,318.8 million)
- 2.1.2 Volume & Revenue – Global Totals
- 2.1.3 Key Market Highlights – Top Five Facts
- 2.2 Brazil Naphtha Market Segmentation Snapshot
- 2.2.1 Market Split by Region – 2024 vs.
- 2.3 Competitive Snapshot
- 2.3.1 Top 10 Players by Revenue Share – 2024
- 2.3.2 Top 10 Players by Volume Share – 2024
- 2.3.3 Recent Strategic Developments (18-Month Summary)
- 2.4 Key Investment Highlights & Strategic Conclusions
Chapter 3. Brazil Naphtha Market Dynamics & Industry Analysis
- 3.1 Market Overview & Context
- 3.1.1 Brazil Naphtha Market Position in the Broader Automotive Value Chain
- 3.1.2 OEM vs. Replacement Market Dynamics
- 3.1.3 Market Maturity & Development Stage by Region
- 3.2 Brazil Naphtha Market Drivers
- 3.3 Brazil Naphtha Market Restraints & Challenges
- 3.4 Brazil Naphtha Market Opportunities
- 3.5 Porter's Five Forces Analysis
- 3.5.1 Threat of New Entrants
- 3.5.2 Bargaining Power of Suppliers
- 3.5.3 Bargaining Power of Buyers
- 3.5.4 Threat of Substitutes
- 3.5.5 Competitive Rivalry – Intensity Assessment
- 3.6 Brazil Naphtha Value Chain Analysis
- 3.6.1 Upstream – Raw Material/Input Suppliers
- 3.6.1.1 Raw Material/Input 1
- 3.6.1.2 Raw Material/Input 2
- 3.6.1.3 Raw Material/Input 3
- 3.6.2 Midstream – Production/Manufacturing/Service Delivery
- 3.6.2.1 Production/Process Overview
- 3.6.2.2 Key Facility Locations & Capacity by Manufacturer
- 3.6.3 Downstream – Distribution & End Consumer
- 3.6.3.1 Primary Channel – B2B/OEM
- 3.6.3.2 Secondary Channels – Dealer, Retail, Online, Direct
- 3.6.4 Value Chain Profitability Analysis
- 3.6.1 Upstream – Raw Material/Input Suppliers
- 3.7 PESTEL Analysis
- 3.7.1 Political Factors
- 3.7.2 Economic Factors
- 3.7.3 Social Factors
- 3.7.4 Technological Factors
- 3.7.5 Environmental Factors
- 3.7.6 Legal Factors
- 3.8 Brazil Naphtha Supply Chain Analysis
- 3.8.1 Raw Material/Input Supply Risk Assessment
- 3.8.2 Manufacturing Concentration Risk (Geographic Exposure)
- 3.8.3 Trade Disruption Impact Analysis
- 3.9 Regulatory & Policy Landscape
Note: The regulatory and policy landscape section covers regulations based on their applicability to the market, Brazil Naphtha category, geography, and scope of the study. Only regulatory frameworks with a material impact on operations, compliance, trade, sustainability, or market access are analyzed in detail.
Chapter 4. Key Investment Pockets & Opportunity Analysis
- 4.1 Brazil Naphtha Market Attractiveness Analysis
- 4.1.1 By Region – Investment Attractiveness Matrix (Volume × CAGR)
- 4.2 Absolute Revenue Growth Opportunity
- 4.2.1 By Region – Absolute USD Growth Through the forecast period
- 4.3 Incremental Volume Opportunity
- 4.3.1 By Region – Incremental Volume Through the forecast period
- 4.3.2 Segment – Incremental Volume
- 4.4 Emerging Submarket Opportunity Deep Dive (Subject to Applicability)
- 4.5 Emerging Market Opportunity Scorecards
- 4.5.1 United States
- 4.5.2 Europe
- 4.5.3 Asia
- 4.5.4 Middle East & Africa
Note: Emerging Market Opportunity Scorecards will be included based on relevance and strategic importance. Regions listed are indicative and may vary depending on data availability and market dynamics.
Chapter 5. Brazil Naphtha Import-Export Analysis & Trade Flows
- 5.1 Global Trade Overview
- 5.1.1 Global Export Value by Country (2024)
- 5.1.2 Global Export Volume by Country (2024)
- 5.1.3 Global Import Value by Country (2024)
- 5.1.4 Global Import Volume by Country (2024)
- 5.1.5 Net Trade Balance by Country (2024)
- 5.2 Export Analysis – Segment
- 5.2.1 Type 1 (HS Code)
- 5.2.2 Type 2 (HS Code)
- 5.2.3 Type 3 (HS Code)
- 5.2.4 Type 4 (HS Code)
- 5.2.5 Type 5 (HS Code)
- 5.3 Import Analysis – Segment
- 5.3.1 Type 1 (HS Code)
- 5.3.2 Type 2 (HS Code)
- 5.3.3 Type 3 (HS Code)
- 5.3.4 Type 4 (HS Code)
- 5.3.5 Type 5 (HS Code)
- 5.4 Average Unit Trade Prices
- 5.4.1 Average Export Price – Segment & Country
- 5.4.2 Average Import Price – Segment & Source Country
- 5.4.3 Price Trends (2024)
- 5.5 Key Trade Route Analysis
- 5.5.1 Trade Route 1
- 5.5.2 Trade Route 2
- 5.5.3 Trade Route 3
- 5.5.4 Trade Route 4
- 5.5.5 Trade Route 5
- 5.6 Trade Policy Impact Assessment
- 5.6.1 US Anti-Dumping & Section 301 Tariffs
- 5.6.2 EU Customs Union Impact
- 5.6.3 Major Free Trade Agreements
- 5.6.4 USMCA Rules of Origin
Note: Trade policy analysis will be included only where relevant to the Brazil Naphtha market.
Chapter 6. Competitive Landscape & Company Benchmarking
- 6.1 Brazil Naphtha Market Concentration & Structure
- 6.1.1 Herfindahl-Hirschman Index (HHI) – vs. 2024
- 6.1.2 Tier 1, Tier 2 & Tier 3 Market Structure
- 6.1.3 Global, Regional & Local Player Dynamics
- 6.2 Brazil Naphtha Market Share Analysis – 2024
- 6.2.1 Global Revenue Share by Company
- 6.2.2 Global Volume Share by Company
- 6.2.3 Regional Revenue Share
- 6.2.4 Market Share Evolution ( vs. 2024)
- 6.2.5 OEM Segment Share by Company
- 6.2.6 Replacement Segment Share by Company
- 6.3 Production/Delivery Capacity & Facility Analysis
- 6.3.1 Global Installed Capacity
- 6.3.2 Capacity Utilization Rates
- 6.3.3 Production/Output Volume
- 6.3.4 Facility Locations & Capacity Map
- 6.3.5 Planned Capacity Additions
- 6.4 Brazil Naphtha Competitive Benchmarking Matrix
- 6.4.1 Revenue, Volume, CAGR & Profitability Comparison
- 6.4.2 Channel Revenue Mix
- 6.4.3 Geographic Revenue Exposure
- 6.4.4 R&D Intensity
- 6.4.5 Sustainability Maturity
- 6.5 Strategic Developments in Brazil Naphtha (Last 24 Months)
- 6.5.1 Mergers, Acquisitions & Divestments
- 6.5.2 New Brazil Naphtha Launches
- 6.5.3 Facility Expansions
- 6.5.4 Strategic Alliances, Joint Ventures & Partnerships
- 6.5.5 Distribution Expansion & Market Entry
- 6.5.6 Sustainability & ESG Initiatives
- 6.6 Competitive Strategy Mapping
- 6.6.1 Leader, Challenger, Follower & Niche Classification
- 6.6.2 Pricing Strategy Comparison
- 6.6.3 Channel Strategy Matrix
Note: Strategic developments are included based on their materiality and the availability of reliable information.
Chapter 7. Global Brazil Naphtha Market – By Distribution Channel
- 7.1 Segment Overview
- 7.1.1 Volume & Revenue Split by Channel (2024 & )
- 7.1.2 Channel Mix Evolution (the forecast period)
Chapter 8. Regional Market Analysis – Global Overview
- 8.1 Global Regional Overview
- 8.1.1 Regional Volume Share
- 8.1.2 Regional Revenue Share
- 8.1.3 Regional Volume by Region
- 8.1.4 Regional Revenue by Region
- 8.1.5 Regional Forecast Through the forecast period
- 8.2 Cross-Regional Segment Analysis
- 8.2.1 By Distribution Channel
- 8.2.2 By Brand/Price Tier
Chapter 9. North America Brazil Naphtha Market
- 9.1 United States
- 9.2 Canada
- 9.3 Mexico
Chapter 10. Europe Brazil Naphtha Market
- 10.1 Germany
- 10.2 France
- 10.3 Italy
- 10.4 United Kingdom
- 10.5 Spain
- 10.6 Poland
- 10.7 Russia
- 10.8 Netherlands
- 10.9 Belgium
- 10.10 Sweden
- 10.11 Denmark
- 10.12 Norway
- 10.13 Rest of Europe
Chapter 11. Asia Pacific Brazil Naphtha Market
- 11.1 China
- 11.2 India
- 11.3 Japan
- 11.4 South Korea
- 11.5 Thailand
- 11.6 Indonesia
- 11.7 Vietnam
- 11.8 Malaysia
- 11.9 Australia
- 11.10 Rest of Asia Pacific
Chapter 12. Latin America Brazil Naphtha Market
- 12.1 Brazil
- 12.2 Argentina
- 12.3 Colombia
- 12.4 Chile
- 12.5 Rest of Latin America
Chapter 13. Middle East Brazil Naphtha Market
- 13.1 Saudi Arabia
- 13.2 United Arab Emirates
- 13.3 Turkey
- 13.4 Israel
- 13.5 Iran
- 13.6 Rest of the Middle East
Chapter 14. Africa Brazil Naphtha Market
- 14.1 South Africa
- 14.2 Egypt
- 14.3 Nigeria
- 14.4 Morocco
- 14.5 Rest of Africa
Chapter 15. Brazil Naphtha Company Profiles
- 15.1 [Company 01]
- 15.1.1 Company Overview
- 15.1.2 Key Management Personnel
- 15.1.3 Products & Services Portfolio
- 15.1.4 Financial Performance
- 15.1.5 Key Market Focus & Geographic Presence
- 15.1.6 Recent Developments & Strategic Initiatives
Note: The company profile list is preliminary and may change based on research findings, market developments, data availability, and client requirements.
Chapter 16. Appendices
- Appendix A – List of Abbreviations & Acronyms
- Appendix B – Industry Classification Code Reference – Full Series
- Appendix C – Production & Capacity Data Tables
- Appendix D – End-Use & Demand Base Tables
- Appendix E – Consumption & Replacement Rate Assumptions
- Appendix F – ASP Reference Tables
- Appendix G – Manufacturing & Facility Database
- Appendix H – Import-Export Data Tables
- Appendix I – Regulatory Summary Tables
- Appendix J – Primary Research Participant List (Anonymized)
- Appendix K – Primary Research Questionnaire Framework
- Appendix L – Data Sources & Bibliography
- Appendix M – Market Size Divergence & Source Comparison
Chapter 17. Research Methodology
- 17.1 Research Framework & Philosophy
- 17.2 Secondary Research – Sources, Hierarchy & Data Extraction
- 17.3 Data Modeling – Bottom-Up & Top-Down Market Sizing
- 17.4 Primary Research – Stakeholder Framework, LOI & Sample Sizes
- 17.5 Forecast Methodology – Regression, Scenario & Sensitivity Analysis
- 17.6 Quality Control – Four-Layer Validation Framework
- 17.7 Limitations & Standard Assumptions
- 17.8 Disclaimer
