
Market Overview
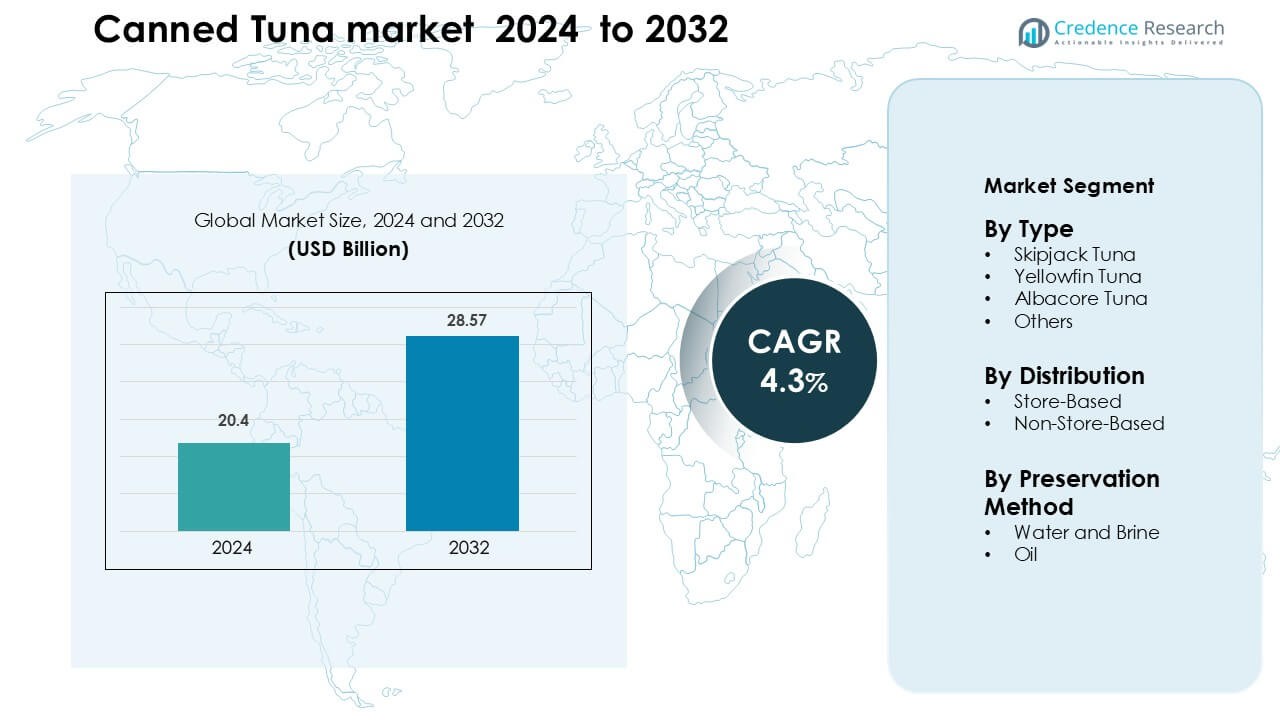
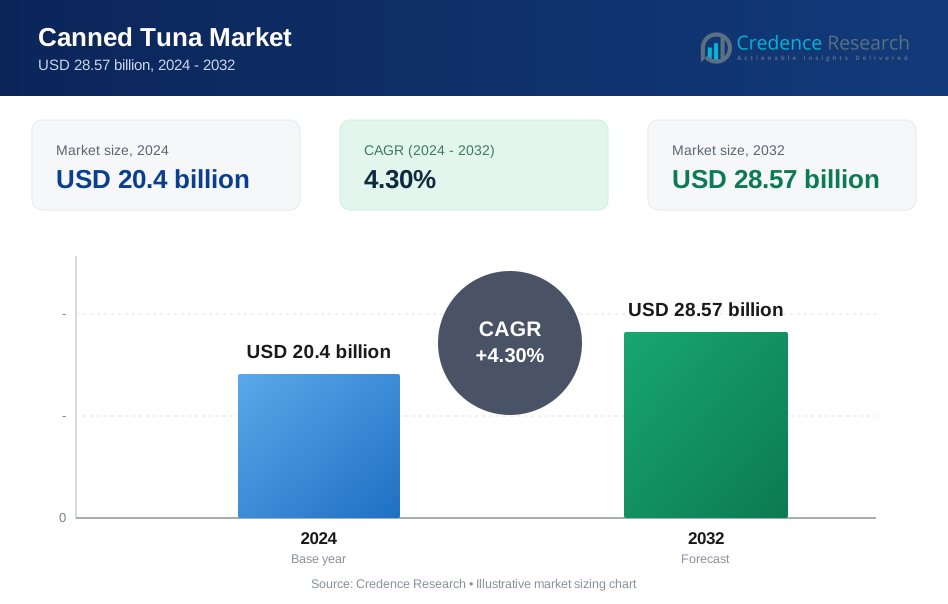
Canned Tuna market was valued at USD 20.4 billion in 2024 and is anticipated to reach USD 28.57 billion by 2032, growing at a CAGR of 4.3 % during the forecast period.
| REPORT ATTRIBUTE | DETAILS |
|---|---|
| Historical Period | 2020-2023 |
| Base Year | 2024 |
| Forecast Period | 2025-2032 |
| Canned Tuna Market Size 2024 | USD 20.4 Billion |
| Canned Tuna Market, CAGR | 4.3 % |
| Canned Tuna Market Size 2032 | USD 28.57 Billion |
The canned tuna market is shaped by major players such as Bumble Bee Foods LLC, Golden Prize Canning Co. Ltd., Wild Planet Foods Inc., StarKist Co., Century Pacific Food Inc., Grupo Albacora SA, American Tuna Inc., Thai Union Group PLC, Crown Prince Inc., and E.C. Canning Company Limited. These companies compete through sustainable sourcing, flavor innovation, diversified packaging formats, and strong retail partnerships. Asia Pacific remains the leading region with about 33% share, supported by large-scale processing hubs in Thailand, the Philippines, and Indonesia. Strong export capacity and competitive pricing help the region maintain its dominant global position.
Market Insights
- Canned Tuna market was valued at USD 20.4 billion in 2024 and is anticipated to reach USD 28.57 billion by 2032, growing at a CAGR of 4.3 % during the forecast period.
- Demand rises due to growing interest in affordable, high-protein, shelf-stable foods, with skipjack tuna holding about 54% share because of its wider availability and lower cost.
- Premiumization accelerates as consumers adopt flavored, clean-label, and ready-to-eat tuna formats, while sustainability-certified products gain consistent traction across retail channels.
- Competition intensifies as leading processors expand automation, reduce production waste, and strengthen retailer partnerships to offset raw material volatility and supply-chain risks.
- Asia Pacific leads with 33% share, driven by strong processing hubs and export capacity, followed by North America at 32% and Europe at 29%, while store-based distribution dominates with over 70% market share across major regions.
Market Segmentation Analysis:
By Type
Skipjack tuna leads the type segment with about 54% share due to its lower cost, wide availability, and strong use in mass-market canned products. Food processors prefer skipjack because the species offers fast procurement cycles and stable supply volumes from key fishing regions such as Indonesia and the Western Pacific. Yellowfin and albacore follow as premium choices driven by higher protein content and cleaner flavor profiles. Demand for these variants grows as brands promote sustainable sourcing and mercury-tested labels across retail and online channels.
- For instance, Thai Union is a key participant in the multi-stakeholder Sustainable Indian Ocean Tuna Initiative (SIOTI) purse-seine Fishery Improvement Project (FIP), which targets a significant volume of skipjack, yellowfin, and bigeye tuna. This initiative is part of Thai Union's commitment to move its entire supply chain toward 100% sustainable sourcing and traceability, in alignment with the Marine Stewardship Council (MSC) standard.
By Distribution Channel
Store-based outlets dominate this segment with nearly 72% share as supermarkets and hypermarkets remain the primary platforms for canned seafood purchases. Shoppers prefer these channels because they provide bulk packs, private-label options, and regular promotional pricing. Large chains also expand shelf space for sustainable tuna lines, boosting visibility for MSC-certified varieties. Non-store channels grow quickly as e-commerce platforms attract urban buyers seeking convenient delivery, mixed-brand bundles, and subscription packs for routine household consumption.
- For instance, in the UK, Tesco introduced three own-brand MSC-labelled canned tuna SKUs (sourced from Papua New Guinea) in major supermarket stores, adding to its sustainability footprint.
By Preservation Method
Water and brine products lead this segment with about 61% share due to rising demand for low-fat and clean-label seafood options. Health-focused consumers choose water-packed tuna because it offers lower calories and higher protein retention compared with oil-packed formats. Brands strengthen this trend by marketing no-salt and lightly salted versions. Oil-based tuna maintains steady demand in culinary applications, especially in Europe and the Middle East, where richer texture and enhanced flavor support its use in salads, pasta dishes, and ready-to-eat meals.
Key Growth Drivers
Rising Demand for Affordable and Convenient Protein
Growing preference for quick, shelf-stable meals boosts canned tuna consumption across households worldwide. Many buyers seek protein-rich options that cost less than fresh seafood or meat, helping canned tuna stay competitive during economic pressure. High portability also supports use in lunch boxes, travel packs, and emergency food kits. Retailers expand value packs and private-label lines, strengthening buyer reach and enabling wider price coverage. Awareness of tuna’s lean protein, omega-3 content, and low preparation effort keeps demand strong among students, working adults, and fitness-focused consumers. This steady need for convenient protein acts as a major growth pillar for the market.
- For instance, John West Foods offers a 12-pack of 95 g tuna chunks in springwater, each can deliver about 15.7 g of protein, making it ideal for quick, high-protein meals without refrigeration.
Expansion of Retail Infrastructure and E-Commerce Adoption
Supermarkets, hypermarkets, and discount chains continue to widen their seafood aisles, giving canned tuna greater visibility through multi-brand shelving and promotional bundles. Many chains also place tuna in wellness and high-protein food sections to appeal to health-oriented buyers. Online platforms gain traction as delivery apps promote mixed-flavor packs, subscription bundles, and diet-focused tuna assortments. Digital buyers value long shelf life and ease of bulk ordering, which supports higher online penetration. Stronger supply coordination between processors and modern retail systems improves stock stability, packaging variety, and country-wide product launch cycles, fueling continuous expansion of the market.
- For instance, in the UK, Tesco introduced three own-brand Marine Stewardship Council (MSC)-labelled canned tuna SKUs sourced from Papua New Guinea in early 2022, and has committed to sourcing 100% of the tuna for its own-brand canned range from MSC-certified fisheries by the end of 2025.
Growth of Sustainable and Traceable Tuna Sourcing
Consumers increasingly prefer seafood backed by sustainability labels, and this shift boosts modern canned tuna lines. MSC-certified products, pole-and-line tuna, and FAD-free catch methods gain market traction due to rising environmental concerns. Brands update sourcing policies to include traceable fishing zones, vessel monitoring, and mercury-testing protocols. Retailers highlight traceability dashboards and QR-code tracking, improving consumer trust. Fishing nations also adopt stronger catch-management rules, supporting resource stability and long-term supply. This alignment of brands, regulators, and environmental groups drives steady demand for responsibly sourced canned tuna.
Key Trend & Opportunity
Premiumization Through New Flavors and Healthy Formulations
Brands introduce gourmet variants such as herb-infused, smoked, chili-spiced, and olive-oil blends to meet the growing appeal of premium seafood snacks. Health-oriented lines like no-salt, high-protein, keto-friendly, and clean-label tuna expand demand among young urban consumers. Ready-to-eat bowls, salad kits, and single-serve pouches strengthen the snacking and lunch-on-the-go category. Premium packaging, such as peel-top metal cans and eco-friendly materials, also helps brands differentiate in crowded retail shelves. These innovations open new revenue channels and lift margins across developed and emerging markets.
- For instance, Genova Seafood, which sells Yellowfin tuna in Calabrian Chili-infused olive oil (113 g can) this gourmet variant offers 29 g of protein per serving and is hand-filleted for premium texture.
Rising Adoption of Automation and Advanced Processing Technologies
Automation in cutting, cleaning, cooking, and canning reduces waste and improves product consistency, supporting higher throughput in major processing hubs. Modern sealing and sterilization systems increase shelf stability while retaining texture and nutritional quality. Processors invest in real-time quality monitoring and equipment that improves yield from each catch. Adoption of digital supply-chain tools also enhances traceability and reduces shipment delays. These operational gains create opportunities for manufacturers to scale production, lower processing costs, and launch value-added formats that meet growing global demand.
Expansion into Institutional and Foodservice Channels
Canned tuna gains popularity in hotels, airline catering, workplace cafeterias, and quick-service restaurants due to its stable supply and easy storage. Many chains add tuna wraps, bowls, and sandwiches to meet demand for healthy and protein-rich menu items. Institutional buyers prefer canned formats over fresh options because they reduce wastage and simplify portion planning. Expanding partnerships with foodservice distributors allows brands to boost bulk-volume sales and improve long-term contract security, opening a strong growth avenue beyond household consumption.
Key Challenge
Overfishing Concerns and Stricter Sustainability Regulations
Pressure on global tuna stocks forces many countries to introduce tighter catch limits, fishing-zone restrictions, and vessel-monitoring rules. These policies increase operational costs for fleets and processors, especially in regions facing stock depletion. Brands with limited traceability capabilities struggle to align with retailer and regulator expectations. Rising criticism from environmental groups can also affect buyer perception and weaken demand for non-certified tuna. Compliance with evolving sustainability norms is essential but costly, creating supply uncertainty and operational complexity for the market.
Volatile Raw Material Prices and Supply Chain Disruptions
Tuna prices fluctuate due to fuel costs, climatic shifts, El Niño effects, and changing catch volumes across major fishing grounds. These swings directly affect processor margins and force frequent price adjustments across retail channels. Shipping delays, port congestion, and container shortages increase delivery time for both raw fish and finished products. Manufacturers face higher logistics expenses and difficulty maintaining stable retail pricing. This strain can reduce competitiveness against other shelf-stable protein sources, making price volatility a key barrier to long-term market stability.
Regional Analysis
North America
North America holds about 32% share of the canned tuna market, driven by strong consumption in the U.S. and growing demand for protein-rich, ready-to-eat foods. Retailers expand private-label tuna lines, while health-focused consumers favor water-packed and low-sodium options. Sustainability certifications such as MSC and FAD-free labels gain traction, shaping purchasing decisions across major supermarket chains. E-commerce adoption rises as buyers prefer bulk delivery and subscription packs. Increasing workplace meal kits and pantry-stocking habits further support steady market growth across the region.
Europe
Europe accounts for nearly 29% share, supported by high consumption in Spain, Italy, the U.K., and France. Mediterranean diets fuel strong usage of tuna in salads, pasta dishes, and ready-meal formats. Consumers show strong preference for premium oil-packed and gourmet flavored variants. Strict sustainability expectations push retailers to prioritize traceable and certified tuna, shaping sourcing standards for suppliers. Demand also rises through discount chains and private-label expansions. The region’s focus on environmental compliance and healthier seafood choices reinforces long-term market stability.
Asia Pacific
Asia Pacific leads with about 33% share, driven by strong production capabilities in Thailand, Indonesia, and the Philippines, which serve both domestic and export markets. Rising urbanization, expanding retail networks, and growing protein requirements boost household consumption. Japan and South Korea prefer premium albacore and ready-to-eat tuna dishes, while Southeast Asian markets favor value-packed formats. E-commerce platforms accelerate growth through mixed-brand bundles and convenient delivery. Regional supply advantages provide competitive pricing, making Asia Pacific the global center for canned tuna manufacturing and distribution.
Latin America
Latin America holds nearly 4% share, supported by rising tuna consumption in Mexico, Brazil, and Chile. Affordable protein needs drive steady demand for skipjack-based products across mass-market retail channels. Local brands expand flavored and oil-packed variants to match regional taste preferences. Government nutrition programs and school-meal initiatives also support volume growth. Improving retail penetration and increased availability of multipack formats strengthen household purchasing. Despite modest share, the region shows strong growth potential through expanding middle-income populations and wider distribution coverage.
Middle East & Africa
The Middle East & Africa region captures about 2% share, with demand concentrated in Gulf countries such as Saudi Arabia, the UAE, and Kuwait. High reliance on imported seafood boosts canned tuna usage due to its long shelf life and stable pricing. Consumers prefer oil-packed and flavored variants for culinary use in salads and rice dishes. Growing modern retail infrastructure and expatriate populations support stronger product visibility. African markets show rising interest in budget-friendly tuna formats as urbanization expands. Limited local processing capacity creates strong opportunities for exporters targeting the region.
Market Segmentations:
By Type
- Skipjack Tuna
- Yellowfin Tuna
- Albacore Tuna
- Others
By Distribution
- Store-Based
- Non-Store-Based
By Preservation Method
- Water and Brine
- Oil
By Geography
- North America
- U.S.
- Canada
- Mexico
- Europe
- Germany
- France
- U.K.
- Italy
- Spain
- Rest of Europe
- Asia Pacific
- China
- Japan
- India
- South Korea
- South-east Asia
- Rest of Asia Pacific
- Latin America
- Brazil
- Argentina
- Rest of Latin America
- Middle East & Africa
- GCC Countries
- South Africa
- Rest of the Middle East and Africa
Competitive Landscape
The competitive landscape of the canned tuna market features strong participation from leading processors, global seafood brands, and sustainability-driven niche companies. Major players focus on product quality, traceable sourcing, and efficient global supply chains to strengthen their market positions. Companies introduce new flavor profiles, ready-to-eat bowls, and clean-label formulations to differentiate in crowded retail shelves. Sustainability commitments, such as FAD-free fishing, MSC certification, and vessel-level traceability, influence brand strategies as consumers demand responsible seafood. Producers also invest in automation to improve yield, reduce waste, and stabilize pricing despite fluctuating raw tuna costs. Partnerships with supermarket chains, discount retailers, and e-commerce platforms expand distribution reach across both mature and emerging markets. Many brands emphasize mercury testing, nutritional claims, and premium oil-packed lines to capture health-focused and gourmet buyers. Competitive intensity continues to rise as companies balance compliance, product innovation, and global sourcing challenges.
Key Player Analysis
- Bumble Bee Foods LLC (U.S.)
- Golden Prize Canning Co. Ltd. (Thailand)
- Wild Planet Foods Inc. (U.S.)
- StarKist Co. (U.S.)
- Century Pacific Food Inc. (Philippines)
- Grupo Albacora SA (Spain)
- American Tuna Inc. (U.S.)
- Thai Union Group PLC (Thailand)
- Crown Prince Inc. (U.S.)
- E.C. Canning Company Limited (Thailand)
Recent Developments
- In August 2024, Wild Planet Foods Inc. (U.S.) introduced a Limited Edition Wild Tuna Snack Pack in collaboration with Simple Mills and Chosen Foods, featuring pole-and-line caught skipjack wild tuna with dill pickle in a convenient snack format sold via its online channel.
- In February 2024, Golden Prize Canning Co. Ltd. (Thailand) received a Marin Trust certificate for responsible supply of marine ingredients, covering skipjack tuna by-product from FAO areas 51 and 57, strengthening its sustainability and traceability credentials for tuna processing.
Report Coverage
The research report offers an in-depth analysis based on Type, Distribution, Preservation Method and Geography. It details leading market players, providing an overview of their business, product offerings, investments, revenue streams, and key applications. Additionally, the report includes insights into the competitive environment, SWOT analysis, current market trends, as well as the primary drivers and constraints. Furthermore, it discusses various factors that have driven market expansion in recent years. The report also explores market dynamics, regulatory scenarios, and technological advancements that are shaping the industry. It assesses the impact of external factors and global economic changes on market growth. Lastly, it provides strategic recommendations for new entrants and established companies to navigate the complexities of the market.
Future Outlook
- Demand for protein-rich and ready-to-eat seafood will keep the market on a steady growth path.
- Sustainability-certified tuna will gain stronger adoption as buyers prioritize traceable and responsible sourcing.
- Flavored, gourmet, and functional tuna lines will expand to attract premium and younger consumers.
- Automation in processing plants will improve yield, reduce waste, and support stable supply.
- E-commerce and subscription models will grow as households shift to convenient pantry stocking.
- Ready-to-eat bowls, salad kits, and snack pouches will strengthen the meal-solution category.
- Retailers will expand private-label tuna ranges to offer value-focused alternatives.
- Foodservice and institutional demand will rise as menus feature more tuna-based high-protein meals.
- Companies will invest more in recyclable packaging to align with global sustainability targets.
- Supply chains will become more data-driven, improving traceability, forecasting, and sourcing efficiency.
Request a Free Sample
Fill in your details and we'll send you a free sample report.
- Sample data tables & charts
- Research methodology
Need a Custom Version of This Report?
Tailor the scope, geography, or segments to your exact requirements.
- Custom geography or segment scope
- Direct access to our analyst team
Frequently Asked Questions
What is the current market size for Canned Tuna market, and what is its projected size in 2032?
At what Compound Annual Growth Rate is Canned Tuna market projected to grow between 2025 and 2032?
Which Canned Tuna market segment held the largest share in 2024?
What are the primary factors fueling the growth of Canned Tuna market?
Who are the leading companies in Canned Tuna market?
Which region commanded the largest share of Canned Tuna market?
Table of Content
Chapter 1. Report Introduction
- 1.1 Report Description & Purpose
- 1.1.1 Report Title & Market Definition
- 1.1.2 Unique Selling Propositions (USP) & Key Differentiators
- 1.1.3 Value Proposition for Stakeholders
- 1.2 Research Objectives
- 1.2.1 Market Sizing Objectives (Volume & Revenue)
- 1.2.2 Segmentation Objectives
- 1.2.3 Competitive Intelligence Objectives
- 1.2.4 Forecast & Scenario Objectives
- 1.3 Report Scope
- 1.3.1 Canned Tuna Scope – Types & Subtypes Covered
- 1.3.2 Geographic Scope – Regions & Countries Covered
- 1.3.3 Historical Period, Base Year & Forecast Period (2024; forecast to 2032)
- 1.3.4 Inclusions & Exclusions
- 1.4 HS Code & Classification Framework
- 1.5 Currency, Units & Pricing Basis
- 1.6 Target Stakeholders
- 1.7 Limitations & Assumptions
Chapter 2. Executive Summary
- 2.1 Global Canned Tuna Market Snapshot
- 2.1.1 Market Size – Historical (2024) & Forecast (2024-2032) (2024: USD 20.4 billion → 2032: USD 28.57 billion)
- 2.1.2 Volume & Revenue – Global Totals
- 2.1.3 Key Market Highlights – Top Five Facts
- 2.2 Canned Tuna Market Segmentation Snapshot
- 2.2.1 Market Split by Region – 2024 vs. 2032
- 2.3 Competitive Snapshot
- 2.3.1 Top 10 Players by Revenue Share – 2024
- 2.3.2 Top 10 Players by Volume Share – 2024
- 2.3.3 Recent Strategic Developments (18-Month Summary)
- 2.4 Key Investment Highlights & Strategic Conclusions
Chapter 3. Canned Tuna Market Dynamics & Industry Analysis
- 3.1 Market Overview & Context
- 3.1.1 Canned Tuna Market Position in the Broader Automotive Value Chain
- 3.1.2 OEM vs. Replacement Market Dynamics
- 3.1.3 Market Maturity & Development Stage by Region
- 3.2 Canned Tuna Market Drivers
- 3.3 Canned Tuna Market Restraints & Challenges
- 3.4 Canned Tuna Market Opportunities
- 3.5 Porter's Five Forces Analysis
- 3.5.1 Threat of New Entrants
- 3.5.2 Bargaining Power of Suppliers
- 3.5.3 Bargaining Power of Buyers
- 3.5.4 Threat of Substitutes
- 3.5.5 Competitive Rivalry – Intensity Assessment
- 3.6 Canned Tuna Value Chain Analysis
- 3.6.1 Upstream – Raw Material/Input Suppliers
- 3.6.1.1 Raw Material/Input 1
- 3.6.1.2 Raw Material/Input 2
- 3.6.1.3 Raw Material/Input 3
- 3.6.2 Midstream – Production/Manufacturing/Service Delivery
- 3.6.2.1 Production/Process Overview
- 3.6.2.2 Key Facility Locations & Capacity by Manufacturer
- 3.6.3 Downstream – Distribution & End Consumer
- 3.6.3.1 Primary Channel – B2B/OEM
- 3.6.3.2 Secondary Channels – Dealer, Retail, Online, Direct
- 3.6.4 Value Chain Profitability Analysis
- 3.6.1 Upstream – Raw Material/Input Suppliers
- 3.7 PESTEL Analysis
- 3.7.1 Political Factors
- 3.7.2 Economic Factors
- 3.7.3 Social Factors
- 3.7.4 Technological Factors
- 3.7.5 Environmental Factors
- 3.7.6 Legal Factors
- 3.8 Canned Tuna Supply Chain Analysis
- 3.8.1 Raw Material/Input Supply Risk Assessment
- 3.8.2 Manufacturing Concentration Risk (Geographic Exposure)
- 3.8.3 Trade Disruption Impact Analysis
- 3.9 Regulatory & Policy Landscape
Note: The regulatory and policy landscape section covers regulations based on their applicability to the market, Canned Tuna category, geography, and scope of the study. Only regulatory frameworks with a material impact on operations, compliance, trade, sustainability, or market access are analyzed in detail.
Chapter 4. Key Investment Pockets & Opportunity Analysis
- 4.1 Canned Tuna Market Attractiveness Analysis
- 4.1.1 By Region – Investment Attractiveness Matrix (Volume × CAGR)
- 4.2 Absolute Revenue Growth Opportunity
- 4.2.1 By Region – Absolute USD Growth Through 2032
- 4.3 Incremental Volume Opportunity
- 4.3.1 By Region – Incremental Volume Through 2032
- 4.3.2 Segment – Incremental Volume
- 4.4 Emerging Submarket Opportunity Deep Dive (Subject to Applicability)
- 4.5 Emerging Market Opportunity Scorecards
- 4.5.1 United States
- 4.5.2 Europe
- 4.5.3 Asia
- 4.5.4 Middle East & Africa
Note: Emerging Market Opportunity Scorecards will be included based on relevance and strategic importance. Regions listed are indicative and may vary depending on data availability and market dynamics.
Chapter 5. Canned Tuna Import-Export Analysis & Trade Flows
- 5.1 Global Trade Overview
- 5.1.1 Global Export Value by Country (2024)
- 5.1.2 Global Export Volume by Country (2024)
- 5.1.3 Global Import Value by Country (2024)
- 5.1.4 Global Import Volume by Country (2024)
- 5.1.5 Net Trade Balance by Country (2024)
- 5.2 Export Analysis – Segment
- 5.2.1 Type 1 (HS Code)
- 5.2.2 Type 2 (HS Code)
- 5.2.3 Type 3 (HS Code)
- 5.2.4 Type 4 (HS Code)
- 5.2.5 Type 5 (HS Code)
- 5.3 Import Analysis – Segment
- 5.3.1 Type 1 (HS Code)
- 5.3.2 Type 2 (HS Code)
- 5.3.3 Type 3 (HS Code)
- 5.3.4 Type 4 (HS Code)
- 5.3.5 Type 5 (HS Code)
- 5.4 Average Unit Trade Prices
- 5.4.1 Average Export Price – Segment & Country
- 5.4.2 Average Import Price – Segment & Source Country
- 5.4.3 Price Trends (2024)
- 5.5 Key Trade Route Analysis
- 5.5.1 Trade Route 1
- 5.5.2 Trade Route 2
- 5.5.3 Trade Route 3
- 5.5.4 Trade Route 4
- 5.5.5 Trade Route 5
- 5.6 Trade Policy Impact Assessment
- 5.6.1 US Anti-Dumping & Section 301 Tariffs
- 5.6.2 EU Customs Union Impact
- 5.6.3 Major Free Trade Agreements
- 5.6.4 USMCA Rules of Origin
Note: Trade policy analysis will be included only where relevant to the Canned Tuna market.
Chapter 6. Competitive Landscape & Company Benchmarking
- 6.1 Canned Tuna Market Concentration & Structure
- 6.1.1 Herfindahl-Hirschman Index (HHI) – vs. 2024
- 6.1.2 Tier 1, Tier 2 & Tier 3 Market Structure
- 6.1.3 Global, Regional & Local Player Dynamics
- 6.2 Canned Tuna Market Share Analysis – 2024
- 6.2.1 Global Revenue Share by Company
- 6.2.2 Global Volume Share by Company
- 6.2.3 Regional Revenue Share
- 6.2.4 Market Share Evolution ( vs. 2024)
- 6.2.5 OEM Segment Share by Company
- 6.2.6 Replacement Segment Share by Company
- 6.3 Production/Delivery Capacity & Facility Analysis
- 6.3.1 Global Installed Capacity
- 6.3.2 Capacity Utilization Rates
- 6.3.3 Production/Output Volume
- 6.3.4 Facility Locations & Capacity Map
- 6.3.5 Planned Capacity Additions
- 6.4 Canned Tuna Competitive Benchmarking Matrix
- 6.4.1 Revenue, Volume, CAGR & Profitability Comparison
- 6.4.2 Channel Revenue Mix
- 6.4.3 Geographic Revenue Exposure
- 6.4.4 R&D Intensity
- 6.4.5 Sustainability Maturity
- 6.5 Strategic Developments in Canned Tuna (Last 24 Months)
- 6.5.1 Mergers, Acquisitions & Divestments
- 6.5.2 New Canned Tuna Launches
- 6.5.3 Facility Expansions
- 6.5.4 Strategic Alliances, Joint Ventures & Partnerships
- 6.5.5 Distribution Expansion & Market Entry
- 6.5.6 Sustainability & ESG Initiatives
- 6.6 Competitive Strategy Mapping
- 6.6.1 Leader, Challenger, Follower & Niche Classification
- 6.6.2 Pricing Strategy Comparison
- 6.6.3 Channel Strategy Matrix
Note: Strategic developments are included based on their materiality and the availability of reliable information.
Chapter 7. Global Canned Tuna Market – By Distribution Channel
- 7.1 Segment Overview
- 7.1.1 Volume & Revenue Split by Channel (2024 & 2032)
- 7.1.2 Channel Mix Evolution (2024-2032)
Chapter 8. Regional Market Analysis – Global Overview
- 8.1 Global Regional Overview
- 8.1.1 Regional Volume Share
- 8.1.2 Regional Revenue Share
- 8.1.3 Regional Volume by Region
- 8.1.4 Regional Revenue by Region
- 8.1.5 Regional Forecast Through 2032
- 8.2 Cross-Regional Segment Analysis
- 8.2.1 By Distribution Channel
- 8.2.2 By Brand/Price Tier
Chapter 9. North America Canned Tuna Market
- 9.1 United States
- 9.2 Canada
- 9.3 Mexico
Chapter 10. Europe Canned Tuna Market
- 10.1 Germany
- 10.2 France
- 10.3 Italy
- 10.4 United Kingdom
- 10.5 Spain
- 10.6 Poland
- 10.7 Russia
- 10.8 Netherlands
- 10.9 Belgium
- 10.10 Sweden
- 10.11 Denmark
- 10.12 Norway
- 10.13 Rest of Europe
Chapter 11. Asia Pacific Canned Tuna Market
- 11.1 China
- 11.2 India
- 11.3 Japan
- 11.4 South Korea
- 11.5 Thailand
- 11.6 Indonesia
- 11.7 Vietnam
- 11.8 Malaysia
- 11.9 Australia
- 11.10 Rest of Asia Pacific
Chapter 12. Latin America Canned Tuna Market
- 12.1 Brazil
- 12.2 Argentina
- 12.3 Colombia
- 12.4 Chile
- 12.5 Rest of Latin America
Chapter 13. Middle East Canned Tuna Market
- 13.1 Saudi Arabia
- 13.2 United Arab Emirates
- 13.3 Turkey
- 13.4 Israel
- 13.5 Iran
- 13.6 Rest of the Middle East
Chapter 14. Africa Canned Tuna Market
- 14.1 South Africa
- 14.2 Egypt
- 14.3 Nigeria
- 14.4 Morocco
- 14.5 Rest of Africa
Chapter 15. Canned Tuna Company Profiles
- 15.1 [Company 01]
- 15.1.1 Company Overview
- 15.1.2 Key Management Personnel
- 15.1.3 Products & Services Portfolio
- 15.1.4 Financial Performance
- 15.1.5 Key Market Focus & Geographic Presence
- 15.1.6 Recent Developments & Strategic Initiatives
Note: The company profile list is preliminary and may change based on research findings, market developments, data availability, and client requirements.
Chapter 16. Appendices
- Appendix A – List of Abbreviations & Acronyms
- Appendix B – Industry Classification Code Reference – Full Series
- Appendix C – Production & Capacity Data Tables
- Appendix D – End-Use & Demand Base Tables
- Appendix E – Consumption & Replacement Rate Assumptions
- Appendix F – ASP Reference Tables
- Appendix G – Manufacturing & Facility Database
- Appendix H – Import-Export Data Tables
- Appendix I – Regulatory Summary Tables
- Appendix J – Primary Research Participant List (Anonymized)
- Appendix K – Primary Research Questionnaire Framework
- Appendix L – Data Sources & Bibliography
- Appendix M – Market Size Divergence & Source Comparison
Chapter 17. Research Methodology
- 17.1 Research Framework & Philosophy
- 17.2 Secondary Research – Sources, Hierarchy & Data Extraction
- 17.3 Data Modeling – Bottom-Up & Top-Down Market Sizing
- 17.4 Primary Research – Stakeholder Framework, LOI & Sample Sizes
- 17.5 Forecast Methodology – Regression, Scenario & Sensitivity Analysis
- 17.6 Quality Control – Four-Layer Validation Framework
- 17.7 Limitations & Standard Assumptions
- 17.8 Disclaimer
