
Market Overview
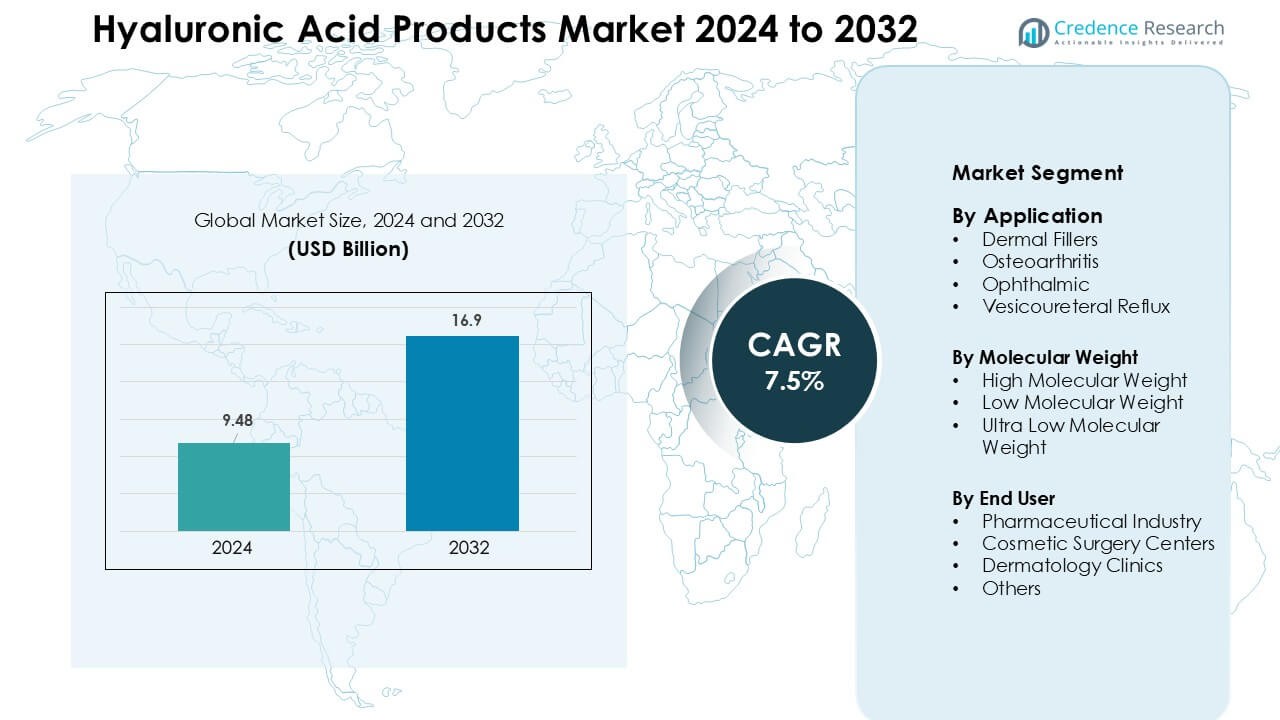
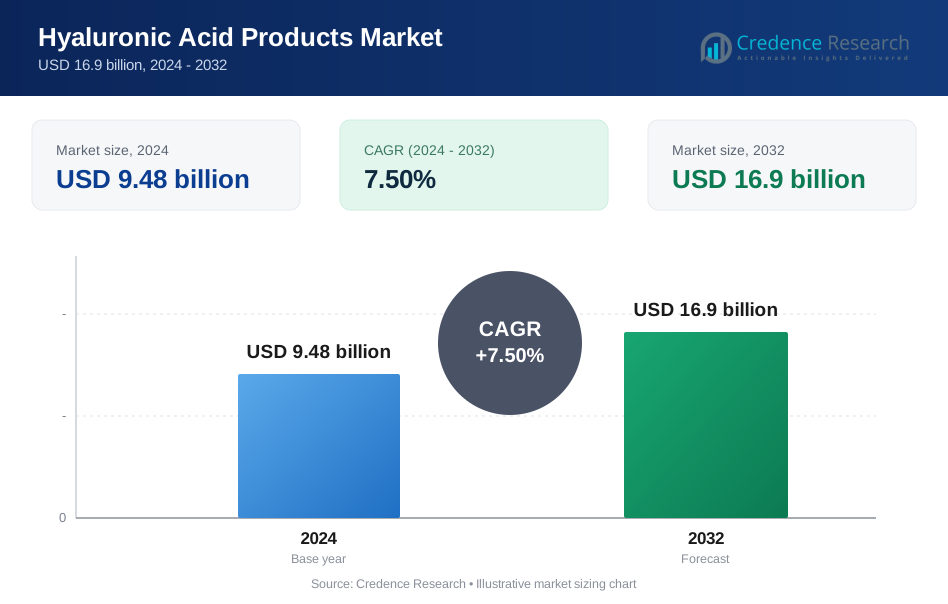
Hyaluronic Acid Products Market was valued at USD 9.48 billion in 2024 and is anticipated to reach USD 16.9 billion by 2032, growing at a CAGR of 7.5 % during the forecast period.
| REPORT ATTRIBUTE | DETAILS |
|---|---|
| Historical Period | 2020-2023 |
| Base Year | 2024 |
| Forecast Period | 2025-2032 |
| Hyaluronic Acid Products Market Size 2024 | USD 9.48 Billion |
| Hyaluronic Acid Products Market, CAGR | 7.5 % |
| Hyaluronic Acid Products Market Size 2032 | USD 16.9 Billion |
The Hyaluronic Acid Products Market is shaped by major companies such as Galderma Laboratories L.P., Zimmer Biomet, Ferring B.V., Genzyme Corporation, Lifecore Biomedical LLC, Sanofi, Smith & Nephew plc, Allergan, Salix Pharmaceuticals, and F. Hoffmann-La Roche AG. These players strengthen the market through advanced dermal fillers, viscosupplementation therapies, ophthalmic viscoelastics, and expanding R&D pipelines. Their strong clinical networks and global distribution support sustained adoption across medical and aesthetic applications. North America remained the leading region in 2024 with 38% share, driven by high procedure volumes, strong consumer spending on aesthetics, and widespread orthopedic and ophthalmic usage.
Market Insights
- The Hyaluronic Acid Products Market reached USD 9.48 billion in 2024 and is projected to hit USD 16.9 billion by 2032, growing at a 7.5 % CAGR.
- Strong demand for dermal fillers drives market growth, with the Dermal Fillers segment holding about 48% share due to rising aesthetic procedures and wider acceptance of minimally invasive treatments.
- Key trends include adoption of crosslinked, long-lasting HA formulations and growing opportunities in topical skincare, regenerative medicine, and advanced drug-delivery systems.
- Competitive activity intensifies as leading players expand portfolios and enhance clinical partnerships, with companies focusing on product longevity, safety, and global distribution reach.
- North America led the market with 38% share, followed by Europe at 32% and Asia Pacific at 24%, driven by high procedure volumes, strong healthcare access, and rising aesthetic and orthopedic adoption across these regions.
Market Segmentation Analysis:
By Application
Dermal fillers dominated the application segment in 2024 with about 48% share, driven by growing demand for minimally invasive aesthetic treatments and wider acceptance of facial enhancement procedures. Rising adoption among younger consumers, strong influence of social media, and broader availability of premium injectable formulations supported the leadership of dermal fillers. Osteoarthritis applications also expanded as aging populations sought long-acting viscosupplementation options, while ophthalmic uses maintained steady demand due to high surgical volumes. Vesicoureteral reflux treatments remained smaller but benefited from improved pediatric clinical outcomes.
- For instance, in the United States alone, over 5.3 million hyaluronic‑acidbased filler procedures were reported in 2023 including more than 1.58 million lip enhancement treatments underscoring the scale at which leading products (e.g. Juvéderm, Restylane) are being used.
By Molecular Weight
High molecular weight HA held the largest share in 2024 with nearly 52%, supported by strong use in ophthalmic surgery, viscosupplementation, and premium dermal filler formulations. Its higher viscosity, longer retention time, and better mechanical stability made it the preferred choice among medical professionals. Low molecular weight HA grew due to its deeper skin penetration, wider role in topical skincare, and expanding use in regenerative therapies. Ultra-low molecular weight HA gained traction in advanced wound care and targeted drug delivery, though the category remained a smaller contributor compared to high molecular weight products.
- For instance, HMW HA with molecular weights around 1-3 MDa have been shown to form a more viscous gel that remains longer in the joint animal and human-synovial-fluid studies demonstrated that HMW HA sustains joint lubrication and viscoelastic stability compared to lower-MW HA.
By End User
Pharmaceutical companies led the end-user segment in 2024 with approximately 44% share, driven by strong production of injectable HA products for osteoarthritis, ophthalmology, and aesthetic treatments. Their dominance stemmed from large-scale R&D investments, expanded regulatory approvals, and wider commercialization channels. Cosmetic surgery centers grew with rising demand for facial contouring and anti-aging procedures, especially in urban markets. Dermatology clinics retained consistent adoption due to routine filler procedures and skincare treatments. Other end users, including research institutes and wellness centers, contributed smaller shares but supported niche applications and product innovation.
Key Growth Drivers
Rising Demand for Minimally Invasive Aesthetic Procedures
The demand for minimally invasive aesthetic treatments continues to rise as consumers seek faster procedures with shorter recovery times and natural-looking results. Hyaluronic acid products play a central role in facial fillers, volume restoration, lip augmentation, and wrinkle reduction, which strengthens their adoption in cosmetic clinics and surgery centers. Media influence, younger consumer interest, and broader availability of premium filler brands increase procedure volumes each year. Advancements in HA crosslinking and consistency improve product longevity and safety, driving repeat usage. The shift toward preventive aesthetics also expands treatment frequency. Urbanization, rising disposable income, and global acceptance of medical aesthetics support wider uptake across Europe, North America, and Asia. Together, these trends create a strong growth pathway for HA-based dermal fillers.
- For instance, the aesthetic injectables segment encompassing HA fillers remains one of the fastest-growing globally, with rising adoption in Asia-Pacific as urban clinics expand and more consumers seek “quick refresh” procedures.
Expanding Use of HA in Osteoarthritis and Orthopedic Treatments
The growing prevalence of osteoarthritis, driven by aging populations and lifestyle factors, boosts the demand for HA-based viscosupplementation therapies. These products help reduce joint pain, improve mobility, and delay surgical intervention, making them a preferred option among patients seeking non-surgical relief. Physicians increasingly recommend HA injections because they deliver longer-lasting lubrication and cushioning in knee and hip joints. Clinical evidence supporting improved patient outcomes strengthens confidence in these formulations. New multi-injection and single-injection regimens enhance adherence and expand accessibility across orthopedic centers. Rising healthcare expenditure and the global shift toward non-opioid pain management further boost adoption. This expansion enhances the role of HA across broader therapeutic applications.
- For instance, according to a 2024 meta-analysis, patients receiving intra-articular HA experienced statistically greater reductions in pain (per VAS scores) compared to placebo, with benefits lasting through 6 months post-injection.
Growing Adoption of HA in Ophthalmic and Advanced Medical Applications
Hyaluronic acid products continue to gain traction in ophthalmic surgeries, including cataract, corneal, and vitreoretinal procedures, due to their superior viscoelastic properties. Surgeons rely on HA-based viscoelastics to protect ocular tissues and maintain space during operations. Growth in surgical procedures, technological improvements in viscoelastic formulations, and expanding access to eye care in developing regions strengthen market demand. Beyond ophthalmology, HA is increasingly used in wound care, drug delivery, tissue engineering, and regenerative medicine due to biocompatibility and moisture-retention capabilities. These emerging medical applications attract strong R&D investments and new product approvals, broadening the clinical footprint of HA products across global healthcare systems.
Key Trends & Opportunities
Shift Toward Crosslinked and Long-Lasting HA Formulations
A major trend shaping the market is the shift toward advanced crosslinked HA formulations that provide longer durability, improved lifting capacity, and greater stability. These innovations help reduce the frequency of repeat injections and enhance patient satisfaction in aesthetic procedures. Manufacturers invest in technologies that optimize particle size, cohesiveness, and rheology to achieve natural outcomes and precise application. The opportunity here lies in premiumization, as clinics increasingly prefer high-performance fillers with tailored characteristics for lips, cheeks, jawlines, and fine-line correction. Growth in digital consultations and influencer-driven beauty trends further expands demand for differentiated HA filler portfolios across markets.
- For instance, studies comparing injectable dermal fillers showed that viscoelastic and rheological properties such as gel elasticity, cohesivity, and viscosity vary widely across crosslinked HA (XL-HA) fillers, with some products exhibiting up to nearly a 20-fold difference in complex viscosity (|η*|) and a 10-fold difference in rigidity modulus (|G*|) between lower- and higher-performance gels.
Expansion of Non-Invasive Skincare and Topical HA Applications
The global shift toward non-invasive skincare fuels strong interest in topical HA products such as serums, creams, and masks. Consumers look for hydration-focused formulations that enhance skin plumpness, elasticity, and barrier strength. Low and ultra-low molecular weight HA offer deep absorption benefits, creating opportunities for advanced multi-layer hydration systems. Skincare brands use HA as a hero ingredient due to strong consumer trust and proven cosmetic efficacy. Growing e-commerce penetration, rising male grooming trends, and the surge in dermatology-led skincare lines widen the market base. This trend allows companies to diversify product offerings beyond injectables and enter high-growth beauty retail channels.
- For instance, a controlled study showed that using a topical HA serum increased skin hydration (measured by corneometry) by about 55% over 6 weeks, demonstrating a marked boost in skin moisture and plumpness.
Opportunities in Regenerative Medicine and Novel Drug Delivery Systems
Hyaluronic acid’s biocompatibility and biodegradability create strong opportunities in regenerative medicine, where it supports tissue repair, cell migration, and healing processes. Researchers increasingly explore HA-based scaffolds, hydrogels, and nanoparticles for controlled drug delivery, cancer therapy, and chronic wound management. These innovations attract collaboration between biotech firms and medical research institutions. Regulatory support for advanced biologics and rising investment in personalized medicine further boost the development pipeline. This trend positions HA as a foundational biomaterial in next-generation medical solutions, expanding its role far beyond traditional aesthetic and orthopedic uses.
Key Challenges
Concerns Related to Product Safety, Quality, and Counterfeit HA Fillers
Ensuring product safety and maintaining strict quality standards remain major challenges, especially in regions where counterfeit or unregulated HA fillers circulate. Substandard formulations can lead to complications such as swelling, vascular occlusion, or infection. These risks increase consumer hesitation and place pressure on clinics to procure verified products. Regulatory agencies enforce strict guidelines, but uneven enforcement across markets allows gray-market products to persist. Manufacturers must invest in authentication, traceability, and clinician training to maintain trust. Rising awareness of safety concerns also pushes customers to seek certified providers, but it limits rapid market penetration in emerging economies.
High Treatment Costs and Limited Reimbursement in Medical Applications
Hyaluronic acid injections for aesthetic use and viscosupplementation often involve high out-of-pocket costs for patients due to limited insurance coverage. This creates affordability barriers, especially in price-sensitive regions. While demand remains strong in premium urban markets, many patients delay or avoid treatment due to cost. In osteoarthritis care, reimbursement varies widely across countries, creating inconsistent access to HA injections. Hospitals and clinics also face procurement challenges as prices fluctuate based on molecular weight, formulation type, and brand. These cost-related hurdles slow adoption in both aesthetic and medical segments, despite proven clinical benefits.
Regional Analysis
North America
North America led the Hyaluronic Acid Products Market in 2024 with about 38% share, driven by high demand for dermal fillers, viscosupplementation therapies, and ophthalmic viscoelastics. Strong presence of established aesthetic brands, advanced dermatology clinics, and high surgical volumes support regional dominance. The U.S. benefits from strong consumer spending on cosmetic treatments and robust orthopedic adoption for osteoarthritis management. Growing preference for long-lasting fillers and premium HA formulations strengthens market value. Rising focus on non-opioid pain relief and steady R&D investments also widen the therapeutic footprint of HA across medical and aesthetic applications.
Europe
Europe accounted for nearly 32% share in 2024, supported by strong aesthetic procedure adoption across Germany, France, Italy, and the U.K. High demand for HA-based dermal fillers, coupled with widespread use of viscosupplementation in osteoarthritis care, drives regional growth. Cosmetic treatment acceptance is high due to cultural preference for subtle enhancements and strong regulatory oversight ensuring product quality. Ophthalmic surgeries involving HA viscoelastics also contribute significantly. Expanding aging populations and growing investment in regenerative medicine strengthen HA product usage. Increasing clinical trials and new CE-approved formulations keep Europe a leading innovation hub.
Asia Pacific
Asia Pacific captured around 24% share in 2024 and remains the fastest-growing region due to rising cosmetic procedure volumes in China, South Korea, Japan, and India. The region benefits from a large millennial and Gen-Z customer base seeking non-surgical facial enhancement and hydration-based skincare. Strong medical tourism in South Korea and Thailand boosts HA filler procedures. Expanding orthopedic care access and ophthalmic surgery growth further enhance demand. Local production of HA raw materials and competitively priced fillers increases market penetration. Rapid urbanization and growing disposable income continue to strengthen long-term adoption across both aesthetic and medical segments.
Latin America
Latin America held about 4% share in 2024, supported by growing demand for aesthetic injectables in Brazil, Mexico, and Argentina. Strong beauty-driven culture and expanding private dermatology clinics encourage HA filler usage. Rising interest in non-invasive cosmetic procedures and increasing social media influence promote steady growth. Access to viscosupplementation for osteoarthritis is improving, though coverage varies by country. Ophthalmic HA applications also gain traction with expanding surgical capacities. Despite economic fluctuations, competitive pricing and growing medical tourism help the region maintain stable adoption. Continued urbanization and wider availability of certified injectors support market expansion.
Middle East & Africa
The Middle East & Africa region accounted for roughly 2% share in 2024, with growth led by the UAE, Saudi Arabia, and South Africa. Rising cosmetic treatment demand, increasing clinic investments, and expanding premium skincare adoption support regional progress. Medical tourism hubs such as Dubai enhance HA filler usage due to advanced aesthetic facilities. Orthopedic and ophthalmic applications grow gradually with improving healthcare infrastructure. However, limited reimbursement and uneven access slow broader adoption. Despite challenges, rising disposable income and stronger aesthetic awareness continue to push HA product penetration across key urban centers.
Market Segmentations:
By Application
- Dermal Fillers
- Osteoarthritis
- Ophthalmic
- Vesicoureteral Reflux
By Molecular Weight
- High Molecular Weight
- Low Molecular Weight
- Ultra Low Molecular Weight
By End User
- Pharmaceutical Industry
- Cosmetic Surgery Centers
- Dermatology Clinics
- Others
By Geography
- North America
- U.S.
- Canada
- Mexico
- Europe
- Germany
- France
- U.K.
- Italy
- Spain
- Rest of Europe
- Asia Pacific
- China
- Japan
- India
- South Korea
- South-east Asia
- Rest of Asia Pacific
- Latin America
- Brazil
- Argentina
- Rest of Latin America
- Middle East & Africa
- GCC Countries
- South Africa
- Rest of the Middle East and Africa
Competitive Landscape
The Hyaluronic Acid Products Market features strong competition from established medical and aesthetic manufacturers that offer diversified HA-based portfolios across dermal fillers, viscosupplements, viscoelastics, and topical formulations. Leading companies such as Galderma Laboratories L.P., Zimmer Biomet, Ferring B.V., Genzyme Corporation, Lifecore Biomedical LLC, Sanofi, Smith & Nephew plc, Allergan, Salix Pharmaceuticals, and F. Hoffmann-La Roche AG drive market strength through broad clinical usage and global distribution networks. These firms invest heavily in product innovation, focusing on crosslinked fillers, long-lasting formulations, improved viscoelastic properties, and safer injection technologies. Strategic moves include partnerships with dermatology clinics, regulatory approvals for new indications, and expansion into regenerative medicine and drug delivery systems. Competition remains intense as companies enhance manufacturing capabilities, pursue biologic-based formulations, and target fast-growing regions in Asia and Latin America. This competitive environment drives continuous improvement in product quality and treatment outcomes across aesthetic and medical applications.
Key Player Analysis
- Galderma Laboratories L.P.
- Zimmer Biomet
- Ferring B.V.
- Genzyme Corporation
- Lifecore Biomedical, LLC
- Sanofi
- Smith & Nephew plc
- Allergan
- Salix Pharmaceuticals
- F. Hoffmann-La Roche AG
Recent Developments
- In September 2025, Allergan Aesthetics (AbbVie) launched the Naturally You with Injectable Hyaluronic Acid Fillers campaign to educate consumers, counter misinformation, and promote safe, natural-looking outcomes from its HA filler portfolio.
- In January 2025, Galderma Laboratories L.P. Presented new clinical data on recently launched Restylane SHAYPE™ and Relfydess® at IMCAS 2025, reinforcing category leadership in HA injectables.
Report Coverage
The research report offers an in-depth analysis based on Application, Molecular Weight, End-User and Geography. It details leading market players, providing an overview of their business, product offerings, investments, revenue streams, and key applications. Additionally, the report includes insights into the competitive environment, SWOT analysis, current market trends, as well as the primary drivers and constraints. Furthermore, it discusses various factors that have driven market expansion in recent years. The report also explores market dynamics, regulatory scenarios, and technological advancements that are shaping the industry. It assesses the impact of external factors and global economic changes on market growth. Lastly, it provides strategic recommendations for new entrants and established companies to navigate the complexities of the market.
Future Outlook
- Demand for minimally invasive aesthetic procedures will continue to rise worldwide.
- Adoption of advanced crosslinked HA fillers will expand due to longer-lasting results.
- Osteoarthritis viscosupplementation use will grow as aging populations increase.
- Ophthalmic surgeries will drive strong demand for high-viscosity HA viscoelastics.
- Topical HA skincare products will see higher adoption through e-commerce growth.
- Regenerative medicine applications will accelerate with new HA-based biomaterials.
- Emerging markets will gain stronger access to premium HA fillers and injectables.
- Clinical innovation will advance with next-generation HA formulations for targeted delivery.
- Regulatory approvals will increase for broader therapeutic indications in orthopedics and ophthalmology.
- Competition will intensify as global manufacturers expand portfolios and strengthen distribution networks.
Request a Free Sample
Fill in your details and we'll send you a free sample report.
- Sample data tables & charts
- Research methodology
Need a Custom Version of This Report?
Tailor the scope, geography, or segments to your exact requirements.
- Custom geography or segment scope
- Direct access to our analyst team
Frequently Asked Questions
What is the current market size for Hyaluronic Acid Products Market, and what is its projected size in 2032?
At what Compound Annual Growth Rate is Hyaluronic Acid Products Market projected to grow between 2024 and 2032?
Which Hyaluronic Acid Products Market segment held the largest share in 2024?
What are the primary factors fueling the growth of Hyaluronic Acid Products Market?
Who are the leading companies in Hyaluronic Acid Products Market?
Which region commanded the largest share of Hyaluronic Acid Products Market?
Table of Content
Chapter 1. Report Introduction
- 1.1 Report Description & Purpose
- 1.1.1 Report Title & Market Definition
- 1.1.2 Unique Selling Propositions (USP) & Key Differentiators
- 1.1.3 Value Proposition for Stakeholders
- 1.2 Research Objectives
- 1.2.1 Market Sizing Objectives (Volume & Revenue)
- 1.2.2 Segmentation Objectives
- 1.2.3 Competitive Intelligence Objectives
- 1.2.4 Forecast & Scenario Objectives
- 1.3 Report Scope
- 1.3.1 Hyaluronic Acid Products Scope – Types & Subtypes Covered
- 1.3.2 Geographic Scope – Regions & Countries Covered
- 1.3.3 Historical Period, Base Year & Forecast Period (2024; forecast to 2032)
- 1.3.4 Inclusions & Exclusions
- 1.4 HS Code & Classification Framework
- 1.5 Currency, Units & Pricing Basis
- 1.6 Target Stakeholders
- 1.7 Limitations & Assumptions
Chapter 2. Executive Summary
- 2.1 Global Hyaluronic Acid Products Market Snapshot
- 2.1.1 Market Size – Historical (2024) & Forecast (2024-2032) (2024: USD 9.48 billion → 2032: USD 16.9 billion)
- 2.1.2 Volume & Revenue – Global Totals
- 2.1.3 Key Market Highlights – Top Five Facts
- 2.2 Hyaluronic Acid Products Market Segmentation Snapshot
- 2.2.1 Market Split by Region – 2024 vs. 2032
- 2.3 Competitive Snapshot
- 2.3.1 Top 10 Players by Revenue Share – 2024
- 2.3.2 Top 10 Players by Volume Share – 2024
- 2.3.3 Recent Strategic Developments (18-Month Summary)
- 2.4 Key Investment Highlights & Strategic Conclusions
Chapter 3. Hyaluronic Acid Products Market Dynamics & Industry Analysis
- 3.1 Market Overview & Context
- 3.1.1 Hyaluronic Acid Products Market Position in the Broader Automotive Value Chain
- 3.1.2 OEM vs. Replacement Market Dynamics
- 3.1.3 Market Maturity & Development Stage by Region
- 3.2 Hyaluronic Acid Products Market Drivers
- 3.3 Hyaluronic Acid Products Market Restraints & Challenges
- 3.4 Hyaluronic Acid Products Market Opportunities
- 3.5 Porter's Five Forces Analysis
- 3.5.1 Threat of New Entrants
- 3.5.2 Bargaining Power of Suppliers
- 3.5.3 Bargaining Power of Buyers
- 3.5.4 Threat of Substitutes
- 3.5.5 Competitive Rivalry – Intensity Assessment
- 3.6 Hyaluronic Acid Products Value Chain Analysis
- 3.6.1 Upstream – Raw Material/Input Suppliers
- 3.6.1.1 Raw Material/Input 1
- 3.6.1.2 Raw Material/Input 2
- 3.6.1.3 Raw Material/Input 3
- 3.6.2 Midstream – Production/Manufacturing/Service Delivery
- 3.6.2.1 Production/Process Overview
- 3.6.2.2 Key Facility Locations & Capacity by Manufacturer
- 3.6.3 Downstream – Distribution & End Consumer
- 3.6.3.1 Primary Channel – B2B/OEM
- 3.6.3.2 Secondary Channels – Dealer, Retail, Online, Direct
- 3.6.4 Value Chain Profitability Analysis
- 3.6.1 Upstream – Raw Material/Input Suppliers
- 3.7 PESTEL Analysis
- 3.7.1 Political Factors
- 3.7.2 Economic Factors
- 3.7.3 Social Factors
- 3.7.4 Technological Factors
- 3.7.5 Environmental Factors
- 3.7.6 Legal Factors
- 3.8 Hyaluronic Acid Products Supply Chain Analysis
- 3.8.1 Raw Material/Input Supply Risk Assessment
- 3.8.2 Manufacturing Concentration Risk (Geographic Exposure)
- 3.8.3 Trade Disruption Impact Analysis
- 3.9 Regulatory & Policy Landscape
Note: The regulatory and policy landscape section covers regulations based on their applicability to the market, Hyaluronic Acid Products category, geography, and scope of the study. Only regulatory frameworks with a material impact on operations, compliance, trade, sustainability, or market access are analyzed in detail.
Chapter 4. Key Investment Pockets & Opportunity Analysis
- 4.1 Hyaluronic Acid Products Market Attractiveness Analysis
- 4.1.1 By Region – Investment Attractiveness Matrix (Volume × CAGR)
- 4.2 Absolute Revenue Growth Opportunity
- 4.2.1 By Region – Absolute USD Growth Through 2032
- 4.3 Incremental Volume Opportunity
- 4.3.1 By Region – Incremental Volume Through 2032
- 4.3.2 Segment – Incremental Volume
- 4.4 Emerging Submarket Opportunity Deep Dive (Subject to Applicability)
- 4.5 Emerging Market Opportunity Scorecards
- 4.5.1 United States
- 4.5.2 Europe
- 4.5.3 Asia
- 4.5.4 Middle East & Africa
Note: Emerging Market Opportunity Scorecards will be included based on relevance and strategic importance. Regions listed are indicative and may vary depending on data availability and market dynamics.
Chapter 5. Hyaluronic Acid Products Import-Export Analysis & Trade Flows
- 5.1 Global Trade Overview
- 5.1.1 Global Export Value by Country (2024)
- 5.1.2 Global Export Volume by Country (2024)
- 5.1.3 Global Import Value by Country (2024)
- 5.1.4 Global Import Volume by Country (2024)
- 5.1.5 Net Trade Balance by Country (2024)
- 5.2 Export Analysis – Segment
- 5.2.1 Type 1 (HS Code)
- 5.2.2 Type 2 (HS Code)
- 5.2.3 Type 3 (HS Code)
- 5.2.4 Type 4 (HS Code)
- 5.2.5 Type 5 (HS Code)
- 5.3 Import Analysis – Segment
- 5.3.1 Type 1 (HS Code)
- 5.3.2 Type 2 (HS Code)
- 5.3.3 Type 3 (HS Code)
- 5.3.4 Type 4 (HS Code)
- 5.3.5 Type 5 (HS Code)
- 5.4 Average Unit Trade Prices
- 5.4.1 Average Export Price – Segment & Country
- 5.4.2 Average Import Price – Segment & Source Country
- 5.4.3 Price Trends (2024)
- 5.5 Key Trade Route Analysis
- 5.5.1 Trade Route 1
- 5.5.2 Trade Route 2
- 5.5.3 Trade Route 3
- 5.5.4 Trade Route 4
- 5.5.5 Trade Route 5
- 5.6 Trade Policy Impact Assessment
- 5.6.1 US Anti-Dumping & Section 301 Tariffs
- 5.6.2 EU Customs Union Impact
- 5.6.3 Major Free Trade Agreements
- 5.6.4 USMCA Rules of Origin
Note: Trade policy analysis will be included only where relevant to the Hyaluronic Acid Products market.
Chapter 6. Competitive Landscape & Company Benchmarking
- 6.1 Hyaluronic Acid Products Market Concentration & Structure
- 6.1.1 Herfindahl-Hirschman Index (HHI) – vs. 2024
- 6.1.2 Tier 1, Tier 2 & Tier 3 Market Structure
- 6.1.3 Global, Regional & Local Player Dynamics
- 6.2 Hyaluronic Acid Products Market Share Analysis – 2024
- 6.2.1 Global Revenue Share by Company
- 6.2.2 Global Volume Share by Company
- 6.2.3 Regional Revenue Share
- 6.2.4 Market Share Evolution ( vs. 2024)
- 6.2.5 OEM Segment Share by Company
- 6.2.6 Replacement Segment Share by Company
- 6.3 Production/Delivery Capacity & Facility Analysis
- 6.3.1 Global Installed Capacity
- 6.3.2 Capacity Utilization Rates
- 6.3.3 Production/Output Volume
- 6.3.4 Facility Locations & Capacity Map
- 6.3.5 Planned Capacity Additions
- 6.4 Hyaluronic Acid Products Competitive Benchmarking Matrix
- 6.4.1 Revenue, Volume, CAGR & Profitability Comparison
- 6.4.2 Channel Revenue Mix
- 6.4.3 Geographic Revenue Exposure
- 6.4.4 R&D Intensity
- 6.4.5 Sustainability Maturity
- 6.5 Strategic Developments in Hyaluronic Acid Products (Last 24 Months)
- 6.5.1 Mergers, Acquisitions & Divestments
- 6.5.2 New Hyaluronic Acid Products Launches
- 6.5.3 Facility Expansions
- 6.5.4 Strategic Alliances, Joint Ventures & Partnerships
- 6.5.5 Distribution Expansion & Market Entry
- 6.5.6 Sustainability & ESG Initiatives
- 6.6 Competitive Strategy Mapping
- 6.6.1 Leader, Challenger, Follower & Niche Classification
- 6.6.2 Pricing Strategy Comparison
- 6.6.3 Channel Strategy Matrix
Note: Strategic developments are included based on their materiality and the availability of reliable information.
Chapter 7. Global Hyaluronic Acid Products Market – By Distribution Channel
- 7.1 Segment Overview
- 7.1.1 Volume & Revenue Split by Channel (2024 & 2032)
- 7.1.2 Channel Mix Evolution (2024-2032)
Chapter 8. Regional Market Analysis – Global Overview
- 8.1 Global Regional Overview
- 8.1.1 Regional Volume Share
- 8.1.2 Regional Revenue Share
- 8.1.3 Regional Volume by Region
- 8.1.4 Regional Revenue by Region
- 8.1.5 Regional Forecast Through 2032
- 8.2 Cross-Regional Segment Analysis
- 8.2.1 By Distribution Channel
- 8.2.2 By Brand/Price Tier
Chapter 9. North America Hyaluronic Acid Products Market
- 9.1 United States
- 9.2 Canada
- 9.3 Mexico
Chapter 10. Europe Hyaluronic Acid Products Market
- 10.1 Germany
- 10.2 France
- 10.3 Italy
- 10.4 United Kingdom
- 10.5 Spain
- 10.6 Poland
- 10.7 Russia
- 10.8 Netherlands
- 10.9 Belgium
- 10.10 Sweden
- 10.11 Denmark
- 10.12 Norway
- 10.13 Rest of Europe
Chapter 11. Asia Pacific Hyaluronic Acid Products Market
- 11.1 China
- 11.2 India
- 11.3 Japan
- 11.4 South Korea
- 11.5 Thailand
- 11.6 Indonesia
- 11.7 Vietnam
- 11.8 Malaysia
- 11.9 Australia
- 11.10 Rest of Asia Pacific
Chapter 12. Latin America Hyaluronic Acid Products Market
- 12.1 Brazil
- 12.2 Argentina
- 12.3 Colombia
- 12.4 Chile
- 12.5 Rest of Latin America
Chapter 13. Middle East Hyaluronic Acid Products Market
- 13.1 Saudi Arabia
- 13.2 United Arab Emirates
- 13.3 Turkey
- 13.4 Israel
- 13.5 Iran
- 13.6 Rest of the Middle East
Chapter 14. Africa Hyaluronic Acid Products Market
- 14.1 South Africa
- 14.2 Egypt
- 14.3 Nigeria
- 14.4 Morocco
- 14.5 Rest of Africa
Chapter 15. Hyaluronic Acid Products Company Profiles
- 15.1 [Company 01]
- 15.1.1 Company Overview
- 15.1.2 Key Management Personnel
- 15.1.3 Products & Services Portfolio
- 15.1.4 Financial Performance
- 15.1.5 Key Market Focus & Geographic Presence
- 15.1.6 Recent Developments & Strategic Initiatives
Note: The company profile list is preliminary and may change based on research findings, market developments, data availability, and client requirements.
Chapter 16. Appendices
- Appendix A – List of Abbreviations & Acronyms
- Appendix B – Industry Classification Code Reference – Full Series
- Appendix C – Production & Capacity Data Tables
- Appendix D – End-Use & Demand Base Tables
- Appendix E – Consumption & Replacement Rate Assumptions
- Appendix F – ASP Reference Tables
- Appendix G – Manufacturing & Facility Database
- Appendix H – Import-Export Data Tables
- Appendix I – Regulatory Summary Tables
- Appendix J – Primary Research Participant List (Anonymized)
- Appendix K – Primary Research Questionnaire Framework
- Appendix L – Data Sources & Bibliography
- Appendix M – Market Size Divergence & Source Comparison
Chapter 17. Research Methodology
- 17.1 Research Framework & Philosophy
- 17.2 Secondary Research – Sources, Hierarchy & Data Extraction
- 17.3 Data Modeling – Bottom-Up & Top-Down Market Sizing
- 17.4 Primary Research – Stakeholder Framework, LOI & Sample Sizes
- 17.5 Forecast Methodology – Regression, Scenario & Sensitivity Analysis
- 17.6 Quality Control – Four-Layer Validation Framework
- 17.7 Limitations & Standard Assumptions
- 17.8 Disclaimer
