1. Preface
1.1. Report Description
1.1.1. Purpose of the Report
1.1.2. Target Audience
1.1.3. USP and Key Offerings
1.2. Research Scope
1.3. Market Introduction
2. Executive Summary
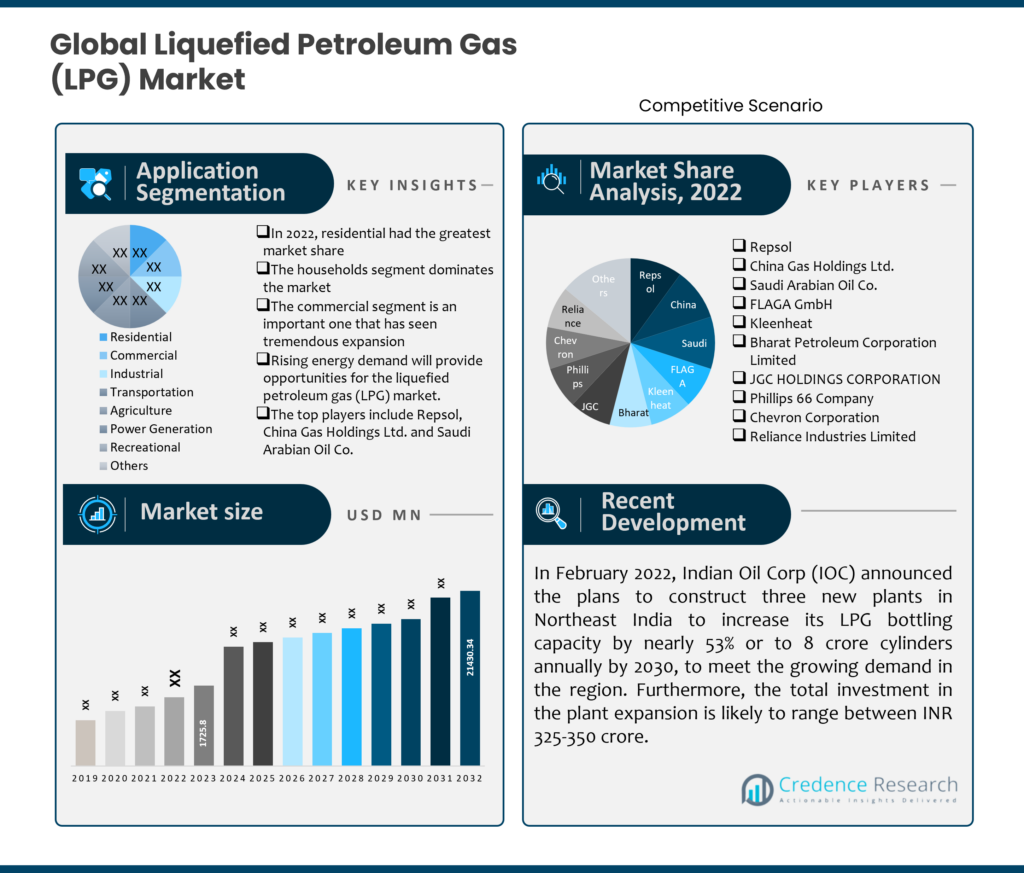
2.1. Market Snapshot: Global Liquefied Petroleum Gas (LPG) Market
2.1.1. Global Liquefied Petroleum Gas (LPG) Market, By Application Segmentation
2.1.2. Global Liquefied Petroleum Gas (LPG) Market, By End-User Segmentation
2.1.3. Global Liquefied Petroleum Gas (LPG) Market, By Region
2.2. Insights from Primary Respondents
3. Market Dynamics & Factors Analysis
3.1. Introduction
3.1.1. Global Liquefied Petroleum Gas (LPG) Market Value, 2019-2032, (US$ Mn)
3.1.2. Y-o-Y Growth Trend Analysis
3.2. Market Dynamics
3.2.1. Liquefied Petroleum Gas (LPG) Market Drivers
3.2.2. Liquefied Petroleum Gas (LPG) Market Restraints
3.2.3. Liquefied Petroleum Gas (LPG) Market Opportunities
3.2.4. Major Liquefied Petroleum Gas (LPG) Industry Challenges
3.3. Growth and Development Patterns
3.4. Investment Feasibility Analysis
3.5. Market Opportunity Analysis
3.5.1. Application Segmentation
3.5.2. End-User Segmentation
3.5.3. Geography
4. Market Competitive Landscape Analysis
4.1. Company Market Share Analysis, 2023
4.1.1. Global Liquefied Petroleum Gas (LPG) Market: Company Market Share, Value 2023
4.1.2. Global Liquefied Petroleum Gas (LPG) Market: Top 6 Company Market Share, Value 2023
4.1.3. Global Liquefied Petroleum Gas (LPG) Market: Top 3 Company Market Share, Value 2023
4.2. Global Liquefied Petroleum Gas (LPG) Market: Company Revenue Share Analysis, 2023
4.3. Company Assessment Metrics, 2023
4.3.1. Stars
4.3.2. Emerging Leaders
4.3.3. Pervasive Players
4.3.4. Participants
4.4. Startups/ SMEs Assessment Metrics, 2023
4.4.1. Progressive Companies
4.4.2. Responsive Companies
4.4.3. Dynamic Companies
4.4.4. Starting Blocks
4.5. Strategic Development
4.5.1. Acquisition and Mergers
4.5.2. New Product Launch
4.5.3. Regional Expansion
4.5.4. Partnerships
4.6. Key Player Product Matrix
4.7. Potential for New Players in the Global Liquefied Petroleum Gas (LPG) Market
5. Premium Insights
5.1. STAR (Situation, Task, Action, Results) Analysis
5.2. Porter’s Five Forces Analysis
5.2.1. Threat of New Entrants
5.2.2. Bargaining Power of Buyers/Consumers
5.2.3. Bargaining Power of Suppliers
5.2.4. Threat of Substitute Types
5.2.5. Intensity of Competitive Rivalry
5.3. PESTEL Analysis
5.3.1. Political Factors
5.3.2. Economic Factors
5.3.3. Social Factors
5.3.4. Technological Factors
5.3.5. Environmental Factors
5.3.6. Legal Factors
5.4. Key Market Trends
5.4.1. Demand Side Trends
5.4.2. Supply Side Trends
5.5. Value Chain Analysis
5.6. Technology Analysis
5.6.1. Research and development in the global market
5.6.2. Patent Analysis
5.6.3. Emerging technologies and their potential disruption to the market
5.7. Consumer Behaviour Analysis
5.7.1. Consumer Preferences and Expectations
5.7.2. Factors Influencing Consumer Buying Decisions
5.7.2.1. North America
5.7.2.2. Europe
5.7.2.3. Asia Pacific
5.7.2.4. Latin America
5.7.2.5. Middle East and Africa
5.7.3. Consumer Pain Points
5.8. Analysis and Recommendations
5.9. Adjacent Market Analysis
6. Market Positioning of Key Players, 2023
6.1. Company market share of key players, 2023
6.2. Competitive Benchmarking
6.3. Market Positioning of Key Vendors
6.4. Geographical Presence Analysis
6.5. Major Strategies Adopted by Key Players
6.5.1. Key Strategies Analysis
6.5.2. Mergers and Acquisitions
6.5.3. Partnerships
6.5.4. Product Launch
6.5.5. Geographical Expansion
6.5.6. Others
7. Impact Analysis of COVID 19 and Russia – Ukraine War on Liquefied Petroleum Gas (LPG) Market
7.1. Ukraine-Russia War Impact
7.1.1. Uncertainty and Economic Instability
7.1.2. Supply chain disruptions
7.1.3. Regional market shifts
7.1.4. Shift in government priorities
7.2. COVID-19 Impact Analysis
7.2.1. Supply Chain Disruptions
7.2.2. Demand Fluctuations
7.2.3. Shift in Product Mix
7.2.4. Reduced Industrial Activity
7.2.5. Regional Impact Analysis
7.2.5.1. North America
7.2.5.2. Europe
7.2.5.3. Asia Pacific
7.2.5.4. Latin America
7.2.5.5. Middle East and Africa
8. Global Liquefied Petroleum Gas (LPG) Market, By Application Segmentation
8.1. Global Liquefied Petroleum Gas (LPG) Market Overview, by Application Segmentation
8.1.1. Global Liquefied Petroleum Gas (LPG) Market Revenue Share, By Application Segmentation, 2023 Vs 2032 (in %)
8.2. Residential
8.2.1. Global Liquefied Petroleum Gas (LPG) Market, By Residential, By Region, 2019-2032 (US$ Mn)
8.2.2. Market Dynamics for Residential
8.2.2.1. Drivers
8.2.2.2. Restraints
8.2.2.3. Opportunities
8.2.2.4. Trends
8.3. Commercial
8.3.1. Global Liquefied Petroleum Gas (LPG) Market, By Commercial, By Region, 2019-2032 (US$ Mn)
8.3.2. Market Dynamics for Commercial
8.3.2.1. Drivers
8.3.2.2. Restraints
8.3.2.3. Opportunities
8.3.2.4. Trends
8.4. Industrial
8.4.1. Global Liquefied Petroleum Gas (LPG) Market, By Industrial, By Region, 2019-2032 (US$ Mn)
8.4.2. Market Dynamics for Industrial
8.4.2.1. Drivers
8.4.2.2. Restraints
8.4.2.3. Opportunities
8.4.2.4. Trends
8.5. Transportation
8.5.1. Global Liquefied Petroleum Gas (LPG) Market, By Transportation, By Region, 2019-2032 (US$ Mn)
8.5.2. Market Dynamics for Transportation
8.5.2.1. Drivers
8.5.2.2. Restraints
8.5.2.3. Opportunities
8.5.2.4. Trends
8.6. Agriculture
8.6.1. Global Liquefied Petroleum Gas (LPG) Market, By Agriculture, By Region, 2019-2032 (US$ Mn)
8.6.2. Market Dynamics for Agriculture
8.6.2.1. Drivers
8.6.2.2. Restraints
8.6.2.3. Opportunities
8.6.2.4. Trends
8.7. Power Generation
8.7.1. Global Liquefied Petroleum Gas (LPG) Market, By Power Generation, By Region, 2019-2032 (US$ Mn)
8.7.2. Market Dynamics for Power Generation
8.7.2.1. Drivers
8.7.2.2. Restraints
8.7.2.3. Opportunities
8.7.2.4. Trends
8.8. Recreational
8.8.1. Global Liquefied Petroleum Gas (LPG) Market, By Recreational, By Region, 2019-2032 (US$ Mn)
8.8.2. Market Dynamics for Recreational
8.8.2.1. Drivers
8.8.2.2. Restraints
8.8.2.3. Opportunities
8.8.2.4. Trends
8.9. Others
8.9.1. Global Liquefied Petroleum Gas (LPG) Market, By Others, By Region, 2019-2032 (US$ Mn)
8.9.2. Market Dynamics for Others
8.9.2.1. Drivers
8.9.2.2. Restraints
8.9.2.3. Opportunities
8.9.2.4. Trends
9. Global Liquefied Petroleum Gas (LPG) Market, By End-User Segmentation
9.1. Global Liquefied Petroleum Gas (LPG) Market Overview, by End-User Segmentation
9.1.1. Global Liquefied Petroleum Gas (LPG) Market Revenue Share, By End-User Segmentation, 2023 Vs 2032 (in %)
9.2. Households
9.2.1. Global Liquefied Petroleum Gas (LPG) Market, By Households, By Region, 2019-2032 (US$ Mn)
9.2.2. Market Dynamics for Households
9.2.2.1. Drivers
9.2.2.2. Restraints
9.2.2.3. Opportunities
9.2.2.4. Trends
9.3. Commercial Enterprises
9.3.1. Global Liquefied Petroleum Gas (LPG) Market, By Commercial Enterprises, By Region, 2019-2032 (US$ Mn)
9.3.2. Market Dynamics for Commercial Enterprises
9.3.2.1. Drivers
9.3.2.2. Restraints
9.3.2.3. Opportunities
9.3.2.4. Trends
9.4. Industrial Facilities
9.4.1. Global Liquefied Petroleum Gas (LPG) Market, By Industrial Facilities, By Region, 2019-2032 (US$ Mn)
9.4.2. Market Dynamics for Industrial Facilities
9.4.2.1. Drivers
9.4.2.2. Restraints
9.4.2.3. Opportunities
9.4.2.4. Trends
9.5. Transportation Operators
9.5.1. Global Liquefied Petroleum Gas (LPG) Market, By Transportation Operators, By Region, 2019-2032 (US$ Mn)
9.5.2. Market Dynamics for Transportation Operators
9.5.2.1. Drivers
9.5.2.2. Restraints
9.5.2.3. Opportunities
9.5.2.4. Trends
9.6. Agricultural Operations
9.6.1. Global Liquefied Petroleum Gas (LPG) Market, By Agricultural Operations, By Region, 2019-2032 (US$ Mn)
9.6.2. Market Dynamics for Agricultural Operations
9.6.2.1. Drivers
9.6.2.2. Restraints
9.6.2.3. Opportunities
9.6.2.4. Trends
9.7. Power Generation Utilities
9.7.1. Global Liquefied Petroleum Gas (LPG) Market, By Power Generation Utilities, By Region, 2019-2032 (US$ Mn)
9.7.2. Market Dynamics for Power Generation Utilities
9.7.2.1. Drivers
9.7.2.2. Restraints
9.7.2.3. Opportunities
9.7.2.4. Trends
9.8. Recreational Users
9.8.1. Global Liquefied Petroleum Gas (LPG) Market, By Recreational Users, By Region, 2019-2032 (US$ Mn)
9.8.2. Market Dynamics for Recreational Users
9.8.2.1. Drivers
9.8.2.2. Restraints
9.8.2.3. Opportunities
9.8.2.4. Trends
10. Global Liquefied Petroleum Gas (LPG) Market, By Region
10.1. Global Liquefied Petroleum Gas (LPG) Market Overview, by Region
10.1.1. Global Liquefied Petroleum Gas (LPG) Market, By Region, 2023 Vs 2032 (in%)
10.2. Application Segmentation
10.2.1. Global Liquefied Petroleum Gas (LPG) Market, By Application Segmentation, 2019-2032 (US$ Mn)
10.3. End-User Segmentation
10.3.1. Global Liquefied Petroleum Gas (LPG) Market, By End-User Segmentation, 2019-2032 (US$ Mn)
11. North America Liquefied Petroleum Gas (LPG) Market Analysis
11.1. Overview
11.1.1. Market Dynamics for North America
11.1.1.1. Drivers
11.1.1.2. Restraints
11.1.1.3. Opportunities
11.1.1.4. Trends
11.2. North America Liquefied Petroleum Gas (LPG) Market, by Application Segmentation, 2019-2032(US$ Mn)
11.2.1. Overview
11.2.2. SRC Analysis
11.3. North America Liquefied Petroleum Gas (LPG) Market, by End-User Segmentation, 2019-2032(US$ Mn)
11.3.1. Overview
11.3.2. SRC Analysis
11.4. North America Liquefied Petroleum Gas (LPG) Market, by Country, 2019-2032 (US$ Mn)
11.4.1. North America Liquefied Petroleum Gas (LPG) Market, by Country, 2023 Vs 2032 (in%)
11.4.2. U.S.
11.4.3. Canada
11.4.4. Mexico
12. Europe Liquefied Petroleum Gas (LPG) Market Analysis
12.1. Overview
12.1.1. Market Dynamics for Europe
12.1.1.1. Drivers
12.1.1.2. Restraints
12.1.1.3. Opportunities
12.1.1.4. Trends
12.2. Europe Liquefied Petroleum Gas (LPG) Market, by Application Segmentation, 2019-2032(US$ Mn)
12.2.1. Overview
12.2.2. SRC Analysis
12.3. Europe Liquefied Petroleum Gas (LPG) Market, by End-User Segmentation, 2019-2032(US$ Mn)
12.3.1. Overview
12.3.2. SRC Analysis
12.4. Europe Liquefied Petroleum Gas (LPG) Market, by Country, 2019-2032 (US$ Mn)
12.4.1. Europe Liquefied Petroleum Gas (LPG) Market, by Country, 2023 Vs 2032 (in%)
12.4.2. UK
12.4.3. France
12.4.4. Germany
12.4.5. Italy
12.4.6. Spain
12.4.7. Benelux
12.4.8. Russia
12.4.9. Rest of Europe
13. Asia Pacific Liquefied Petroleum Gas (LPG) Market Analysis
13.1. Overview
13.1.1. Market Dynamics for Asia Pacific
13.1.1.1. Drivers
13.1.1.2. Restraints
13.1.1.3. Opportunities
13.1.1.4. Trends
13.2. Asia Pacific Liquefied Petroleum Gas (LPG) Market, by Application Segmentation, 2019-2032(US$ Mn)
13.2.1. Overview
13.2.2. SRC Analysis
13.3. Asia Pacific Liquefied Petroleum Gas (LPG) Market, by End-User Segmentation, 2019-2032(US$ Mn)
13.3.1. Overview
13.3.2. SRC Analysis
13.4. Asia Pacific Liquefied Petroleum Gas (LPG) Market, by Country, 2019-2032 (US$ Mn)
13.4.1. Asia Pacific Liquefied Petroleum Gas (LPG) Market, by Country, 2023 Vs 2032 (in%)
13.4.2. China
13.4.3. Japan
13.4.4. India
13.4.5. South Korea
13.4.6. South East Asia
13.4.7. Rest of Asia Pacific
14. Latin America Liquefied Petroleum Gas (LPG) Market Analysis
14.1. Overview
14.1.1. Market Dynamics for Latin America
14.1.1.1. Drivers
14.1.1.2. Restraints
14.1.1.3. Opportunities
14.1.1.4. Trends
14.2. Latin America Liquefied Petroleum Gas (LPG) Market, by Application Segmentation, 2019-2032(US$ Mn)
14.2.1. Overview
14.2.2. SRC Analysis
14.3. Latin America Liquefied Petroleum Gas (LPG) Market, by End-User Segmentation, 2019-2032(US$ Mn)
14.3.1. Overview
14.3.2. SRC Analysis
14.4. Latin America Liquefied Petroleum Gas (LPG) Market, by Country, 2019-2032 (US$ Mn)
14.4.1. Latin America Liquefied Petroleum Gas (LPG) Market, by Country, 2023 Vs 2032 (in%)
14.4.2. Brazil
14.4.3. Argentina
14.4.4. Rest of Latin America
15. Middle East Liquefied Petroleum Gas (LPG) Market Analysis
15.1. Overview
15.1.1. Market Dynamics for Middle East
15.1.1.1. Drivers
15.1.1.2. Restraints
15.1.1.3. Opportunities
15.1.1.4. Trends
15.2. Middle East Liquefied Petroleum Gas (LPG) Market, by Application Segmentation, 2019-2032(US$ Mn)
15.2.1. Overview
15.2.2. SRC Analysis
15.3. Middle East Liquefied Petroleum Gas (LPG) Market, by End-User Segmentation, 2019-2032(US$ Mn)
15.3.1. Overview
15.3.2. SRC Analysis
15.4. Middle East Liquefied Petroleum Gas (LPG) Market, by Country, 2019-2032 (US$ Mn)
15.4.1. Middle East Liquefied Petroleum Gas (LPG) Market, by Country, 2023 Vs 2032 (in%)
15.4.2. UAE
15.4.3. Saudi Arabia
15.4.4. Rest of Middle East
16. Africa Liquefied Petroleum Gas (LPG) Market Analysis
16.1. Overview
16.1.1. Market Dynamics for Africa
16.1.1.1. Drivers
16.1.1.2. Restraints
16.1.1.3. Opportunities
16.1.1.4. Trends
16.2. Africa Liquefied Petroleum Gas (LPG) Market, by Application Segmentation, 2019-2032(US$ Mn)
16.2.1. Overview
16.2.2. SRC Analysis
16.3. Africa Liquefied Petroleum Gas (LPG) Market, by End-User Segmentation, 2019-2032(US$ Mn)
16.3.1. Overview
16.3.2. SRC Analysis
16.4. Africa Liquefied Petroleum Gas (LPG) Market, by Country, 2019-2032 (US$ Mn)
16.4.1. Africa Liquefied Petroleum Gas (LPG) Market, by Country, 2023 Vs 2032 (in%)
16.4.2. South Africa
16.4.3. Egypt
16.4.4. Rest of Africa
17. Company Profiles
17.1. Repsol
17.1.1. Company Overview
17.1.2. Products/Services Portfolio
17.1.3. Geographical Presence
17.1.4. SWOT Analysis
17.1.5. Financial Summary
17.1.5.1. Market Revenue and Net Profit (2019-2023)
17.1.5.2. Business Segment Revenue Analysis
17.1.5.3. Geographical Revenue Analysis
17.2. China Gas Holdings Ltd.
17.3. Saudi Arabian Oil Co.
17.4. FLAGA GmbH
17.5. Kleenheat
17.6. Bharat Petroleum Corporation Limited
17.7. JGC HOLDINGS CORPORATION
17.8. Phillips 66 Company
17.9. Chevron Corporation
17.10. Reliance Industries Limited
17.11. Exxon Mobil Corporation
17.12. Total
17.13. Royal Dutch Shell
17.14. Petroliam Nasional Berhad (PETRONAS)
17.15. PetroChina Company Limited
17.16. Petredec Pte Limited
17.17. Qatargas Operating Company Limited
17.18. Petrofac Limited
17.19. Vitol
17.20. China Petroleum & Chemical Corporation
17.21. BP Plc.
17.22. Others
18. Research Methodology
18.1. Research Methodology
18.2. Phase I – Secondary Research
18.3. Phase II – Data Modelling
18.3.1. Company Share Analysis Model
18.3.2. Revenue Based Modelling
18.4. Phase III – Primary Research
18.5. Research Limitations
18.5.1. Assumptions
List of Figures
FIG. 1 Global Liquefied Petroleum Gas (LPG) Market: Research Methodology
FIG. 2 Market Size Estimation – Top Down & Bottom up Approach
FIG. 3 Global Liquefied Petroleum Gas (LPG) Market Segmentation
FIG. 4 Global Liquefied Petroleum Gas (LPG) Market, by Application Segmentation, 2023 (US$ Mn)
FIG. 5 Global Liquefied Petroleum Gas (LPG) Market, by End-User Segmentation, 2023 (US$ Mn)
FIG. 6 Global Liquefied Petroleum Gas (LPG) Market, by Geography, 2023 (US$ Mn)
FIG. 7 Attractive Investment Proposition, by Application Segmentation, 2023
FIG. 8 Attractive Investment Proposition, by End-User Segmentation, 2023
FIG. 9 Attractive Investment Proposition, by Geography, 2023
FIG. 10 Global Market Share Analysis of Key Liquefied Petroleum Gas (LPG) Market Manufacturers, 2023
FIG. 11 Global Market Positioning of Key Liquefied Petroleum Gas (LPG) Market Manufacturers, 2023
FIG. 12 Global Liquefied Petroleum Gas (LPG) Market Value Contribution, By Application Segmentation, 2023 & 2032 (Value %)
FIG. 13 Global Liquefied Petroleum Gas (LPG) Market, by Residential, Value, 2019-2032 (US$ Mn)
FIG. 14 Global Liquefied Petroleum Gas (LPG) Market, by Commercial, Value, 2019-2032 (US$ Mn)
FIG. 15 Global Liquefied Petroleum Gas (LPG) Market, by Industrial, Value, 2019-2032 (US$ Mn)
FIG. 16 Global Liquefied Petroleum Gas (LPG) Market, by Transportation, Value, 2019-2032 (US$ Mn)
FIG. 17 Global Liquefied Petroleum Gas (LPG) Market, by Agriculture, Value, 2019-2032 (US$ Mn)
FIG. 18 Global Liquefied Petroleum Gas (LPG) Market, by Power Generation, Value, 2019-2032 (US$ Mn)
FIG. 19 Global Liquefied Petroleum Gas (LPG) Market, by Recreational, Value, 2019-2032 (US$ Mn)
FIG. 20 Global Liquefied Petroleum Gas (LPG) Market, by Others, Value, 2019-2032 (US$ Mn)
FIG. 21 Global Liquefied Petroleum Gas (LPG) Market Value Contribution, By End-User Segmentation, 2023 & 2032 (Value %)
FIG. 22 Global Liquefied Petroleum Gas (LPG) Market, by Households, Value, 2019-2032 (US$ Mn)
FIG. 23 Global Liquefied Petroleum Gas (LPG) Market, by Commercial Enterprises, Value, 2019-2032 (US$ Mn)
FIG. 24 Global Liquefied Petroleum Gas (LPG) Market, by Industrial Facilities, Value, 2019-2032 (US$ Mn)
FIG. 25 Global Liquefied Petroleum Gas (LPG) Market, by Transportation Operators, Value, 2019-2032 (US$ Mn)
FIG. 26 Global Liquefied Petroleum Gas (LPG) Market, by Agricultural Operations, Value, 2019-2032 (US$ Mn)
FIG. 27 Global Liquefied Petroleum Gas (LPG) Market, by Power Generation Utilities, Value, 2019-2032 (US$ Mn)
FIG. 28 Global Liquefied Petroleum Gas (LPG) Market, by Recreational Users, Value, 2019-2032 (US$ Mn)
FIG. 29 North America Liquefied Petroleum Gas (LPG) Market, 2019-2032 (US$ Mn)
FIG. 30 U.S. Liquefied Petroleum Gas (LPG) Market, 2019-2032 (US$ Mn)
FIG. 31 Canada Liquefied Petroleum Gas (LPG) Market, 2019-2032 (US$ Mn)
FIG. 32 Mexico Liquefied Petroleum Gas (LPG) Market, 2019-2032 (US$ Mn)
FIG. 33 Europe Liquefied Petroleum Gas (LPG) Market, 2019-2032 (US$ Mn)
FIG. 34 Germany Liquefied Petroleum Gas (LPG) Market, 2019-2032 (US$ Mn)
FIG. 35 France Liquefied Petroleum Gas (LPG) Market, 2019-2032 (US$ Mn)
FIG. 36 U.K. Liquefied Petroleum Gas (LPG) Market, 2019-2032 (US$ Mn)
FIG. 37 Italy Liquefied Petroleum Gas (LPG) Market, 2019-2032 (US$ Mn)
FIG. 38 Spain Liquefied Petroleum Gas (LPG) Market, 2019-2032 (US$ Mn)
FIG. 39 Benelux Liquefied Petroleum Gas (LPG) Market, 2019-2032 (US$ Mn)
FIG. 40 Russia Liquefied Petroleum Gas (LPG) Market, 2019-2032 (US$ Mn)
FIG. 41 Rest of Europe Liquefied Petroleum Gas (LPG) Market, 2019-2032 (US$ Mn)
FIG. 42 Asia Pacific Liquefied Petroleum Gas (LPG) Market, 2019-2032 (US$ Mn)
FIG. 43 China Liquefied Petroleum Gas (LPG) Market, 2019-2032 (US$ Mn)
FIG. 44 Japan Liquefied Petroleum Gas (LPG) Market, 2019-2032 (US$ Mn)
FIG. 45 India Liquefied Petroleum Gas (LPG) Market, 2019-2032 (US$ Mn)
FIG. 46 South Korea Liquefied Petroleum Gas (LPG) Market, 2019-2032 (US$ Mn)
FIG. 47 South-East Asia Liquefied Petroleum Gas (LPG) Market, 2019-2032 (US$ Mn)
FIG. 48 Rest of Asia Pacific Liquefied Petroleum Gas (LPG) Market, 2019-2032 (US$ Mn)
FIG. 49 Latin America Liquefied Petroleum Gas (LPG) Market, 2019-2032 (US$ Mn)
FIG. 50 Brazil Liquefied Petroleum Gas (LPG) Market, 2019-2032 (US$ Mn)
FIG. 51 Argentina Liquefied Petroleum Gas (LPG) Market, 2019-2032 (US$ Mn)
FIG. 52 Rest of Latin America Liquefied Petroleum Gas (LPG) Market, 2019-2032 (US$ Mn)
FIG. 53 Middle East Liquefied Petroleum Gas (LPG) Market, 2019-2032 (US$ Mn)
FIG. 54 UAE Liquefied Petroleum Gas (LPG) Market, 2019-2032 (US$ Mn)
FIG. 55 Saudi Arabia Liquefied Petroleum Gas (LPG) Market, 2019-2032 (US$ Mn)
FIG. 56 Rest of Middle East Liquefied Petroleum Gas (LPG) Market, 2019-2032 (US$ Mn)
FIG. 57 Africa Liquefied Petroleum Gas (LPG) Market, 2019-2032 (US$ Mn)
FIG. 58 South Africa Liquefied Petroleum Gas (LPG) Market, 2019-2032 (US$ Mn)
FIG. 59 Egypt Liquefied Petroleum Gas (LPG) Market, 2019-2032 (US$ Mn)
FIG. 60 Rest of Africa Liquefied Petroleum Gas (LPG) Market, 2019-2032 (US$ Mn)
List of Tables
TABLE 1 Market Snapshot: Global Liquefied Petroleum Gas (LPG) Market
TABLE 2 Global Liquefied Petroleum Gas (LPG) Market: Market Drivers Impact Analysis
TABLE 3 Global Liquefied Petroleum Gas (LPG) Market: Market Restraints Impact Analysis
TABLE 4 Global Liquefied Petroleum Gas (LPG) Market, by Competitive Benchmarking, 2023
TABLE 5 Global Liquefied Petroleum Gas (LPG) Market, by Geographical Presence Analysis, 2023
TABLE 6 Global Liquefied Petroleum Gas (LPG) Market, by Key Strategies Analysis, 2023
TABLE 7 Global Liquefied Petroleum Gas (LPG) Market, by Residential, By Region, 2019-2023 (US$ Mn)
TABLE 8 Global Liquefied Petroleum Gas (LPG) Market, by Residential, By Region, 2024-2032 (US$ Mn)
TABLE 9 Global Liquefied Petroleum Gas (LPG) Market, by Commercial, By Region, 2019-2023 (US$ Mn)
TABLE 10 Global Liquefied Petroleum Gas (LPG) Market, by Commercial, By Region, 2024-2032 (US$ Mn)
TABLE 11 Global Liquefied Petroleum Gas (LPG) Market, by Industrial, By Region, 2019-2023 (US$ Mn)
TABLE 12 Global Liquefied Petroleum Gas (LPG) Market, by Industrial, By Region, 2024-2032 (US$ Mn)
TABLE 13 Global Liquefied Petroleum Gas (LPG) Market, by Transportation, By Region, 2019-2023 (US$ Mn)
TABLE 14 Global Liquefied Petroleum Gas (LPG) Market, by Transportation, By Region, 2024-2032 (US$ Mn)
TABLE 15 Global Liquefied Petroleum Gas (LPG) Market, by Agriculture, By Region, 2019-2023 (US$ Mn)
TABLE 16 Global Liquefied Petroleum Gas (LPG) Market, by Agriculture, By Region, 2024-2032 (US$ Mn)
TABLE 17 Global Liquefied Petroleum Gas (LPG) Market, by Power Generation, By Region, 2019-2023 (US$ Mn)
TABLE 18 Global Liquefied Petroleum Gas (LPG) Market, by Power Generation, By Region, 2024-2032 (US$ Mn)
TABLE 19 Global Liquefied Petroleum Gas (LPG) Market, by Recreational, By Region, 2019-2023 (US$ Mn)
TABLE 20 Global Liquefied Petroleum Gas (LPG) Market, by Recreational, By Region, 2024-2032 (US$ Mn)
TABLE 21 Global Liquefied Petroleum Gas (LPG) Market, by Others, By Region, 2019-2023 (US$ Mn)
TABLE 22 Global Liquefied Petroleum Gas (LPG) Market, by Others, By Region, 2024-2032 (US$ Mn)
TABLE 23 Global Liquefied Petroleum Gas (LPG) Market, by Households, By Region, 2019-2023 (US$ Mn)
TABLE 24 Global Liquefied Petroleum Gas (LPG) Market, by Households, By Region, 2024-2032 (US$ Mn)
TABLE 25 Global Liquefied Petroleum Gas (LPG) Market, by Commercial Enterprises, By Region, 2019-2023 (US$ Mn)
TABLE 26 Global Liquefied Petroleum Gas (LPG) Market, by Commercial Enterprises, By Region, 2024-2032 (US$ Mn)
TABLE 27 Global Liquefied Petroleum Gas (LPG) Market, by Industrial Facilities, By Region, 2019-2023 (US$ Mn)
TABLE 28 Global Liquefied Petroleum Gas (LPG) Market, by Industrial Facilities, By Region, 2024-2032 (US$ Mn)
TABLE 29 Global Liquefied Petroleum Gas (LPG) Market, by Transportation Operators, By Region, 2019-2023 (US$ Mn)
TABLE 30 Global Liquefied Petroleum Gas (LPG) Market, by Transportation Operators, By Region, 2024-2032 (US$ Mn)
TABLE 31 Global Liquefied Petroleum Gas (LPG) Market, by Agricultural Operations, By Region, 2019-2023 (US$ Mn)
TABLE 32 Global Liquefied Petroleum Gas (LPG) Market, by Agricultural Operations, By Region, 2024-2032 (US$ Mn)
TABLE 33 Global Liquefied Petroleum Gas (LPG) Market, by Power Generation Utilities, By Region, 2019-2023 (US$ Mn)
TABLE 34 Global Liquefied Petroleum Gas (LPG) Market, by Power Generation Utilities, By Region, 2024-2032 (US$ Mn)
TABLE 35 Global Liquefied Petroleum Gas (LPG) Market, by Recreational Users, By Region, 2019-2023 (US$ Mn)
TABLE 36 Global Liquefied Petroleum Gas (LPG) Market, by Recreational Users, By Region, 2024-2032 (US$ Mn)
TABLE 37 Global Liquefied Petroleum Gas (LPG) Market, by Application Segmentation, 2019-2023 (US$ Mn)
TABLE 38 Global Liquefied Petroleum Gas (LPG) Market, by Application Segmentation, 2024-2032 (US$ Mn)
TABLE 39 Global Liquefied Petroleum Gas (LPG) Market, by End-User Segmentation, 2019-2023 (US$ Mn)
TABLE 40 Global Liquefied Petroleum Gas (LPG) Market, by End-User Segmentation, 2024-2032 (US$ Mn)
TABLE 41 Global Liquefied Petroleum Gas (LPG) Market, by Region, 2019-2023 (US$ Mn)
TABLE 42 Global Liquefied Petroleum Gas (LPG) Market, by Region, 2024-2032 (US$ Mn)
TABLE 43 North America Liquefied Petroleum Gas (LPG) Market, by Application Segmentation, 2019-2023 (US$ Mn)
TABLE 44 North America Liquefied Petroleum Gas (LPG) Market, by Application Segmentation, 2024-2032 (US$ Mn)
TABLE 45 North America Liquefied Petroleum Gas (LPG) Market, by End-User Segmentation, 2019-2023 (US$ Mn)
TABLE 46 North America Liquefied Petroleum Gas (LPG) Market, by End-User Segmentation, 2024-2032 (US$ Mn)
TABLE 47 North America Liquefied Petroleum Gas (LPG) Market, by Country, 2019-2023 (US$ Mn)
TABLE 48 North America Liquefied Petroleum Gas (LPG) Market, by Country, 2024-2032 (US$ Mn)
TABLE 49 United States Liquefied Petroleum Gas (LPG) Market, by Application Segmentation, 2019-2023 (US$ Mn)
TABLE 50 United States Liquefied Petroleum Gas (LPG) Market, by Application Segmentation, 2024-2032 (US$ Mn)
TABLE 51 United States Liquefied Petroleum Gas (LPG) Market, by End-User Segmentation, 2019-2023 (US$ Mn)
TABLE 52 United States Liquefied Petroleum Gas (LPG) Market, by End-User Segmentation, 2024-2032 (US$ Mn)
TABLE 53 Canada Liquefied Petroleum Gas (LPG) Market, by Application Segmentation, 2019-2023 (US$ Mn)
TABLE 54 Canada Liquefied Petroleum Gas (LPG) Market, by Application Segmentation, 2024-2032 (US$ Mn)
TABLE 55 Canada Liquefied Petroleum Gas (LPG) Market, by End-User Segmentation, 2019-2023 (US$ Mn)
TABLE 56 Canada Liquefied Petroleum Gas (LPG) Market, by End-User Segmentation, 2024-2032 (US$ Mn)
TABLE 57 Mexico Liquefied Petroleum Gas (LPG) Market, by Application Segmentation, 2019-2023 (US$ Mn)
TABLE 58 Mexico Liquefied Petroleum Gas (LPG) Market, by Application Segmentation, 2024-2032 (US$ Mn)
TABLE 59 Mexico Liquefied Petroleum Gas (LPG) Market, by End-User Segmentation, 2019-2023 (US$ Mn)
TABLE 60 Mexico Liquefied Petroleum Gas (LPG) Market, by End-User Segmentation, 2024-2032 (US$ Mn)
TABLE 61 Europe Liquefied Petroleum Gas (LPG) Market, by Application Segmentation, 2019-2023 (US$ Mn)
TABLE 62 Europe Liquefied Petroleum Gas (LPG) Market, by Application Segmentation, 2024-2032 (US$ Mn)
TABLE 63 Europe Liquefied Petroleum Gas (LPG) Market, by End-User Segmentation, 2019-2023 (US$ Mn)
TABLE 64 Europe Liquefied Petroleum Gas (LPG) Market, by End-User Segmentation, 2024-2032 (US$ Mn)
TABLE 65 Europe Liquefied Petroleum Gas (LPG) Market, by Country, 2019-2023 (US$ Mn)
TABLE 66 Europe Liquefied Petroleum Gas (LPG) Market, by Country, 2024-2032 (US$ Mn)
TABLE 67 Germany Liquefied Petroleum Gas (LPG) Market, by Application Segmentation, 2019-2023 (US$ Mn)
TABLE 68 Germany Liquefied Petroleum Gas (LPG) Market, by Application Segmentation, 2024-2032 (US$ Mn)
TABLE 69 Germany Liquefied Petroleum Gas (LPG) Market, by End-User Segmentation, 2019-2023 (US$ Mn)
TABLE 70 Germany Liquefied Petroleum Gas (LPG) Market, by End-User Segmentation, 2024-2032 (US$ Mn)
TABLE 71 France Liquefied Petroleum Gas (LPG) Market, by Application Segmentation, 2019-2023 (US$ Mn)
TABLE 72 France Liquefied Petroleum Gas (LPG) Market, by Application Segmentation, 2024-2032 (US$ Mn)
TABLE 73 France Liquefied Petroleum Gas (LPG) Market, by End-User Segmentation, 2019-2023 (US$ Mn)
TABLE 74 France Liquefied Petroleum Gas (LPG) Market, by End-User Segmentation, 2024-2032 (US$ Mn)
TABLE 75 United Kingdom Liquefied Petroleum Gas (LPG) Market, by Application Segmentation, 2019-2023 (US$ Mn)
TABLE 76 United Kingdom Liquefied Petroleum Gas (LPG) Market, by Application Segmentation, 2024-2032 (US$ Mn)
TABLE 77 United Kingdom Liquefied Petroleum Gas (LPG) Market, by End-User Segmentation, 2019-2023 (US$ Mn)
TABLE 78 United Kingdom Liquefied Petroleum Gas (LPG) Market, by End-User Segmentation, 2024-2032 (US$ Mn)
TABLE 79 Italy Liquefied Petroleum Gas (LPG) Market, by Application Segmentation, 2019-2023 (US$ Mn)
TABLE 80 Italy Liquefied Petroleum Gas (LPG) Market, by Application Segmentation, 2024-2032 (US$ Mn)
TABLE 81 Italy Liquefied Petroleum Gas (LPG) Market, by End-User Segmentation, 2019-2023 (US$ Mn)
TABLE 82 Italy Liquefied Petroleum Gas (LPG) Market, by End-User Segmentation, 2024-2032 (US$ Mn)
TABLE 83 Spain Liquefied Petroleum Gas (LPG) Market, by Application Segmentation, 2019-2023 (US$ Mn)
TABLE 84 Spain Liquefied Petroleum Gas (LPG) Market, by Application Segmentation, 2024-2032 (US$ Mn)
TABLE 85 Spain Liquefied Petroleum Gas (LPG) Market, by End-User Segmentation, 2019-2023 (US$ Mn)
TABLE 86 Spain Liquefied Petroleum Gas (LPG) Market, by End-User Segmentation, 2024-2032 (US$ Mn)
TABLE 87 Benelux Liquefied Petroleum Gas (LPG) Market, by Application Segmentation, 2019-2023 (US$ Mn)
TABLE 88 Benelux Liquefied Petroleum Gas (LPG) Market, by Application Segmentation, 2024-2032 (US$ Mn)
TABLE 89 Benelux Liquefied Petroleum Gas (LPG) Market, by End-User Segmentation, 2019-2023 (US$ Mn)
TABLE 90 Benelux Liquefied Petroleum Gas (LPG) Market, by End-User Segmentation, 2024-2032 (US$ Mn)
TABLE 91 Russia Liquefied Petroleum Gas (LPG) Market, by Application Segmentation, 2019-2023 (US$ Mn)
TABLE 92 Russia Liquefied Petroleum Gas (LPG) Market, by Application Segmentation, 2024-2032 (US$ Mn)
TABLE 93 Russia Liquefied Petroleum Gas (LPG) Market, by End-User Segmentation, 2019-2023 (US$ Mn)
TABLE 94 Russia Liquefied Petroleum Gas (LPG) Market, by End-User Segmentation, 2024-2032 (US$ Mn)
TABLE 95 Rest of Europe Liquefied Petroleum Gas (LPG) Market, by Application Segmentation, 2019-2023 (US$ Mn)
TABLE 96 Rest of Europe Liquefied Petroleum Gas (LPG) Market, by Application Segmentation, 2024-2032 (US$ Mn)
TABLE 97 Rest of Europe Liquefied Petroleum Gas (LPG) Market, by End-User Segmentation, 2019-2023 (US$ Mn)
TABLE 98 Rest of Europe Liquefied Petroleum Gas (LPG) Market, by End-User Segmentation, 2024-2032 (US$ Mn)
TABLE 99 Asia Pacific Liquefied Petroleum Gas (LPG) Market, by Application Segmentation, 2019-2023 (US$ Mn)
TABLE 100 Asia Pacific Liquefied Petroleum Gas (LPG) Market, by Application Segmentation, 2024-2032 (US$ Mn)
TABLE 101 Asia Pacific Liquefied Petroleum Gas (LPG) Market, by End-User Segmentation, 2019-2023 (US$ Mn)
TABLE 102 Asia Pacific Liquefied Petroleum Gas (LPG) Market, by End-User Segmentation, 2024-2032 (US$ Mn)
TABLE 103 China Liquefied Petroleum Gas (LPG) Market, by Application Segmentation, 2019-2023 (US$ Mn)
TABLE 104 China Liquefied Petroleum Gas (LPG) Market, by Application Segmentation, 2024-2032 (US$ Mn)
TABLE 105 China Liquefied Petroleum Gas (LPG) Market, by End-User Segmentation, 2019-2023 (US$ Mn)
TABLE 106 China Liquefied Petroleum Gas (LPG) Market, by End-User Segmentation, 2024-2032 (US$ Mn)
TABLE 107 Japan Liquefied Petroleum Gas (LPG) Market, by Application Segmentation, 2019-2023 (US$ Mn)
TABLE 108 Japan Liquefied Petroleum Gas (LPG) Market, by Application Segmentation, 2024-2032 (US$ Mn)
TABLE 109 Japan Liquefied Petroleum Gas (LPG) Market, by End-User Segmentation, 2019-2023 (US$ Mn)
TABLE 110 Japan Liquefied Petroleum Gas (LPG) Market, by End-User Segmentation, 2024-2032 (US$ Mn)
TABLE 111 India Liquefied Petroleum Gas (LPG) Market, by Application Segmentation, 2019-2023 (US$ Mn)
TABLE 112 India Liquefied Petroleum Gas (LPG) Market, by Application Segmentation, 2024-2032 (US$ Mn)
TABLE 113 India Liquefied Petroleum Gas (LPG) Market, by End-User Segmentation, 2019-2023 (US$ Mn)
TABLE 114 India Liquefied Petroleum Gas (LPG) Market, by End-User Segmentation, 2024-2032 (US$ Mn)
TABLE 115 South Korea Liquefied Petroleum Gas (LPG) Market, by Application Segmentation, 2019-2023 (US$ Mn)
TABLE 116 South Korea Liquefied Petroleum Gas (LPG) Market, by Application Segmentation, 2024-2032 (US$ Mn)
TABLE 117 South Korea Liquefied Petroleum Gas (LPG) Market, by End-User Segmentation, 2019-2023 (US$ Mn)
TABLE 118 South Korea Liquefied Petroleum Gas (LPG) Market, by End-User Segmentation, 2024-2032 (US$ Mn)
TABLE 119 South-East Asia Liquefied Petroleum Gas (LPG) Market, by Application Segmentation, 2019-2023 (US$ Mn)
TABLE 120 South-East Asia Liquefied Petroleum Gas (LPG) Market, by Application Segmentation, 2024-2032 (US$ Mn)
TABLE 121 South-East Asia Liquefied Petroleum Gas (LPG) Market, by End-User Segmentation, 2019-2023 (US$ Mn)
TABLE 122 South-East Asia Liquefied Petroleum Gas (LPG) Market, by End-User Segmentation, 2024-2032 (US$ Mn)
TABLE 123 Rest of Asia Pacific Liquefied Petroleum Gas (LPG) Market, by Application Segmentation, 2019-2023 (US$ Mn)
TABLE 124 Rest of Asia Pacific Liquefied Petroleum Gas (LPG) Market, by Application Segmentation, 2024-2032 (US$ Mn)
TABLE 125 Rest of Asia Pacific Liquefied Petroleum Gas (LPG) Market, by End-User Segmentation, 2019-2023 (US$ Mn)
TABLE 126 Rest of Asia Pacific Liquefied Petroleum Gas (LPG) Market, by End-User Segmentation, 2024-2032 (US$ Mn)
TABLE 127 Latin America Liquefied Petroleum Gas (LPG) Market, by Application Segmentation, 2019-2023 (US$ Mn)
TABLE 128 Latin America Liquefied Petroleum Gas (LPG) Market, by Application Segmentation, 2024-2032 (US$ Mn)
TABLE 129 Latin America Liquefied Petroleum Gas (LPG) Market, by End-User Segmentation, 2019-2023 (US$ Mn)
TABLE 130 Latin America Liquefied Petroleum Gas (LPG) Market, by End-User Segmentation, 2024-2032 (US$ Mn)
TABLE 131 Brazil Liquefied Petroleum Gas (LPG) Market, by Application Segmentation, 2019-2023 (US$ Mn)
TABLE 132 Brazil Liquefied Petroleum Gas (LPG) Market, by Application Segmentation, 2024-2032 (US$ Mn)
TABLE 133 Brazil Liquefied Petroleum Gas (LPG) Market, by End-User Segmentation, 2019-2023 (US$ Mn)
TABLE 134 Brazil Liquefied Petroleum Gas (LPG) Market, by End-User Segmentation, 2024-2032 (US$ Mn)
TABLE 135 Argentina Liquefied Petroleum Gas (LPG) Market, by Application Segmentation, 2019-2023 (US$ Mn)
TABLE 136 Argentina Liquefied Petroleum Gas (LPG) Market, by Application Segmentation, 2024-2032 (US$ Mn)
TABLE 137 Argentina Liquefied Petroleum Gas (LPG) Market, by End-User Segmentation, 2019-2023 (US$ Mn)
TABLE 138 Argentina Liquefied Petroleum Gas (LPG) Market, by End-User Segmentation, 2024-2032 (US$ Mn)
TABLE 139 Rest of Latin America Liquefied Petroleum Gas (LPG) Market, by Application Segmentation, 2019-2023 (US$ Mn)
TABLE 140 Rest of Latin America Liquefied Petroleum Gas (LPG) Market, by Application Segmentation, 2024-2032 (US$ Mn)
TABLE 141 Rest of Latin America Liquefied Petroleum Gas (LPG) Market, by End-User Segmentation, 2019-2023 (US$ Mn)
TABLE 142 Rest of Latin America Liquefied Petroleum Gas (LPG) Market, by End-User Segmentation, 2024-2032 (US$ Mn)
TABLE 143 Middle East Liquefied Petroleum Gas (LPG) Market, by Application Segmentation, 2019-2023 (US$ Mn)
TABLE 144 Middle East Liquefied Petroleum Gas (LPG) Market, by Application Segmentation, 2024-2032 (US$ Mn)
TABLE 145 Middle East Liquefied Petroleum Gas (LPG) Market, by End-User Segmentation, 2019-2023 (US$ Mn)
TABLE 146 Middle East Liquefied Petroleum Gas (LPG) Market, by End-User Segmentation, 2024-2032 (US$ Mn)
TABLE 147 UAE Liquefied Petroleum Gas (LPG) Market, by Application Segmentation, 2019-2023 (US$ Mn)
TABLE 148 UAE Liquefied Petroleum Gas (LPG) Market, by Application Segmentation, 2024-2032 (US$ Mn)
TABLE 149 UAE Liquefied Petroleum Gas (LPG) Market, by End-User Segmentation, 2019-2023 (US$ Mn)
TABLE 150 UAE Liquefied Petroleum Gas (LPG) Market, by End-User Segmentation, 2024-2032 (US$ Mn)
TABLE 151 Saudi Arabia Liquefied Petroleum Gas (LPG) Market, by Application Segmentation, 2019-2023 (US$ Mn)
TABLE 152 Saudi Arabia Liquefied Petroleum Gas (LPG) Market, by Application Segmentation, 2024-2032 (US$ Mn)
TABLE 153 Saudi Arabia Liquefied Petroleum Gas (LPG) Market, by End-User Segmentation, 2019-2023 (US$ Mn)
TABLE 154 Saudi Arabia Liquefied Petroleum Gas (LPG) Market, by End-User Segmentation, 2024-2032 (US$ Mn)
TABLE 155 Rest of Middle East Liquefied Petroleum Gas (LPG) Market, by Application Segmentation, 2019-2023 (US$ Mn)
TABLE 156 Rest of Middle East Liquefied Petroleum Gas (LPG) Market, by Application Segmentation, 2024-2032 (US$ Mn)
TABLE 157 Rest of Middle East Liquefied Petroleum Gas (LPG) Market, by End-User Segmentation, 2019-2023 (US$ Mn)
TABLE 158 Rest of Middle East Liquefied Petroleum Gas (LPG) Market, by End-User Segmentation, 2024-2032 (US$ Mn)
TABLE 159 Africa Liquefied Petroleum Gas (LPG) Market, by Application Segmentation, 2019-2023 (US$ Mn)
TABLE 160 Africa Liquefied Petroleum Gas (LPG) Market, by Application Segmentation, 2024-2032 (US$ Mn)
TABLE 161 Africa Liquefied Petroleum Gas (LPG) Market, by End-User Segmentation, 2019-2023 (US$ Mn)
TABLE 162 Africa Liquefied Petroleum Gas (LPG) Market, by End-User Segmentation, 2024-2032 (US$ Mn)
TABLE 163 South Africa Liquefied Petroleum Gas (LPG) Market, by Application Segmentation, 2019-2023 (US$ Mn)
TABLE 164 South Africa Liquefied Petroleum Gas (LPG) Market, by Application Segmentation, 2024-2032 (US$ Mn)
TABLE 165 South Africa Liquefied Petroleum Gas (LPG) Market, by End-User Segmentation, 2019-2023 (US$ Mn)
TABLE 166 South Africa Liquefied Petroleum Gas (LPG) Market, by End-User Segmentation, 2024-2032 (US$ Mn)
TABLE 167 Egypt Liquefied Petroleum Gas (LPG) Market, by Application Segmentation, 2019-2023 (US$ Mn)
TABLE 168 Egypt Liquefied Petroleum Gas (LPG) Market, by Application Segmentation, 2024-2032 (US$ Mn)
TABLE 169 Egypt Liquefied Petroleum Gas (LPG) Market, by End-User Segmentation, 2019-2023 (US$ Mn)
TABLE 170 Egypt Liquefied Petroleum Gas (LPG) Market, by End-User Segmentation, 2024-2032 (US$ Mn)
TABLE 171 Rest of Africa Liquefied Petroleum Gas (LPG) Market, by Application Segmentation, 2019-2023 (US$ Mn)
TABLE 172 Rest of Africa Liquefied Petroleum Gas (LPG) Market, by Application Segmentation, 2024-2032 (US$ Mn)
TABLE 173 Rest of Africa Liquefied Petroleum Gas (LPG) Market, by End-User Segmentation, 2019-2023 (US$ Mn)
TABLE 174 Rest of Africa Liquefied Petroleum Gas (LPG) Market, by End-User Segmentation, 2024-2032 (US$ Mn)