Market Overview
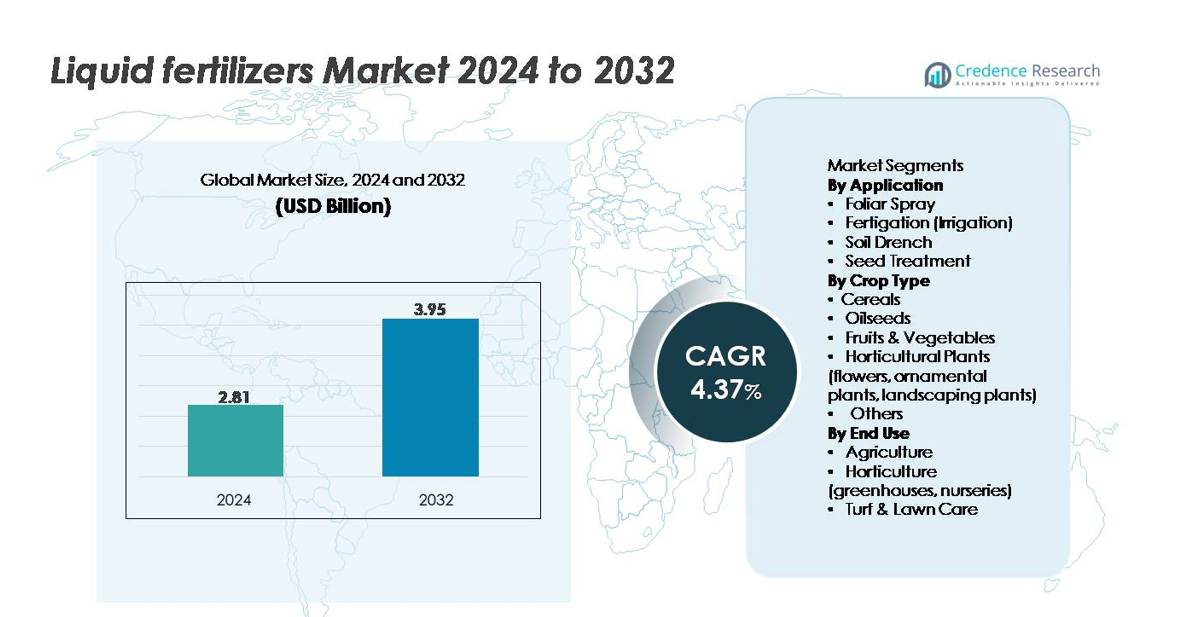
The global liquid fertilizers market was valued at USD 2.81 billion in 2024 and is projected to reach USD 3.95 billion by 2032, expanding at a CAGR of 4.37% during the forecast period.
| REPORT ATTRIBUTE |
DETAILS |
| Historical Period |
2020-2023 |
| Base Year |
2024 |
| Forecast Period |
2025-2032 |
| Liquid Fertilizers Market Size 2024 |
USD 2.81 billion |
| Liquid Fertilizers Market, CAGR |
4.37% |
| Liquid Fertilizers Market Size 2032 |
USD 3.95 billion |
The liquid fertilizers market is shaped by a mix of global leaders and specialized nutrient solution providers, including ICL, IFFCO, Compo Expert, EuroChem Group, Nutri-Tech Solutions Pty Ltd, K+S Aktiengesellschaft, FoxFarm Soil & Fertilizer Co, Nutrien Ltd., BMS Micro-Nutrients NV, and CSBP. These companies compete through advanced water-soluble formulations, chelated micronutrients, and fertigation-ready blends designed for high-value crops and precision irrigation systems. Asia-Pacific leads the global market with an estimated 34–36% share, driven by extensive agricultural acreage, expanding greenhouse cultivation, and strong adoption of micro-irrigation technologies. North America and Europe follow as key contributors, supported by technology-driven farming and specialty crop production.
Market Insights
- The global liquid fertilizers market was valued at USD 2.81 billion in 2024 and is projected to reach USD 3.95 billion by 2032, expanding at a CAGR of 4.37% during the forecast period.
- The market grows as precision agriculture, fertigation systems, and controlled irrigation drive demand for uniform nutrient delivery, with fertigation holding the largest application share at 42–45% due to its efficiency and compatibility with modern irrigation.
- Key trends include rising adoption of chelated micronutrients, bio-enhanced formulations, and nutrient blends tailored for greenhouse and hydroponic systems, supported by the rapid expansion of controlled-environment agriculture.
- Competition intensifies among major players such as ICL, Nutrien Ltd., EuroChem Group, K+S AG, and IFFCO, each advancing high-purity formulations, digital advisory tools, and integrated nutrient-application partnerships while regional specialists strengthen localized portfolios.
- Asia-Pacific leads with 34–36% market share, followed by North America at 28–30% and Europe at 24–26%, driven by strong uptake across fruits & vegetables the largest crop segment at 38–40%.
Access crucial information at unmatched prices!
Request your sample report today & start making informed decisions powered by Credence Research Inc.!
Download Sample
Market Segmentation Analysis:
By Application
Within the application landscape, fertigation represents the dominant sub-segment, accounting for approximately 42–45% of total liquid fertilizer usage, driven by the rapid expansion of drip and micro-irrigation systems across high-value crops. Fertigation enables precise nutrient dosing, reduces input losses, and improves overall nutrient-use efficiency, making it the preferred method for both open-field and protected cultivation. Foliar spray maintains strong adoption in micronutrient correction programs, while soil drench and seed treatment gain traction in specialty crop management and early-stage root development support. Rising demand for high-efficiency nutrient delivery systems reinforces fertigation’s leadership.
- For instance, Haifa Group’s Haifa Cal™ is a line of high-quality, fully water-soluble, crystalline or granular calcium nitrate fertilizers designed for uniform delivery through drip systems (Nutrigation™) without clogging emitters.
By Crop Type
By crop type, fruits and vegetables form the leading sub-segment, capturing about 38–40% of total demand as producers prioritize uniform nutrient availability, rapid absorption, and season-long crop quality enhancement. High-value horticultural crops rely heavily on liquid formulations due to their compatibility with greenhouse, soilless, and fertigation environments. Cereals follow closely, driven by large-scale adoption in maize and rice cultivation under precision farming setups. Oilseeds and ornamental horticultural plants show expanding uptake as growers seek improved flowering, oil content, and plant vigor. Customized nutrient blends continue to strengthen liquid fertilizer usage across diverse crop systems.
- For instance, ICL’s FertiFlow Tomato II 13-05-37+3CaO is a fully water-soluble NPK fertilizer formulated for tomato and pepper crops. The blend delivers high potassium for strong fruit development and is applied through fertigation for uniform nutrient uptake.
By End Use
In terms of end use, agriculture is the dominant sub-segment, contributing over 65% of total market consumption, supported by the need to enhance productivity across large-acreage field crops. Farmers increasingly integrate liquid fertilizers into fertigation, foliar application, and controlled irrigation systems to maximize nutrient efficiency. Horticulture including greenhouses and nurseries exhibits strong growth due to the high responsiveness of specialty crops to water-soluble nutrients. Turf and lawn care remains a stable niche, with adoption driven by uniform application needs in sports fields, golf courses, and commercial landscapes. Precision input delivery continues to lift adoption across all end-use segments.
Key Growth Drivers
Rising Adoption of Precision Agriculture and Controlled Irrigation Systems
Precision agriculture has become a central growth catalyst for the liquid fertilizers market as farmers seek to optimize nutrient use efficiency, elevate yields, and reduce environmental losses. Liquid fertilizers integrate seamlessly with advanced systems such as drip irrigation, micro-sprinklers, variable-rate applicators, and automated fertigation units. These technologies allow accurate nutrient timing, uniform distribution, and real-time adjustments based on soil moisture, crop stage, and sensor feedback. As governments expand subsidy programs for micro-irrigation and digital agriculture solutions, adoption accelerates across both developed and emerging economies. The demand for nutrient formulations compatible with GPS-guided equipment, sensor-driven irrigation controllers, and IoT-enabled fertigation platforms continues to strengthen. This alignment between technology and nutrient delivery firmly positions liquid fertilizers as a preferred input for modern, data-driven crop management systems worldwide.
- For instance, Netafim’s Fertikit™ 3G is an automated fertigation unit equipped with precise dosing channels delivering 50–1,000 L/hr per channel. The system supports accurate nutrient injection for large irrigation setups and is designed to handle broad production areas in commercial farms.
Increasing Demand for High-Value Horticultural and Greenhouse Crops
The rapid expansion of fruits, vegetables, ornamentals, and greenhouse-grown crops significantly boosts liquid fertilizer consumption. These high-value crops require precise nutrient management, rapid absorption, and consistent nutrient availability throughout short production cycles benefits that liquid formulations deliver more effectively than granular alternatives. Greenhouse farming, hydroponics, and protected cultivation have surged due to urbanization and year-round supply requirements, each relying heavily on water-soluble fertilizers. Growers increasingly adopt chelated micronutrients, specialty nutrient blends, and pH-stabilized liquid formulations to influence crop quality, fruit coloration, flowering intensity, and postharvest characteristics. As consumer demand shifts toward premium produce and export-oriented horticulture, farmers invest more in nutrient programs that enhance yield uniformity and aesthetic quality. This structural shift toward controlled-environment agriculture ensures sustained demand for liquid fertilizers.
- For instance, HaifaStim™ Vital is a biostimulant made from micronized soft-processed Ascophyllum nodosum seaweed, enriched with natural polyphenols. The extract supports plant vigor and stress tolerance through its physio-nutritional activity and is used across fertigation and foliar programs.
Growing Emphasis on Nutrient-Use Efficiency and Environmental Compliance
Regulatory pressure to reduce nutrient runoff, minimize soil degradation, and improve resource efficiency is pushing growers toward fertilizers with higher precision and lower environmental impact. Liquid fertilizers enable targeted application, reduce volatilization, and support controlled nutrient release, aligning well with tightening environmental standards. Growing concerns over groundwater contamination and emission reductions are prompting governments to promote efficient nutrient management systems. Liquid formulations also support integrated nutrient programs where balanced NPK ratios, micronutrients, and biological additives improve soil health and crop resilience. As sustainability becomes a core requirement in global agriculture, the market experiences rising adoption from large-scale farms, corporate plantations, and export-focused producers seeking compliance with eco-labels and environmental certifications. This shift toward efficiency-focused farming strengthens long-term demand for liquid fertilizers.
Key Trends & Opportunities
Expansion of Specialty Formulations and Bio-Enhanced Liquids
A major trend shaping the market is the rise of bio-enhanced, chelated, and crop-specific liquid formulations designed to address nutrient deficiencies and stress tolerance. Manufacturers are developing products with amino acids, humic substances, seaweed extracts, and microbial biostimulants that complement traditional NPK solutions. These advanced liquids improve nutrient uptake, root growth, and abiotic stress resistance key advantages in regions facing climate variability. Crop-specific blends for tomatoes, leafy vegetables, berries, and ornamentals create new revenue opportunities as specialty cultivation expands. Additionally, the demand for residue-free and organic-compatible inputs is encouraging companies to launch OMRI-listed and eco-certified formulations. This trend unlocks high-margin segments while supporting growers seeking enhanced crop quality and sustainable production.
- For instance, Haifa Group’s HaifaStim™ Vital is a soft-processed brown seaweed extract containing 20% water-soluble K₂O, along with 10% alginic acid, 4% mannitol, 3% amino acids and peptides, and 0.05% betaine. The biostimulant supports root activity, stress tolerance, and overall plant vigor in fertigation and foliar programs.
Rapid Growth of Hydroponics, Vertical Farming, and Controlled-Environment Agriculture (CEA)
Hydroponics and vertical farming represent high-potential opportunities for liquid fertilizer suppliers, as these production systems rely exclusively on water-soluble nutrients. The increasing adoption of urban farming, climate-resilient agriculture, and year-round production models drives demand for nutrient solutions tailored to soilless systems. Liquid fertilizers offer complete control over nutrient ratios, electrical conductivity, and pH levels parameters critical for maintaining crop uniformity in CEA operations. As global investments in indoor farming infrastructure expand, nutrient management companies are developing ready-to-use hydroponic mixes, multi-part nutrient solutions, and automated dosing systems. This shift toward technologically intensive farming environments creates recurring demand for precision-formulated liquid nutrients.
- For instance, General Hydroponics’ Flora Series® delivers 3-part liquid nutrients with specific guaranteed analysis percentages by weight, enabling customizable nutrient programs for crops like lettuce, herbs, and vine plants.
Digital Fertilization Platforms and Integration with Smart Irrigation Systems
The convergence of digital monitoring tools with fertigation systems is transforming nutrient management practices. Smart controllers, nutrient dosing units, mobile apps, and cloud-based monitoring platforms support real-time adjustments in nutrient concentration, irrigation flow, and scheduling. This integration enables growers to fine-tune programs based on crop stage, weather data, and soil analytics, strengthening the need for liquid fertilizers compatible with automation. Companies are introducing IoT-enabled fertigation units and sensor-driven nutrient recommendations, creating opportunities for subscription-based nutrient programs and data-driven advisory services. As digital agriculture adoption accelerates, suppliers offering synchronized hardware–software–fertilizer solutions are positioned to gain competitive advantage.
Key Challenges
High Storage, Handling, and Transportation Costs for Liquid Formulations
Despite their agronomic benefits, liquid fertilizers face cost and logistical challenges, particularly for large-scale distribution networks. Their higher density increases transportation expenses, while storage often requires corrosion-resistant tanks and specialized handling equipment. Temperature fluctuations can affect nutrient stability, creating additional requirements for controlled storage environments. In developing regions, limited access to adequate storage infrastructure restricts adoption compared with granulated alternatives. These cost burdens reduce price competitiveness in commodity crop segments where growers prioritize low-cost nutrient inputs. Manufacturers must invest in stabilization technologies, concentrated formulations, and improved supply chains to mitigate these constraints and expand market reach.
Limited Awareness and Technical Knowledge Among Small and Medium Farmers
A major challenge in emerging markets is the knowledge gap surrounding correct dilution ratios, application timing, and compatibility with irrigation equipment. Misapplication can lead to nutrient burn, poor root development, or reduced yield response, discouraging repeat usage. Small farmers often lack access to agronomic advisory services and therefore rely on traditional fertilizer practices. The absence of training on fertigation or foliar nutrient programs further limits adoption. Market penetration requires extensive extension services, demonstration trials, and retailer-level training to build confidence. Suppliers must actively provide technical support, digital advisory platforms, and localized crop guides to overcome barriers and drive adoption.
Regional Analysis
North America
North America holds around 28–30% of the global liquid fertilizers market, supported by strong adoption of precision farming, fertigation systems, and controlled-environment agriculture. Large-scale corn, soybean, and specialty crop producers in the U.S. and Canada increasingly rely on liquid formulations for uniform nutrient delivery and higher nutrient-use efficiency. Widespread deployment of drip irrigation, variable-rate applicators, and GPS-guided equipment continues to reinforce demand. Expansion of greenhouse vegetable production and turf management programs further boosts consumption. Favorable government incentives for micro-irrigation and sustainability initiatives enhance long-term market stability across the region.
Europe
Europe accounts for approximately 24–26% of market share, driven by regulatory pressure to reduce nutrient runoff and promote environmentally efficient fertilizer systems. Countries such as Spain, Italy, the Netherlands, and France have high adoption of fertigation and greenhouse cultivation, creating strong demand for precision-applied liquid nutrients. The region’s leadership in organic and specialty horticulture enhances the use of chelated and bio-based liquid formulations. Strict nitrate directives encourage growers to transition from granular fertilizers to more controlled nutrient delivery methods. Expansion of high-value vegetable, berry, and ornamentals production continues to support sustained growth across the European liquid fertilizers market.
Asia-Pacific
Asia-Pacific is the largest regional market, capturing around 34–36% of global demand, owing to the region’s large agricultural base, rising food security priorities, and increasing adoption of modern irrigation systems. Countries such as China, India, Japan, and Australia are rapidly shifting toward water-soluble nutrient programs to enhance yields in cereals, fruits, vegetables, and plantation crops. Government-backed micro-irrigation schemes, greenhouse expansions, and subsidies for fertigation equipment strongly influence uptake. Urbanization-driven growth in hydroponics and protected cultivation further accelerates demand. The region’s scalability, evolving farming practices, and policy-driven modernization ensure sustained market leadership.
Latin America
Latin America represents about 10–12% of the market, fueled by expanding cultivation of export-oriented fruits, vegetables, and plantation crops. Brazil, Mexico, Chile, and Argentina lead adoption as growers integrate fertigation and foliar nutrient programs to improve yield quality and meet export standards. Tropical horticulture, sugarcane, and coffee plantations increasingly favor liquid fertilizers for fast nutrient absorption and lower labor requirements. Strong penetration of drip irrigation systems in high-value horticulture accelerates growth. Despite infrastructure gaps in rural areas, rising investment in protected cultivation and specialty crop nutrition strengthens the region’s long-term demand.
Middle East & Africa (MEA)
The Middle East & Africa region holds roughly 8–10% market share, with rapid adoption in countries investing heavily in water-efficient agriculture. The Middle East demonstrates strong growth through hydroponics, greenhouse farming, and large-scale drip irrigation projects designed to optimize scarce water resources. Liquid fertilizers play a critical role in nutrient delivery for vegetables, dates, and greenhouse crops. In Africa, uptake is rising in South Africa, Kenya, and Morocco as farmers adopt modern irrigation and specialty crop cultivation. Ongoing government programs promoting food security and controlled-environment agriculture continue to expand the market’s footprint in the region.
Market Segmentations:
By Application
- Foliar Spray
- Fertigation (Irrigation)
- Soil Drench
- Seed Treatment
By Crop Type
- Cereals
- Oilseeds
- Fruits & Vegetables
- Horticultural Plants (flowers, ornamental plants, landscaping plants)
- Others
By End Use
- Agriculture
- Horticulture (greenhouses, nurseries)
- Turf & Lawn Care
By Geography
- North America
- Europe
- Germany
- France
- U.K.
- Italy
- Spain
- Rest of Europe
- Asia Pacific
- China
- Japan
- India
- South Korea
- South-east Asia
- Rest of Asia Pacific
- Latin America
- Brazil
- Argentina
- Rest of Latin America
- Middle East & Africa
- GCC Countries
- South Africa
- Rest of the Middle East and Africa
Competitive Landscape
The competitive landscape of the liquid fertilizers market is characterized by the presence of global nutrient manufacturers, regional formulation specialists, and companies focused on precision agriculture integration. Leading players such as Nutrien Ltd., Yara International, ICL Group, K+S Minerals and Agriculture, Haifa Group, and The Mosaic Company compete by expanding their portfolios of water-soluble NPK blends, chelated micronutrients, and specialty liquid formulations tailored to crop-specific requirements. Many companies are investing in high-purity raw materials, advanced chelation technologies, and compatibility-enhanced formulations for fertigation and foliar systems. Strategic partnerships with irrigation equipment manufacturers and digital agriculture platforms are increasing as suppliers aim to deliver combined nutrient-and-application solutions. Product innovation focuses on stability improvements, concentrated formulations, bio-enhanced additives, and solutions optimized for hydroponics and controlled-environment agriculture. Additionally, mergers, acquisitions, and regional expansion strategies continue to shape the competitive dynamics, enabling firms to strengthen distribution networks, manufacturing capabilities, and agronomic support services across high-growth markets.
Shape Your Report to Specific Countries or Regions & Enjoy 30% Off!
Key Player Analysis
- ICL
- IFFCO
- Compo Expert
- EuroChem Group
- Nutri-Tech Solutions Pty Ltd
- K+S Aktiengesellschaft
- FoxFarm Soil & Fertilizer Co
- Nutrien Ltd.
- BMS Micro-Nutrients NV
- CSBP
Recent Developments
- In December 2024, ICL launched liquid versions of its Nova® and Agrolution pHLow® water-soluble fertilizers, giving growers more flexible liquid nutrition options within its specialty portfolio.
- In March 2024, EuroChem announced that its new 70,000 t/year water-soluble fertilizer (WSF) plant at Nevinnomysskiy Azot in Russia producing potassium nitrate (NOP) for fertigation and solution use was scheduled to start production in Q3 2024.
- In February 2024, IFFCO inaugurated the world’s first Nano DAP (Liquid) manufacturing plant at Kalol, Gujarat. The facility produces 500 ml Nano DAP liquid bottles each designed to substitute a 45 kg bag of conventional DAP with an installed capacity of 200,000 bottles per day, strengthening IFFCO’s nano liquid fertilizer portfolio.
Report Coverage
The research report offers an in-depth analysis based on Application, Crop type, End-Use and Geography. It details leading market players, providing an overview of their business, product offerings, investments, revenue streams, and key applications. Additionally, the report includes insights into the competitive environment, SWOT analysis, current market trends, as well as the primary drivers and constraints. Furthermore, it discusses various factors that have driven market expansion in recent years. The report also explores market dynamics, regulatory scenarios, and technological advancements that are shaping the industry. It assesses the impact of external factors and global economic changes on market growth. Lastly, it provides strategic recommendations for new entrants and established companies to navigate the complexities of the market.
Future Outlook
- Liquid fertilizers will gain wider adoption as farmers accelerate the shift toward precision irrigation, automated fertigation, and sensor-driven nutrient programs.
- Demand will rise for specialty formulations, including chelated micronutrients, bio-stimulant–enriched blends, and crop-specific nutrient solutions.
- Controlled-environment agriculture, hydroponics, and vertical farming will significantly expand usage of water-soluble liquid nutrients.
- Digital nutrient management platforms will integrate more closely with irrigation controllers, enabling real-time dosing and predictive application models.
- Climate variability will increase reliance on liquid formulations that support rapid nutrient correction and stress tolerance.
- Manufacturers will invest in concentrated, stabilized, and compatibility-enhanced formulations to reduce transport and storage costs.
- Sustainability requirements will drive adoption of inputs that improve nutrient-use efficiency and reduce runoff.
- Regional players will strengthen production capacity to meet rising demand for localized blends and soil-specific formulations.
- Strategic partnerships between fertilizer companies and irrigation equipment manufacturers will increase.
- Market consolidation will continue as major players acquire niche innovators in specialty liquid nutrient technologies.


