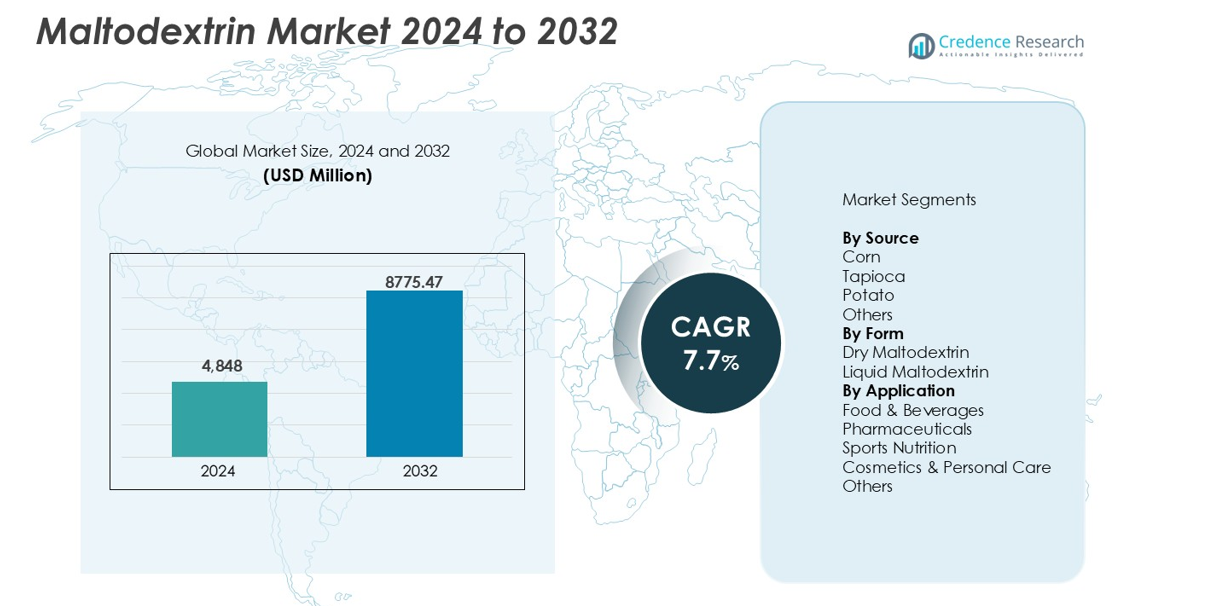
Home » Food & Beverage » Maltodextrin Market

Maltodextrin Market By Type (Regular Maltodextrin, Low-Dextrose Equivalent (DE) Maltodextrin); By DE (Dextrose Equivalent) Level (DE 10-15, DE 15-20, DE 20-25, DE 25-30, DE 30-40, DE 40-50, DE 50 and above); By Source (Corn-Based Maltodextrin, Wheat-Based Maltodextrin, Potato-Based Maltodextrin, Rice-Based Maltodextrin, Tapioca-Based Maltodextrin); By Application (Food and Beverages, Bakery and Confectionery, Beverages, Dairy Products, Snacks and Convenience Foods, Soups, Sauces, and Gravies, Pharmaceuticals, Personal Care and Cosmetics, Industrial Applications); By Function (Thickening Agent, Filler, Binder, Preservative, Texturizing Agent, Flavor Carrier); By End-Use Industry (Food and Beverage Industry, Pharmaceutical Industry, Cosmetic and Personal Care Industry, Industrial Sector); By Grade (Food Grade Maltodextrin, Pharmaceutical Grade Maltodextrin, Industrial Grade Maltodextrin); By Form (Powder Maltodextrin, Liquid Maltodextrin); By Certification (Organic Maltodextrin, Non-GMO Maltodextrin, Kosher and Halal-Certified Maltodextrin); By Distribution Channel (Direct Sales/Manufacturer Sales, Distributors, Online Retail); By Region – Growth, Share, Opportunities & Competitive Analysis, 2024 – 2032

Price: $4999

Published: | Report ID: 8000 | Report Format : PDF
REPORT ATTRIBUTE DETAILS
Historical Period 2019-2022
Base Year 2023
Forecast Period 2024-2032
Maltodextrin Market Size 2023 USD 3.6 Million
Maltodextrin Market, CAGR 5.00%
Maltodextrin Market Size 2032 USD 5.58 Million

Market Insights

  • The global demand for Maltodextrin was valued at USD 3.6 Million in 2023 and is expected to reach USD 5.58 Million in 2032, growing at a CAGR of 5.00% between 2024 and 2032.
  • Regular maltodextrin is more widely used and in greater demand than low-DE maltodextrin.
  • The DE 10-15 portion  is frequently the most prominent. And DE 30-40 is the fastest-growing category in the maltodextrin market.
  • In 2022, corn-based maltodextrin contributed around 53% of Maltodextrin Market revenue, and the wheat-based maltodextrin category is predicted to grow rapidly.
  • In 2022, food and beverages had the largest category share, while the personal care goods category is predicted to increase at the fastest rate.
  • The most generally used segment is as a thickening agent. Another important market sector is fillers.
  • The largest market share is held by the food and beverage industry, with the pharmaceutical industry also playing an important role.
  • Food Grade Maltodextrin is the fastest-growing segment. Pharmaceutical Grade Maltodextrin is also a popular market category.
  • The powder Maltodextrin segment led the market in 2022.
  • Non-GMO maltodextrin has the highest market demand.
  • Direct Sales/Manufacturer Sales has a significant share of the market, and another important market segment is internet retail.
  • In 2022, North America had the highest revenue share of 47%, while the Asia-Pacific Maltodextrin Market would have the second-largest market share.
  •  The increasing use of liquid glucose is expected to boost the expansion of the maltodextrin markets.
  • The high glucose levels and negative effects of dextrose and maltodextrin are limiting the expansion of the maltodextrin market.

Maltodextrin Market

Design Element 2

Access crucial information at unmatched prices!

Request your free sample report today & start making informed decisions powered by Credence Research!

Download Free Sample
CTA Design Element 3

Executive Summary

Market Definition

Maltodextrin Market refers to the global market for maltodextrin, a carbohydrate-based food ingredient. Maltodextrin, derived from starch, is widely used as a thickening, filler, and sweetener in a variety of food and beverage products. It’s commonly found in processed foods, sports drinks, newborn formula, and other food products. Maltodextrin adds texture, flavour, and extends the shelf life of food goods. The increased demand for convenience meals, as well as the necessity for functional ingredients in the food processing industry, are driving the maltodextrin market.

Market Overview

The global Maltodextrin Market has witnessed steady growth in recent years and is expected to grow at a CAGR of 5.00% between 2024 and 2032. The market was valued at USD 3.6 million in 2023 and is expected to reach USD 5.58 million in 2032.

Maltodextrin is a commonly used carbohydrate-based food ingredient with numerous applications in the food and beverage sector. The market for maltodextrin is being pushed by factors such as rising demand for convenience foods, the expanding food processing industry, and the requirement for functional additives. Maltodextrin is recognized for its ability to provide texture, flavour, and extend the shelf life of foods. It is frequently employed as a thickening, filler, or sweetener in a wide range of food and beverage products. The market for maltodextrin is predicted to see consistent expansion due to its various applications and the changing customer preferences for processed and convenience meals.

Segmentation by Type

  • Regular maltodextrin is more commonly used and in higher demand than low-DE maltodextrin. Regular maltodextrin has a wide range of applications in the food and beverage sector, including thickening, stabilizing, and bulking. It is also utilized in pharmaceuticals, personal care items, and a wide range of industrial uses.

Segmentation by DE (Dextrose Equivalent) Level

  • The DE 10-15 portion is often the most dominant. Its versatility and practical characteristics make it popular in a wide range of culinary and beverage applications. It is often employed as a bulking, stabilizing, or thickening agent.
  • DE 30-40 is the fastest-growing sector in the Maltodextrin Market. This segment is becoming increasingly popular because to its unique features and uses in industries such as sports nutrition, nutritional supplements, and pharmaceuticals.
  • The third most popular sector in the Maltodextrin Market is DE 20-25.

Segmentation by Source

  • In 2022, the corn based maltodextrincontributed approximately 53% of Maltodextrin Market revenue. This is mostly due to the widespread use of corn as a raw material for the manufacturing of maltodextrins, as corn is more readily available and produced in some of the primary producing markets.
  • The Wheat-Based Maltodextrin category is expected to expand significantly.

Segmentation by Application

  • In 2022, food & beverages accounted for the greatest category share. Maltodextrin is the most often used ingredient in food and beverage goods. Maltodextrin properties such as fat replacement, thickening, stabilizing, bulking, and anti-caking are employed in the formulation of food and beverage products.
  • The personal care products category is expected to grow at the quickest rate in terms of value and volume in the maltodextrin market.

Segmentation by Function

  • The most commonly utilized section is as a thickening agent. Maltodextrin is widely used to provide thickness and texture to a variety of food and beverage products. It improves the overall mouthfeel and uniformity of the product.
  • Another key market area is fillers. Maltodextrin is commonly used as a filler in processed foods and beverages. It adds mass and volume to the product, improving its texture and look.

Segmentation by End-Use Industry

  • The Food and Beverage Industry holds the biggest market share. Maltodextrin is commonly employed in this business as a thickening agent, stabilizer, and flavour carrier in a wide range of food and beverage items.
  • Another significant part is the pharmaceutical industry. Maltodextrin is used in pharmaceutical formulations as a filler, binder, and disintegrant. It improves the consistency and durability of oral solid dose forms.

Segmentation by Grade

  • The fastest-growing segment is Food Grade Maltodextrin. It is in high demand due to its diverse applications in the food and beverage sector as a thickening agent, stabilizer, and flavour carrier.
  • Another popular market category is Pharmaceutical Grade Maltodextrin.

Segmentation by Form

  • The powder Maltodextrin segment led the market in 2022 and is expected to be the fastest-growing sector throughout the forecast period (2022-2030). Spray dried maltodextrin powder is a form of maltodextrin powder that is produced using the spray drying technology, which protects heat-sensitive components from high temperatures during drying. Maltodextrin powders are more soluble in liquids and cold solutions.

Segmentation by Certification

  • Non-GMO maltodextrin is the segment with the highest market demand. Consumers increasingly prefer non-genetically modified organisms (GMO) ingredients in their food and beverage goods. Non-GMO Maltodextrin satisfies this criteria by originating from non-GMO crops.

Segmentation by Distribution Channel

  • Direct Sales/Manufacturer Sales holds a considerable share of the market. This refers to direct sales from manufacturers or suppliers to end customers. It enables direct communication, control over the sales process, and potentially improved profit margins.
  • Another important market area is online retail.

Segmentation by Region   

  • North America had the biggest revenue share of 47% in 2022.
  • The Asia-Pacific Maltodextrin Market will hold the second-largest market share in 2022
  • The rest of the world, including Latin America, the Middle East, and Africa, supplies the remaining demand for Maltodextrin.

Maltodextrin Market Research

The North American maltodextrin market had the biggest revenue share in 2022 and is predicted to grow at a CAGR of 4.25% over the forecast period. This is primarily due to customers’ increasing demand for sugar-free and low-calorie food products throughout time. Food and beverage manufacturers are also launching low-calorie products in response to regional government initiatives such as the sugar tax, the National Salt and Sugar Reduction Initiative, the National Strategy on Hunger, Nutrition, and Health, and so on, which are expected to fuel demand for the maltodextrin used in such products, thereby boosting market growth. According to a Cleveland Clinic page on gluten intolerance, around 6% of the US population tolerates gluten ingestion. Beyond Celiac, a celiac disease research and patient advocacy business, projected in its Annual Celiac Landscape study that approximately 3.2 million Americans suffer from gluten sensitivity and celiac disease.

In addition, The Asia-Pacific Maltodextrin Market will hold the second-largest market share in 2022. This is mostly due to rising disposable incomes and changing lifestyles in key nations such as China, India, Singapore, Australia, New Zealand, and Japan, among others, which are influencing demand for various food and beverage products and personal care items. Furthermore, altering consumer preferences for personal grooming and appearance are driving the growth of the cosmetics sector in the region, which is also having a beneficial impact on the maltodextrin market in Asia Pacific.

Key Highlights of the Report

The global Maltodextrin Market is segmented by Type, DE (Dextrose Equivalent) Level, Sources, Application, Function, End-Use Industry, Grade, Form, Certification, Distribution Channel and region. In 2022, the powder maltodextrin segment dominated the market in 2022, with Non-GMO maltodextrin having the largest market demand. In addition, the fastest-growing component is Food Grade Maltodextrin, and the DE 10-15 portion is frequently the most prominent. Also, the most generally used segment is as a thickening agent, and Direct Sales/Manufacturer Sales has a significant share of the market, with North America leading the market growth.

The market is being driven by a growing food and beverage industry, particularly in emerging regions, as well as increased consumer knowledge and preference for functional ingredients in food items. Furthermore, concerns about the health implications of excessive consumption of processed foods, fluctuating prices of raw materials used in maltodextrin production, and strict restrictions and quality standards set by regulatory bodies are the primary limitations of the market.

Nonetheless, The North American maltodextrin market had the most revenue share in 2022 and is expected to increase at a 4.25% CAGR during the forecast period. Furthermore, the Asia-Pacific Maltodextrin Market will have the second-largest market share in 2022.

What Are The Main Drivers Of The Global Maltodextrin Market?

One of the primary drivers of the Maltodextrin Market is the growing demand for convenience foods and processed food items. As people lead busier lives, there is an increasing preference for ready-to-eat or easy-to-prepare meals. Maltodextrin, which improves texture, flavour, and shelf life, is commonly used in processed food and beverage goods. Furthermore, the growing food and beverage industry, especially in emerging nations, is pushing up demand for maltodextrin as a useful component. Consumers are becoming increasingly aware of the substances in their food, and maltodextrin fits their needs for convenience and taste.

What Are The Major Challenges Faced By The Global Maltodextrin Market?

While the Maltodextrin Market has great potential, there are some limitations to consider. One constraint is worry about the health consequences of over consumption of processed foods. As more individuals become health-conscious, there is a growing awareness of the possible harmful consequences of eating too many processed foods. Furthermore, the shifting pricing of raw materials used in maltodextrin synthesis can present hurdles to businesses. The cost of components such as corn or wheat might change depending on weather conditions and supply-demand dynamics, affecting the profitability of maltodextrin production.

What Are The Growth Opportunities In The Global Maltodextrin Market?

Despite the challenges, the Maltodextrin Market offers various chances. One opportunity is the creation of clean label and natural maltodextrin alternatives. With the growing desire for healthy food options, people are seeking clean label items free of artificial ingredients. Developing natural maltodextrin variations can meet this expanding demand and give producers a competitive advantage. Another possibility is to expand into unexplored areas and locations with a rising food processing industry. As emerging economies undergo economic expansion and shifting consumer preferences, maltodextrin has a potential market in these regions.

Market Drivers

The global Maltodextrin Market is driven by several factors. The following are the key drivers of the global Maltodextrin Market:

Soaring Application Of Liquid Glucose

Liquid glucose, usually known as corn syrup, is used in the candy and baking industries as a sweetener. Liquid glucose helps to maintain softness in meals such as bread, puddings, and cakes. It is also used in cold beverage manufacturing. Liquid glucose is made from high-quality cornstarch. It appears as a thick transparent liquid. Liquid glucose is mostly used in commercially processed foods as thickeners, sweeteners, and to keep foods soft. It is widely used in hard candies, jam, jelly, caramel, toffee, and meat items. The widespread use of liquid glucose is thereby driving the expansion of the Maltodextrin Market during.

Market Restraints

The global Maltodextrin Market faces some challenges that may hinder its growth. These include the following:

High Glucose Levels And Side Effects Of Dextrose And Maltodextrin

Diabetes has been increasingly prevalent worldwide in recent decades. There is a definite correlation between excessive sugar consumption and the risk of diabetes. Obesity, which is recognized as the most significant risk factor for diabetes, is typically caused by consuming excessive sugar. Extended consumption of high-sugar diets exacerbates resistance to insulin, a pancreatic hormone that regulates blood glucose levels. Opposition to insulin causes an increase in blood sugar levels and significantly raises the risk of diabetes. Sugar/glucose intake in the human body must be watched and controlled in this day and age, as high glucose levels in the blood cause diseases like diabetes. If a diabetic consumes foods high in dextrose, their blood sugar levels will rapidly rise. Diabetic hyperglycemia, or high blood sugar, is a serious condition that can cause tissue damage, unconsciousness, and even death. Increased maltodextrin intake can cause unexpected blood sugar rises and increase the risk of developing type 2 diabetes.

Opportunities

The global Maltodextrin Market offers significant growth opportunities. These include the following:

Surging Applications Of Dextrose And Maltodextrin

Dextrose is a type of simple sugar found as starch in corn and in high fructose corn syrup. Because it is biochemically similar to glucose, it is occasionally used therapeutically to raise a person’s blood sugar levels when they are abnormally low. It is a basic sugar commonly used to sweeten packaged and processed goods. Dextrose is water-soluble and dissolves quickly. Dextrose injections are commonly used to rapidly boost a person’s blood sugar levels or to cure dehydration. It is used in baked products as a sweetener. Maltodextrin is a polysaccharide that is widely used as a nutritional supplement in food manufacturing. Maltodextrin can be used as a nutritional supplement in a wide range of industries, including food manufacturing, beverage production, medicines, cosmetics, and many others. Maltodextrin can be used as an emulsifier and texture stabilizer in food manufacturing. Maltodextrin is widely used as a thickening agent and emulsifier in beverages, as well as an adjuvant in pharmaceuticals. Maltodextrin serves as an emulsifier in cosmetics.

Competitive Landscape

Maltodextrin Market Report

Shape Your Report to Specific Countries or Regions & Enjoy 30% Off!

Key Players

The global Maltodextrin Market is highly competitive, with several key players. Some of the major players in the market and their market share are as follows:

  • Hunan Er-Kang Pharmaceutical Co., Ltd  (China)
  • American Key Food Products (U.S.)
  • Cargill, Incorporated (U.S.)
  • SPAC Starch Products (India) Ltd (India)
  • Ingredion Incorporated (U.S.)
  • Maltodextrin Starch Industry Co., Ltd (Thailand)
  • EIAMHENG MALTODEXTRIN STARCH INDUSTRY CO., LTD. (Thailand)
  • Psaltry International Limited (Nigeria)
  • Dadtco Philafrica B.V. (South Africa)
  • Maltodextrin Vietnam (Vietnam)
  • Lentus Foods & Agro Ltd (Nigeria)
  • kengSeng Group Of Company (China)

These organizations prioritize product innovation, Maltodextrin Centers expansion, and mergers and acquisitions to stay competitive.

The global Maltodextrin Market’s key players continually seek to stay ahead by offering new products and developments.

In October 2021, Cargill has created a new product, a maltodextrin alternative made from rice flour, to replace wheat and gluten in consumer diets.

In December 2019, Archer Daniels Midland Company has expanded its starch range into the Canadian market through a cooperation with IMCD (a leading distributor of specialized chemicals and food additives). In addition to a variety of additional ADM texture solutions, tapioca maltodextrin, tapioca starch, and corn starch will be accessible to Canadian buyers.

Summary of Key Findings

  • Surging uses of dextrose and maltodextrin are predicted to drive demand in the maltodextrin market.
  • Market segmented by Type, DE (Dextrose Equivalent) Level, Sources, Application, Function, End-Use Industry, Grade, Form, Certification, Distribution Channel and region.
  • In 2022, food and beverages accounted for the largest category share
  • Regular maltodextrin is more widely utilized and in demand than low-DE maltodextrin.
  • North America is leading market growth; the market is highly competitive with key players including Hunan Er-Kang Pharmaceutical Co., Ltd  (China), American Key Food Products (U.S.), Cargill, Incorporated (U.S.), SPAC Starch Products (India) Ltd (India) and Others.

Future Outlook

  • Increasing demand for convenience foods
  • Growing food processing industry
  • Rising consumer preferences for processed and convenience foods
  • Expanding applications in various food and beverage products
  • Continuous innovation and product development
  • Technological advancements in food processing
  • Growing awareness of functional ingredients
  • Emerging markets and untapped opportunities

How CXOs Can Benefit from the Credence Research Maltodextrin Market Report

The Credence Research Maltodextrin Market Report provides CXOs with a comprehensive overview of the market, including:

  • Market size and growth forecast:The report provides detailed estimates of the global Maltodextrin Market size, segmented by Type, DE (Dextrose Equivalent) Level, Sources, Application, Function, End-Use Industry, Grade, Form, Certification, Distribution Channel and region. It also includes forecasts for the market through 2032, based on key trends and drivers.
  • Market segmentation:The report segments the Maltodextrin Market by Type, DE (Dextrose Equivalent) Level, Sources, Application, Function, End-Use Industry, Grade, Form, Certification, Distribution Channel and region. This segmentation provides CXOs with a granular understanding of the market and the opportunities in each segment.
  • Competitive landscape:The report profiles the key players in the Maltodextrin Market and provides insights into their strategies, product offerings, and financial performance. This information can help CXOs to identify and assess their competition.
  • Key trends and drivers:The report identifies and analyzes the key trends and drivers that are shaping the Maltodextrin Market. This information can help CXOs to make informed decisions about their investments and strategies.

CXOs can use the insights from the Credence Research Maltodextrin Market Report to:

  • Identify growth opportunities:The report can help CXOs to identify new growth opportunities in the Maltodextrin Market. For example, this reports can provide insights into emerging markets, consumer trends, and product innovations that can help CXOs make informed decisions and capitalize on growth prospects.
  • Make informed investment decisions:The report can help CXOs to make informed investment decisions about Maltodextrin. For example, it provides valuable market insights, including market size, growth rate, competitive landscape, and key trends. This information can guide CXOs in evaluating investment opportunities and developing effective strategies for their businesses in the Maltodextrin market.
  • Develop competitive strategies:The report can help CXOs to develop competitive strategies for their Maltodextrin businesses. For example, it offers detailed analysis of market dynamics, including key players, market share, and competitive landscape. This information enables CXOs to identify their strengths, weaknesses, and opportunities, allowing them to develop effective strategies to stay ahead in the Maltodextrin market.
  • Track market developments:The report can help CXOs to track market developments and stay ahead of the curve. For example, the report provides insights into the latest trends and innovations in the Maltodextrin Market.

Overall, the Credence Research Maltodextrin Market Report is a valuable resource for CXOs who are looking to gain a deeper understanding of the market and identify opportunities for growth.

Segmentation

By Type:

  • Regular Maltodextrin
  • Low-Dextrose Equivalent (DE) Maltodextrin

By DE (Dextrose Equivalent) Level:

  • DE 10-15
  • DE 15-20
  • DE 20-25
  • DE 25-30
  • DE 30-40
  • DE 40-50
  • DE 50 and above

By Source:

  • Corn-Based Maltodextrin
  • Wheat-Based Maltodextrin
  • Potato-Based Maltodextrin
  • Rice-Based Maltodextrin
  • Tapioca-Based Maltodextrin

By Application:

  • Food and Beverages
  • Bakery and Confectionery
  • Beverages
  • Dairy Products
  • Snacks and Convenience Foods
  • Soups, Sauces, and Gravies
  • Pharmaceuticals
  • Personal Care and Cosmetics
  • Industrial Applications

By Function:

  • Thickening Agent
  • Filler
  • Binder
  • Preservative
  • Texturizing Agent
  • Flavor Carrier

By End-Use Industry:

  • Food and Beverage Industry
  • Pharmaceutical Industry
  • Cosmetic and Personal Care Industry
  • Industrial Sector

By Grade:

  • Food Grade Maltodextrin
  • Pharmaceutical Grade Maltodextrin
  • Industrial Grade Maltodextrin

By Form:

  • Powder Maltodextrin
  • Liquid Maltodextrin

By Certification:

  • Organic Maltodextrin
  • Non-GMO Maltodextrin
  • Kosher and Halal-Certified Maltodextrin

By Distribution Channel:

  • Direct Sales/Manufacturer Sales
  • Distributors
  • Online Retail
  • By Region
    • North America
      • The U.S.
      • Canada
      • Mexico
    • Europe
      • Germany
      • France
      • The U.K.
      • Italy
      • Spain
      • Rest of Europe
    • Asia Pacific
      • China
      • Japan
      • India
      • South Korea
      • South-east Asia
      • Rest of Asia Pacific
    • Latin America
      • Brazil
      • Argentina
      • Rest of Latin America
    • Middle East & Africa
      • GCC Countries
      • South Africa
      • Rest of Middle East and Africa
Table of Content
1. Preface
1.1. Report Description
1.1.1. Purpose of the Report
1.1.2. Target Audience
1.1.3. USP and Key Offerings
1.2. Research Scope
1.3. Market Introduction
2. Executive Summary
2.1. Market Snapshot: Global  Maltodextrin Market
2.1.1. Global  Maltodextrin Market, By Type
2.1.2. Global  Maltodextrin Market, By DE (Dextrose Equivalent) Level
2.1.3. Global  Maltodextrin Market, By Source
2.1.4. Global  Maltodextrin Market, By Application
2.1.5. Global  Maltodextrin Market, By Function
2.1.6. Global  Maltodextrin Market, By End-Use Industry
2.1.7. Global  Maltodextrin Market, By Grade
2.1.8. Global  Maltodextrin Market, By Form
2.1.9. Global  Maltodextrin Market, By Certification
2.1.10. Global  Maltodextrin Market, By Distribution Channel
2.1.11. Global  Maltodextrin Market, By Region
2.2. Insights from Primary Respondents
3. Market Dynamics & Factors Analysis
3.1. Introduction
3.1.1. Global  Maltodextrin Market Value, 2017-2030, (US$ Mn)
3.1.2. Y-o-Y Growth Trend Analysis
3.2. Market Dynamics
3.2.1. Maltodextrin Market Drivers
3.2.2. Maltodextrin Market Restraints
3.2.3. Maltodextrin Market Opportunities
3.2.4. Major  Maltodextrin Market Challenges
3.3. Growth and Development Patterns
3.4. Investment Feasibility Analysis
3.5. Market Opportunity Analysis
3.5.1. Type
3.5.2. DE (Dextrose Equivalent) Level
3.5.3. Source
3.5.4. Application
3.5.5. Function
3.5.6. End-Use Industry
3.5.7. Grade
3.5.8. Form
3.5.9. Certification
3.5.10. Distribution Channel
3.5.11. Geography
4. Market Competitive Landscape Analysis
4.1. Company Market Share Analysis, 2022
4.1.1. Global  Maltodextrin Market: Company Market Share, Value 2022
4.1.2. Global  Maltodextrin Market: Top 6 Company Market Share, Value 2022
4.1.3. Global  Maltodextrin Market: Top 3 Company Market Share, Value 2022
4.2. Global  Maltodextrin Market: Company Revenue Share Analysis, 2022
4.3. Company Assessment Metrics, 2022
4.3.1. Stars
4.3.2. Emerging Leaders
4.3.3. Pervasive Players
4.3.4. Participants
4.4. Startups/ SMEs Assessment Metrics, 2022
4.4.1. Progressive Companies
4.4.2. Responsive Companies
4.4.3. Dynamic Companies
4.4.4. Starting Blocks
4.5. Strategic Development
4.5.1. Acquisition and Mergers
4.5.2. New Type Launch
4.5.3. Regional Expansion
4.5.4. Partnerships
4.6. Key Player Type Matrix
4.7. Potential for New Players in the Global  Maltodextrin Market
5. Premium Insights
5.1. STAR (Situation, Task, Action, Results) Analysis
5.2. Porter’s Five Forces Analysis
5.2.1. Threat of New Entrants
5.2.2. Bargaining Power of Buyers/Consumers
5.2.3. Bargaining Power of Suppliers
5.2.4. Threat of Substitute Types
5.2.5. Intensity of Competitive Rivalry
5.3. PESTEL Analysis
5.3.1. Political Factors
5.3.2. Economic Factors
5.3.3. Social Factors
5.3.4. Technological Factors
5.3.5. Environmental Factors
5.3.6. Legal Factors
5.4. Key Market Trends
5.4.1. Demand Side Trends
5.4.2. Supply Side Trends
5.5. Value Chain Analysis
5.6. Technology Analysis
5.6.1. Plasma Protein Binding Studies in the global market
5.6.2. Patent Analysis
5.6.3. Emerging technologies and their potential disruption to the market
5.7. Consumer Behaviour Analysis
5.7.1. Consumer Preferences and Expectations
5.7.2. Factors Influencing Consumer Buying Decisions
5.7.2.1. North America
5.7.2.2. Europe
5.7.2.3. Asia Pacific
5.7.2.4. Latin America
5.7.2.5. Middle East and Africa
5.7.3. Consumer Pain Points
5.8. Analysis and Recommendations
5.9. Adjacent Market Analysis
6. Market Positioning of Key Players, 2022
6.1. Company market share of key players, 2022
6.2. Competitive Benchmarking
6.3. Market Positioning of Key Vendors
6.4. Geographical Presence Analysis
6.5. Major Strategies Adopted by Key Players
6.5.1. Key Strategies Analysis
6.5.2. Mergers and Acquisitions
6.5.3. Partnerships
6.5.4. Type Launch
6.5.5. Geographical Expansion
6.5.6. Autoimmune Diseases
7. Impact Analysis of COVID 19 and Russia – Ukraine War on  Maltodextrin Market
7.1. Ukraine-Russia War Impact
7.1.1. Uncertainty and Economic Instability
7.1.2. Supply chain disruptions
7.1.3. Regional market shifts
7.1.4. Shift in government priorities
7.2. COVID-19 Impact Analysis
7.2.1. Supply Chain Disruptions
7.2.2. Demand Fluctuations
7.2.3. Shift in Type Mix
7.2.4. Reduced Plasma Protein Binding Studies Activity
7.2.5. Regional Impact Analysis
7.2.5.1. North America
7.2.5.2. Europe
7.2.5.3. Asia Pacific
7.2.5.4. Latin America
7.2.5.5. Middle East and Africa
8. Global  Maltodextrin Market, By Type
8.1. Global  Maltodextrin Market Overview, By Type
8.1.1. Global  Maltodextrin Market Revenue Share, By Type, 2022 Vs 2030 (in %)
8.2. Regular Maltodextrin
8.2.1. Global  Maltodextrin Market, By REGULAR MALTODEXTRIN, By Region, 2017-2030 (US$ Mn)
8.2.2. Market Dynamics for REGULAR MALTODEXTRIN
8.2.2.1. Drivers
8.2.2.2. Restraints
8.2.2.3. Opportunities
8.2.2.4. Trends
8.3. Low-Dextrose Equivalent (DE) Maltodextrin
8.3.1. Global  Maltodextrin Market, By Low-Dextrose Equivalent (DE) Maltodextrin, By Region, 2017-2030 (US$ Mn)
8.3.2. Market Dynamics for Low-Dextrose Equivalent (DE) Maltodextrin
8.3.2.1. Drivers
8.3.2.2. Restraints
8.3.2.3. Opportunities
8.3.2.4. Trends
9. Global  Maltodextrin Market, By DE (Dextrose Equivalent) Level
9.1. Global  Maltodextrin Market Overview, By DE (Dextrose Equivalent) Level
9.1.1. Global  Maltodextrin Market Revenue Share, By DE (Dextrose Equivalent) Level, 2022 Vs 2030 (in %)
9.2. DE 10-15
9.2.1. Global  Maltodextrin Market, By DE 10-15, By Region, 2017-2030 (US$ Mn)
9.2.2. Market Dynamics for DE 10-15
9.2.2.1. Drivers
9.2.2.2. Restraints
9.2.2.3. Opportunities
9.2.2.4. Trends
9.3. DE 15-20
9.3.1. Global  Maltodextrin Market, By DE 15-20, By Region, 2017-2030 (US$ Mn)
9.3.2. Market Dynamics for DE 15-20
9.3.2.1. Drivers
9.3.2.2. Restraints
9.3.2.3. Opportunities
9.3.2.4. Trends
9.4. DE 20-25
9.4.1. Global  Maltodextrin Market, By DE 20-25, By Region, 2017-2030 (US$ Mn)
9.4.2. Market Dynamics for DE 20-25
9.4.2.1. Drivers
9.4.2.2. Restraints
9.4.2.3. Opportunities
9.4.2.4. Trends
9.5. DE 25-30
9.5.1. Global  Maltodextrin Market, By DE 25-30 By Region, 2017-2030 (US$ Mn)
9.5.2. Market Dynamics for DE 25-30
9.5.2.1. Drivers
9.5.2.2. Restraints
9.5.2.3. Opportunities
9.5.2.4. Trends
9.6. DE 30-40
9.6.1. Global  Maltodextrin Market, By DE 30-40, By Region, 2017-2030 (US$ Mn)
9.6.2. Market Dynamics for DE 30-40
9.6.2.1. Drivers
9.6.2.2. Restraints
9.6.2.3. Opportunities
9.6.2.4. Trends
9.7. DE 40-50
9.7.1. Global  Maltodextrin Market, By DE 40-50, By Region, 2017-2030 (US$ Mn)
9.7.2. Market Dynamics for DE 40-50
9.7.2.1. Drivers
9.7.2.2. Restraints
9.7.2.3. Opportunities
9.7.2.4. Trends
9.8. DE 50 and above
9.8.1. Global  Maltodextrin Market, By DE 50 and above, By Region, 2017-2030 (US$ Mn)
9.8.2. Market Dynamics for DE 50 and above
9.8.2.1. Drivers
9.8.2.2. Restraints
9.8.2.3. Opportunities
9.8.2.4. Trends
10. Global  Maltodextrin Market, By Source
10.1. Global  Maltodextrin Market Overview, By Source
10.1.1. Global  Maltodextrin Market Revenue Share, By Source, 2022 Vs 2030 (in %)
10.2. Corn-Based Maltodextrin
10.2.1. Global  Maltodextrin Market, By Corn-Based Maltodextrin, By Region, 2017-2030 (US$ Mn)
10.2.2. Market Dynamics for Corn-Based Maltodextrin
10.2.2.1. Drivers
10.2.2.2. Restraints
10.2.2.3. Opportunities
10.2.2.4. Trends
10.3. Wheat-Based Maltodextrin
10.3.1. Global  Maltodextrin Market, By Wheat-Based Maltodextrin, By Region, 2017-2030 (US$ Mn)
10.3.2. Market Dynamics for Wheat-Based Maltodextrin
10.3.2.1. Drivers
10.3.2.2. Restraints
10.3.2.3. Opportunities
10.3.2.4. Trends
10.4. Potato-Based Maltodextrin
10.4.1. Global  Maltodextrin Market, By Potato-Based Maltodextrin, By Region, 2017-2030 (US$ Mn)
10.4.2. Market Dynamics for Potato-Based Maltodextrin
10.4.2.1. Drivers
10.4.2.2. Restraints
10.4.2.3. Opportunities
10.4.2.4. Trends
10.5. Rice-Based Maltodextrin
10.5.1. Global  Maltodextrin Market, By Rice-Based Maltodextrin, By Region, 2017-2030 (US$ Mn)
10.5.2. Market Dynamics for Rice-Based Maltodextrin
10.5.2.1. Drivers
10.5.2.2. Restraints
10.5.2.3. Opportunities
10.5.2.4. Trends
10.6. Tapioca-Based Maltodextrin
10.6.1. Global  Maltodextrin Market, By Tapioca-Based Maltodextrin, By Region, 2017-2030 (US$ Mn)
10.6.2. Market Dynamics for Tapioca-Based Maltodextrin
10.6.2.1. Drivers
10.6.2.2. Restraints
10.6.2.3. Opportunities
10.6.2.4. Trends
11. Global  Maltodextrin Market, By Application
11.1. Global  Maltodextrin Market Overview, by Application
11.1.1. Global  Maltodextrin Market Revenue Share, By Application, 2022 Vs 2030 (in %)
11.2. Food and Beverages
11.2.1. Global  Maltodextrin Market, By Food and Beverages, By Region, 2017-2030 (US$ Mn)
11.2.2. Market Dynamics for Food and Beverages
11.2.2.1. Drivers
11.2.2.2. Restraints
11.2.2.3. Opportunities
11.2.2.4. Trends
11.3. Bakery and Confectionery
11.3.1. Global  Maltodextrin Market, By Bakery and Confectionery, By Region, 2017-2030 (US$ Mn)
11.3.2. Market Dynamics for Bakery and Confectionery
11.3.2.1. Drivers
11.3.2.2. Restraints
11.3.2.3. Opportunities
11.3.2.4. Trends
11.4. Beverages
11.4.1. Global  Maltodextrin Market, By Beverages, By Region, 2017-2030 (US$ Mn)
11.4.2. Market Dynamics for Beverages
11.4.2.1. Drivers
11.4.2.2. Restraints
11.4.2.3. Opportunities
11.4.2.4. Trends
11.5. Dairy Products
11.5.1. Global  Maltodextrin Market, By Dairy Products, By Region, 2017-2030 (US$ Mn)
11.5.2. Market Dynamics for Dairy Products
11.5.2.1. Drivers
11.5.2.2. Restraints
11.5.2.3. Opportunities
11.5.2.4. Trends
11.6. Snacks and Convenience Foods
11.6.1. Global  Maltodextrin Market, By Snacks and Convenience Foods, By Region, 2017-2030 (US$ Mn)
11.6.2. Market Dynamics for Snacks and Convenience Foods
11.6.2.1. Drivers
11.6.2.2. Restraints
11.6.2.3. Opportunities
11.6.2.4. Trends
11.7. Soups, Sauces, and Gravies s
11.7.1. Global  Maltodextrin Market, By Soups, Sauces, and Gravies, By Region, 2017-2030 (US$ Mn)
11.7.2. Market Dynamics for Soups, Sauces, and Gravies
11.7.2.1. Drivers
11.7.2.2. Restraints
11.7.2.3. Opportunities
11.7.2.4. Trends
11.8. Pharmaceuticals
11.8.1. Global  Maltodextrin Market, By Pharmaceuticals, By Region, 2017-2030 (US$ Mn)
11.8.2. Market Dynamics for Pharmaceuticals
11.8.2.1. Drivers
11.8.2.2. Restraints
11.8.2.3. Opportunities
11.8.2.4. Trends
11.9. Personal Care and Cosmetics
11.9.1. Global  Maltodextrin Market, By Personal Care and Cosmetics, By Region, 2017-2030 (US$ Mn)
11.9.2. Market Dynamics for Personal Care and Cosmetics
11.9.2.1. Drivers
11.9.2.2. Restraints
11.9.2.3. Opportunities
11.9.2.4. Trends
11.10. Industrial Applications
11.10.1. Global  Maltodextrin Market, By Industrial Applications, By Region, 2017-2030 (US$ Mn)
11.10.2. Market Dynamics for Industrial Applications
11.10.2.1. Drivers
11.10.2.2. Restraints
11.10.2.3. Opportunities
11.10.2.4. Trends
12. Global  Maltodextrin Market, By Function
12.1. Global  Maltodextrin Market Overview, By Function
12.1.1. Global  Maltodextrin Market Revenue Share, By Function, 2022 Vs 2030 (in %)
12.2. Thickening Agent
12.2.1. Global  Maltodextrin Market, By Thickening Agent, By Region, 2017-2030 (US$ Mn)
12.2.2. Market Dynamics for Thickening Agent
12.2.2.1. Drivers
12.2.2.2. Restraints
12.2.2.3. Opportunities
12.2.2.4. Trends
12.3. Filler
12.3.1. Global  Maltodextrin Market, By Filler, By Region, 2017-2030 (US$ Mn)
12.3.2. Market Dynamics for Filler
12.3.2.1. Drivers
12.3.2.2. Restraints
12.3.2.3. Opportunities
12.3.2.4. Trends
12.4. Binder
12.4.1. Global  Maltodextrin Market, By Binder, By Region, 2017-2030 (US$ Mn)
12.4.2. Market Dynamics for Binder
12.4.2.1. Drivers
12.4.2.2. Restraints
12.4.2.3. Opportunities
12.4.2.4. Trends
12.5. Preservative
12.5.1. Global  Maltodextrin Market, By Preservative, By Region, 2017-2030 (US$ Mn)
12.5.2. Market Dynamics for Preservative
12.5.2.1. Drivers
12.5.2.2. Restraints
12.5.2.3. Opportunities
12.5.2.4. Trends
12.6. Texturizing Agent
12.6.1. Global  Maltodextrin Market, By Texturizing Agent, By Region, 2017-2030 (US$ Mn)
12.6.2. Market Dynamics for Texturizing Agent
12.6.2.1. Drivers
12.6.2.2. Restraints
12.6.2.3. Opportunities
12.6.2.4. Trends
12.7. Flavor Carrier
12.7.1. Global  Maltodextrin Market, By Flavor Carrier, By Region, 2017-2030 (US$ Mn)
12.7.2. Market Dynamics for Flavor Carrier
12.7.2.1. Drivers
12.7.2.2. Restraints
12.7.2.3. Opportunities
12.7.2.4. Trends
13. Global  Maltodextrin Market, By End-Use Industry
13.1. Global  Maltodextrin Market Overview, By End-Use Industry
13.1.1. Global  Maltodextrin Market Revenue Share, By End-Use Industry, 2022 Vs 2030 (in %)
13.2. Food and Beverage Industry
13.2.1. Global  Maltodextrin Market, By Food and Beverage Industry, By Region, 2017-2030 (US$ Mn)
13.2.2. Market Dynamics for Food and Beverage Industry
13.2.2.1. Drivers
13.2.2.2. Restraints
13.2.2.3. Opportunities
13.2.2.4. Trends
13.3. Pharmaceutical Industry
13.3.1. Global  Maltodextrin Market, By Pharmaceutical Industry, By Region, 2017-2030 (US$ Mn)
13.3.2. Market Dynamics for Pharmaceutical Industry
13.3.2.1. Drivers
13.3.2.2. Restraints
13.3.2.3. Opportunities
13.3.2.4. Trends
13.4. Cosmetic and Personal Care Industry
13.4.1. Global  Maltodextrin Market, By Cosmetic and Personal Care Industry, By Region, 2017-2030 (US$ Mn)
13.4.2. Market Dynamics for Cosmetic and Personal Care Industry
13.4.2.1. Drivers
13.4.2.2. Restraints
13.4.2.3. Opportunities
13.4.2.4. Trends
13.5. Industrial Sector
13.5.1. Global  Maltodextrin Market, By Industrial Sector, By Region, 2017-2030 (US$ Mn)
13.5.2. Market Dynamics for Industrial Sector
13.5.2.1. Drivers
13.5.2.2. Restraints
13.5.2.3. Opportunities
13.5.2.4. Trends
14. Global  Maltodextrin Market, By Grade
14.1. Global  Maltodextrin Market Overview, By Grade
14.1.1. Global  Maltodextrin Market Revenue Share, By Grade, 2022 Vs 2030 (in %)
14.2. Food Grade Maltodextrin
14.2.1. Global  Maltodextrin Market, By Food Grade Maltodextrin, By Region, 2017-2030 (US$ Mn)
14.2.2. Market Dynamics for Food Grade Maltodextrin
14.2.2.1. Drivers
14.2.2.2. Restraints
14.2.2.3. Opportunities
14.2.2.4. Trends
14.3. Pharmaceutical Grade Maltodextrin
14.3.1. Global  Maltodextrin Market, By Pharmaceutical Grade Maltodextrin, By Region, 2017-2030 (US$ Mn)
14.3.2. Market Dynamics for Pharmaceutical Grade Maltodextrin
14.3.2.1. Drivers
14.3.2.2. Restraints
14.3.2.3. Opportunities
14.3.2.4. Trends
14.4. Industrial Grade Maltodextrin
14.4.1. Global  Maltodextrin Market, By Industrial Grade Maltodextrin, By Region, 2017-2030 (US$ Mn)
14.4.2. Market Dynamics for Industrial Grade Maltodextrin
14.4.2.1. Drivers
14.4.2.2. Restraints
14.4.2.3. Opportunities
14.4.2.4. Trends
15. Global  Maltodextrin Market, By Form
15.1. Global  Maltodextrin Market Overview, By Form
15.1.1. Global  Maltodextrin Market Revenue Share, By Form, 2022 Vs 2030 (in %)
15.2. Powder Maltodextrin
15.2.1. Global  Maltodextrin Market, By Powder Maltodextrin, By Region, 2017-2030 (US$ Mn)
15.2.2. Market Dynamics for Powder Maltodextrin
15.2.2.1. Drivers
15.2.2.2. Restraints
15.2.2.3. Opportunities
15.2.2.4. Trends
15.3. Liquid Maltodextrin
15.3.1. Global  Maltodextrin Market, By Liquid Maltodextrin, By Region, 2017-2030 (US$ Mn)
15.3.2. Market Dynamics for Liquid Maltodextrin
15.3.2.1. Drivers
15.3.2.2. Restraints
15.3.2.3. Opportunities
15.3.2.4. Trends
16. Global  Maltodextrin Market, By Certification
16.1. Global  Maltodextrin Market Overview, By Certification
16.1.1. Global  Maltodextrin Market Revenue Share, By Certification, 2022 Vs 2030 (in %)
16.2. Organic Maltodextrin
16.2.1. Global  Maltodextrin Market, By Organic Maltodextrin, By Region, 2017-2030 (US$ Mn)
16.2.2. Market Dynamics for Organic Maltodextrin
16.2.2.1. Drivers
16.2.2.2. Restraints
16.2.2.3. Opportunities
16.2.2.4. Trends
16.3. Non-GMO Maltodextrin
16.3.1. Global  Maltodextrin Market, By Non-GMO Maltodextrin, By Region, 2017-2030 (US$ Mn)
16.3.2. Market Dynamics for Non-GMO Maltodextrin
16.3.2.1. Drivers
16.3.2.2. Restraints
16.3.2.3. Opportunities
16.3.2.4. Trends
16.4. Kosher and Halal-Certified Maltodextrin
16.4.1. Global  Maltodextrin Market, By Kosher and Halal-Certified Maltodextrin, By Region, 2017-2030 (US$ Mn)
16.4.2. Market Dynamics for Kosher and Halal-Certified Maltodextrin
16.4.2.1. Drivers
16.4.2.2. Restraints
16.4.2.3. Opportunities
16.4.2.4. Trends
17. Global  Maltodextrin Market, By Distribution Channel
17.1. Global  Maltodextrin Market Overview, By Distribution Channel
17.1.1. Global  Maltodextrin Market Revenue Share, By Distribution Channel, 2022 Vs 2030 (in %)
17.2. Direct Sales/Manufacturer Sales
17.2.1. Global  Maltodextrin Market, By Direct Sales/Manufacturer Sales, By Region, 2017-2030 (US$ Mn)
17.2.2. Market Dynamics for Direct Sales/Manufacturer Sales
17.2.2.1. Drivers
17.2.2.2. Restraints
17.2.2.3. Opportunities
17.2.2.4. Trends
17.3. Distributors
17.3.1. Global  Maltodextrin Market, By Distributors, By Region, 2017-2030 (US$ Mn)
17.3.2. Market Dynamics for Distributors
17.3.2.1. Drivers
17.3.2.2. Restraints
17.3.2.3. Opportunities
17.3.2.4. Trends
17.4. Online Retail
17.4.1. Global  Maltodextrin Market, By Online Retail, By Region, 2017-2030 (US$ Mn)
17.4.2. Market Dynamics for Online Retail
17.4.2.1. Drivers
17.4.2.2. Restraints
17.4.2.3. Opportunities
17.4.2.4. Trends
18. Global  Maltodextrin Market, By Region
18.1. Global  Maltodextrin Market Overview, by Region
18.1.1. Global  Maltodextrin Market, By Region, 2022 vs 2030 (in%)
18.2. Type
18.2.1. Global  Maltodextrin Market, By Type, 2017-2030 (US$ Mn)
18.3. DE (Dextrose Equivalent) Level
18.3.1. Global  Maltodextrin Market, By DE (Dextrose Equivalent) Level, 2017-2030 (US$ Mn)
18.4. Source
18.4.1. Global  Maltodextrin Market, By Source, 2017-2030 (US$ Mn)
18.5. Application
18.5.1. Global  Maltodextrin Market, By Application, 2017-2030 (US$ Mn)
18.6. Function
18.6.1. Global  Maltodextrin Market, By Function, 2017-2030 (US$ Mn)
18.7. End-Use Industry
18.7.1. Global  Maltodextrin Market, By End-Use Industry, 2017-2030 (US$ Mn)
18.8. Grade
18.8.1. Global  Maltodextrin Market, By Grade, 2017-2030 (US$ Mn)
18.9. Form
18.9.1. Global  Maltodextrin Market, By Form, 2017-2030 (US$ Mn)
18.10. Certification
18.10.1. Global  Maltodextrin Market, By Certification, 2017-2030 (US$ Mn)
18.11. Distribution Channel
18.11.1. Global  Maltodextrin Market, By Distribution Channel, 2017-2030 (US$ Mn)
19. North America  Maltodextrin Market Analysis
19.1. Overview
19.1.1. Market Dynamics for North America
19.1.1.1. Drivers
19.1.1.2. Restraints
19.1.1.3. Opportunities
19.1.1.4. Trends
19.2. North America  Maltodextrin Market, By Type, 2017-2030(US$ Mn)
19.2.1. Overview
19.2.2. SRC Analysis
19.3. North America  Maltodextrin Market, By DE (Dextrose Equivalent) Level, 2017-2030(US$ Mn)
19.3.1. Overview
19.3.2. SRC Analysis
19.4. North America  Maltodextrin Market, By Source, 2017-2030(US$ Mn)
19.4.1. Overview
19.4.2. SRC Analysis
19.5. North America  Maltodextrin Market, By Application, 2017-2030(US$ Mn)
19.5.1. Overview
19.5.2. SRC Analysis
19.6. North America  Maltodextrin Market, By Function, 2017-2030(US$ Mn)
19.6.1. Overview
19.6.2. SRC Analysis
19.7. North America  Maltodextrin Market, By End-Use Industry, 2017-2030(US$ Mn)
19.7.1. Overview
19.7.2. SRC Analysis
19.8. North America  Maltodextrin Market, By Grade, 2017-2030(US$ Mn)
19.8.1. Overview
19.8.2. SRC Analysis
19.9. North America  Maltodextrin Market, By Form, 2017-2030(US$ Mn)
19.9.1. Overview
19.9.2. SRC Analysis
19.10. North America  Maltodextrin Market, By Certification, 2017-2030(US$ Mn)
19.10.1. Overview
19.10.2. SRC Analysis
19.11. North America  Maltodextrin Market, By Distribution Channel, 2017-2030(US$ Mn)
19.11.1. Overview
19.11.2. SRC Analysis
19.12. North America  Maltodextrin Market, by Country, 2017-2030(US$ Mn)
19.12.1. North America  Maltodextrin Market, by Country, 2022 Vs 2030 (in%)
19.12.2. U.S.
19.12.3. Canada
19.12.4. Mexico
20. Europe  Maltodextrin Market Analysis
20.1. Overview
20.1.1. Market Dynamics for North America
20.1.1.1. Drivers
20.1.1.2. Restraints
20.1.1.3. Opportunities
20.1.1.4. Trends
20.2. Europe  Maltodextrin Market, By Type, 2017-2030(US$ Mn)
20.2.1. Overview
20.2.2. SRC Analysis
20.3. Europe  Maltodextrin Market, By DE (Dextrose Equivalent) Level, 2017-2030(US$ Mn)
20.3.1. Overview
20.3.2. SRC Analysis
20.4. Europe  Maltodextrin Market, By Source, 2017-2030(US$ Mn)
20.4.1. Overview
20.4.2. SRC Analysis
20.5. Europe  Maltodextrin Market, By Application, 2017-2030(US$ Mn)
20.5.1. Overview
20.5.2. SRC Analysis
20.6. Europe  Maltodextrin Market, By Function, 2017-2030(US$ Mn)
20.6.1. Overview
20.6.2. SRC Analysis
20.7. Europe  Maltodextrin Market, By End-Use Industry, 2017-2030(US$ Mn)
20.7.1. Overview
20.7.2. SRC Analysis
20.8. Europe  Maltodextrin Market, By Grade, 2017-2030(US$ Mn)
20.8.1. Overview
20.8.2. SRC Analysis
20.9. Europe  Maltodextrin Market, By Form, 2017-2030(US$ Mn)
20.9.1. Overview
20.9.2. SRC Analysis
20.10. Europe  Maltodextrin Market, By Certification, 2017-2030(US$ Mn)
20.10.1. Overview
20.10.2. SRC Analysis
20.11. Europe  Maltodextrin Market, By Distribution Channel, 2017-2030(US$ Mn)
20.11.1. Overview
20.11.2. SRC Analysis
20.12. Europe  Maltodextrin Market, by Country, 2017-2030 (US$ Mn)
20.12.1. Europe  Maltodextrin Market, by Country, 2022 Vs 2030 (in%)
20.12.2. UK
20.12.3. France
20.12.4. Germany
20.12.5. Italy
20.12.6. Spain
20.12.7. Benelux
20.12.8. Russia
20.12.9. Rest of Europe
21. Asia Pacific  Maltodextrin Market Analysis
21.1. Overview
21.1.1. Market Dynamics for North America
21.1.1.1. Drivers
21.1.1.2. Restraints
21.1.1.3. Opportunities
21.1.1.4. Trends
21.2. Asia Pacific  Maltodextrin Market, By Type, 2017-2030(US$ Mn)
21.2.1. Overview
21.2.2. SRC Analysis
21.3. Asia Pacific  Maltodextrin Market, By DE (Dextrose Equivalent) Level, 2017-2030(US$ Mn)
21.3.1. Overview
21.3.2. SRC Analysis
21.4. Asia Pacific  Maltodextrin Market, By Source, 2017-2030(US$ Mn)
21.4.1. Overview
21.4.2. SRC Analysis
21.5. Asia Pacific  Maltodextrin Market, By Application, 2017-2030(US$ Mn)
21.5.1. Overview
21.5.2. SRC Analysis
21.6. Asia Pacific  Maltodextrin Market, By Function, 2017-2030(US$ Mn)
21.6.1. Overview
21.6.2. SRC Analysis
21.7. Asia Pacific  Maltodextrin Market, By End-Use Industry, 2017-2030(US$ Mn)
21.7.1. Overview
21.7.2. SRC Analysis
21.8. Asia Pacific  Maltodextrin Market, By Grade, 2017-2030(US$ Mn)
21.8.1. Overview
21.8.2. SRC Analysis
21.9. Asia Pacific  Maltodextrin Market, By Form, 2017-2030(US$ Mn)
21.9.1. Overview
21.9.2. SRC Analysis
21.10. Asia Pacific  Maltodextrin Market, By Certification, 2017-2030(US$ Mn)
21.10.1. Overview
21.10.2. SRC Analysis
21.11. Asia Pacific  Maltodextrin Market, By Distribution Channel, 2017-2030(US$ Mn)
21.11.1. Overview
21.11.2. SRC Analysis
21.12. Asia Pacific  Maltodextrin Market, by Country, 2017-2030 (US$ Mn)
21.12.1. Asia Pacific  Maltodextrin Market, by Country, 2022 Vs 2030 (in%)
21.12.2. China
21.12.3. Japan
21.12.4. India
21.12.5. South Korea
21.12.6. South East Asia
21.12.7. Rest of Asia Pacific
22. Latin America  Maltodextrin Market Analysis
22.1. Overview
22.1.1. Market Dynamics for North America
22.1.1.1. Drivers
22.1.1.2. Restraints
22.1.1.3. Opportunities
22.1.1.4. Trends
22.2. Latin America  Maltodextrin Market, By Type, 2017-2030(US$ Mn)
22.2.1. Overview
22.2.2. SRC Analysis
22.3. Latin America  Maltodextrin Market, By DE (Dextrose Equivalent) Level, 2017-2030(US$ Mn)
22.3.1. Overview
22.3.2. SRC Analysis
22.4. Latin America  Maltodextrin Market, By Source, 2017-2030(US$ Mn)
22.4.1. Overview
22.4.2. SRC Analysis
22.5. Latin America  Maltodextrin Market, By Application, 2017-2030(US$ Mn)
22.5.1. Overview
22.5.2. SRC Analysis
22.6. Latin America  Maltodextrin Market, By Function, 2017-2030(US$ Mn)
22.6.1. Overview
22.6.2. SRC Analysis
22.7. Latin America  Maltodextrin Market, By End-Use Industry, 2017-2030(US$ Mn)
22.7.1. Overview
22.7.2. SRC Analysis
22.8. Latin America  Maltodextrin Market, By Grade, 2017-2030(US$ Mn)
22.8.1. Overview
22.8.2. SRC Analysis
22.9. Latin America  Maltodextrin Market, By Form, 2017-2030(US$ Mn)
22.9.1. Overview
22.9.2. SRC Analysis
22.10. Latin America  Maltodextrin Market, By Certification, 2017-2030(US$ Mn)
22.10.1. Overview
22.10.2. SRC Analysis
22.11. Latin America  Maltodextrin Market, By Distribution Channel, 2017-2030(US$ Mn)
22.11.1. Overview
22.11.2. SRC Analysis
22.12. Latin America  Maltodextrin Market, by Country, 2017-2030 (US$ Mn)
22.12.1. Latin America  Maltodextrin Market, by Country, 2022 Vs 2030 (in%)
22.12.2. Brazil
22.12.3. Argentina
22.12.4. Rest of Latin America
23. Middle East  Maltodextrin Market Analysis
23.1. Overview
23.1.1. Market Dynamics for North America
23.1.1.1. Drivers
23.1.1.2. Restraints
23.1.1.3. Opportunities
23.1.1.4. Trends
23.2. Middle East  Maltodextrin Market, By Type, 2017-2030(US$ Mn)
23.2.1. Overview
23.2.2. SRC Analysis
23.3. Middle East  Maltodextrin Market, By DE (Dextrose Equivalent) Level, 2017-2030(US$ Mn)
23.3.1. Overview
23.3.2. SRC Analysis
23.4. Middle East  Maltodextrin Market, By Source, 2017-2030(US$ Mn)
23.4.1. Overview
23.4.2. SRC Analysis
23.5. Middle East  Maltodextrin Market, By Application, 2017-2030(US$ Mn)
23.5.1. Overview
23.5.2. SRC Analysis
23.6. Middle East  Maltodextrin Market, By Function, 2017-2030(US$ Mn)
23.6.1. Overview
23.6.2. SRC Analysis
23.7. Middle East  Maltodextrin Market, By End-Use Industry, 2017-2030(US$ Mn)
23.7.1. Overview
23.7.2. SRC Analysis
23.8. Middle East  Maltodextrin Market, By Grade, 2017-2030(US$ Mn)
23.8.1. Overview
23.8.2. SRC Analysis
23.9. Middle East  Maltodextrin Market, By Form, 2017-2030(US$ Mn)
23.9.1. Overview
23.9.2. SRC Analysis
23.10. Middle East  Maltodextrin Market, By Certification, 2017-2030(US$ Mn)
23.10.1. Overview
23.10.2. SRC Analysis
23.11. Middle East  Maltodextrin Market, By Distribution Channel, 2017-2030(US$ Mn)
23.11.1. Overview
23.11.2. SRC Analysis
23.12. Middle East  Maltodextrin Market, by Country, 2017-2030 (US$ Mn)
23.12.1. Middle East  Maltodextrin Market, by Country, 2022 Vs 2030 (in%)
23.12.2. UAE
23.12.3. Saudi Arabia
23.12.4. Rest of Middle East
24. Africa  Maltodextrin Market Analysis
24.1. Overview
24.1.1. Market Dynamics for North America
24.1.1.1. Drivers
24.1.1.2. Restraints
24.1.1.3. Opportunities
24.1.1.4. Trends
24.2. Africa  Maltodextrin Market, By Type, 2017-2030(US$ Mn)
24.2.1. Overview
24.2.2. SRC Analysis
24.3. Africa  Maltodextrin Market, By DE (Dextrose Equivalent) Level, 2017-2030(US$ Mn)
24.3.1. Overview
24.3.2. SRC Analysis
24.4. Africa  Maltodextrin Market, By Source, 2017-2030(US$ Mn)
24.4.1. Overview
24.4.2. SRC Analysis
24.5. Africa  Maltodextrin Market, By Application, 2017-2030(US$ Mn)
24.5.1. Overview
24.5.2. SRC Analysis
24.6. Africa  Maltodextrin Market, By Function, 2017-2030(US$ Mn)
24.6.1. Overview
24.6.2. SRC Analysis
24.7. Africa  Maltodextrin Market, By End-Use Industry, 2017-2030(US$ Mn)
24.7.1. Overview
24.7.2. SRC Analysis
24.8. Africa  Maltodextrin Market, By Grade, 2017-2030(US$ Mn)
24.8.1. Overview
24.8.2. SRC Analysis
24.9. Africa  Maltodextrin Market, By Form, 2017-2030(US$ Mn)
24.9.1. Overview
24.9.2. SRC Analysis
24.10. Africa  Maltodextrin Market, By Certification, 2017-2030(US$ Mn)
24.10.1. Overview
24.10.2. SRC Analysis
24.11. Africa  Maltodextrin Market, By Distribution Channel, 2017-2030(US$ Mn)
24.11.1. Overview
24.11.2. SRC Analysis
24.12. Africa  Maltodextrin Market, by Country, 2017-2030 (US$ Mn)
24.12.1. Middle East  Maltodextrin Market, by Country, 2022 Vs 2030 (in%)
24.12.2. South Africa
24.12.3. Egypt
24.12.4. Rest of Africa
25. Company Profiles
25.1. Hunan Er-Kang Pharmaceutical Co., Ltd  (China)
25.1.1. Company Overview
25.1.2. Types/Services Portfolio
25.1.3. Geographical Presence
25.1.4. SWOT Analysis
25.1.5. Financial Summary
25.1.5.1. Market Revenue and Net Profit (2019-2022)
25.1.5.2. Business Segment Revenue Analysis
25.1.5.3. Geographical Revenue Analysis
25.2. American Key Food Products (U.S.)
25.3. Cargill, Incorporated (U.S.)
25.4. SPAC Starch Products (India) Ltd (India)
25.5. Ingredion Incorporated (U.S.)
25.6. Maltodextrin Starch Industry Co., Ltd (Thailand)
25.7. EIAMHENG MALTODEXTRIN STARCH INDUSTRY CO., LTD. (Thailand)
25.8. Psaltry International Limited (Nigeria)
25.9. Dadtco Philafrica B.V. (South Africa)
25.10. Maltodextrin Vietnam (Vietnam)
25.11. Lentus Foods & Agro Ltd (Nigeria)
25.12. kengSeng Group Of Company (China)
26. Research Methodology
26.1. Research Methodology
26.2. Corn-Based Maltodextrin – Secondary Research
26.3. Corn-Based MaltodextrinI – Data Modelling
26.3.1. Company Share Analysis Model
26.3.2. Revenue Based Modelling
26.4. Corn-Based MaltodextrinII – Primary Research
26.5. Research Limitations
26.5.1. Assumptions
List of Figures
FIG. 1 Global  Maltodextrin Market: Research Methodology
FIG. 2 Market Size Estimation – Top Down & Bottom up Approach
FIG. 3 Global  Maltodextrin Market Segmentation
FIG. 4 Global  Maltodextrin Market, By Type, 2022 (US$ Mn)
FIG. 5 Global  Maltodextrin Market, By DE (Dextrose Equivalent) Level, 2022 (US$ Mn)
FIG. 6 Global  Maltodextrin Market, By Source, 2022 (US$ Mn)
FIG. 7 Global  Maltodextrin Market, by Application, 2022 (US$ Mn)
FIG. 8 Global  Maltodextrin Market, By Function, 2022 (US$ Mn)
FIG. 9 Global  Maltodextrin Market, By End-Use Industry, 2022 (US$ Mn)
FIG. 10 Global  Maltodextrin Market, By Grade, 2022 (US$ Mn)
FIG. 11 Global  Maltodextrin Market, By Form, 2022 (US$ Mn)
FIG. 12 Global  Maltodextrin Market, by Certification, 2022 (US$ Mn)
FIG. 13 Global  Maltodextrin Market, By Distribution Channel, 2022 (US$ Mn)
FIG. 14 Global  Maltodextrin Market, by Geography, 2022 (US$ Mn)
FIG. 15 Attractive Investment Proposition, By Type, 2022
FIG. 16 Attractive Investment Proposition, By DE (Dextrose Equivalent) Level, 2022
FIG. 17 Attractive Investment Proposition, By Source, 2022
FIG. 18 Attractive Investment Proposition, By Application, 2022
FIG. 19 Attractive Investment Proposition, By Function, 2022
FIG. 20 Attractive Investment Proposition, By End-Use Industry, 2022
FIG. 21 Attractive Investment Proposition, By Grade, 2022
FIG. 22 Attractive Investment Proposition, By Form, 2022
FIG. 23 Attractive Investment Proposition, By Certification, 2022
FIG. 24 Attractive Investment Proposition, By Distribution Channel, 2022
FIG. 25 Attractive Investment Proposition, by Geography, 2022
FIG. 26 Global Market Share Analysis of Key  Maltodextrin Market Manufacturers, 2022
FIG. 27 Global Market Positioning of Key  Maltodextrin Market Manufacturers, 2022
FIG. 28 Global  Maltodextrin Market Value Contribution, By Type, 2022 & 2030 (Value %)
FIG. 29 Global  Maltodextrin Market, by REGULAR MALTODEXTRIN, Value, 2017-2030 (US$ Mn)
FIG. 30 Global  Maltodextrin Market, by Low-Dextrose Equivalent (DE) Maltodextrin, Value, 2017-2030 (US$ Mn)
FIG. 31 Global  Maltodextrin Market Value Contribution, By DE (Dextrose Equivalent) Level, 2022 & 2030 (Value %)
FIG. 32 Global  Maltodextrin Market, by DE 10-15, Value, 2017-2030 (US$ Mn)
FIG. 33 Global  Maltodextrin Market, by DE 15-20, Value, 2017-2030 (US$ Mn)
FIG. 34 Global  Maltodextrin Market, by DE 20-25, Value, 2017-2030 (US$ Mn)
FIG. 35 Global  Maltodextrin Market, by DE 25-30, Value, 2017-2030 (US$ Mn)
FIG. 36 Global  Maltodextrin Market, by DE 30-40, Value, 2017-2030 (US$ Mn)
FIG. 37 Global  Maltodextrin Market, by DE 40-50, Value, 2017-2030 (US$ Mn)
FIG. 38 Global  Maltodextrin Market, by DE 50 and above, Value, 2017-2030 (US$ Mn)
FIG. 39 Global  Maltodextrin Market Value Contribution, By Source, 2022 & 2030 (Value %)
FIG. 40 Global  Maltodextrin Market, by Corn-Based Maltodextrin, Value, 2017-2030 (US$ Mn)
FIG. 41 Global  Maltodextrin Market, by Wheat-Based Maltodextrin, Value, 2017-2030 (US$ Mn)
FIG. 42 Global  Maltodextrin Market, by Potato-Based Maltodextrin, Value, 2017-2030 (US$ Mn)
FIG. 43 Global  Maltodextrin Market, by Rice-Based Maltodextrin, Value, 2017-2030 (US$ Mn)
FIG. 44 Global  Maltodextrin Market, by Tapioca-Based Maltodextrin, Value, 2017-2030 (US$ Mn)
FIG. 45 Global  Maltodextrin Market Value Contribution, By Application, 2022 & 2030 (Value %)
FIG. 46 Global  Maltodextrin Market, by Food and Beverages, Value, 2017-2030 (US$ Mn)
FIG. 47 Global  Maltodextrin Market, by Bakery and Confectionery, Value, 2017-2030 (US$ Mn)
FIG. 48 Global  Maltodextrin Market, by Beverages, Value, 2017-2030 (US$ Mn)
FIG. 49 Global  Maltodextrin Market, by Dairy Products, Value, 2017-2030 (US$ Mn)
FIG. 50 Global  Maltodextrin Market, by Snacks and Convenience Foods, Value, 2017-2030 (US$ Mn)
FIG. 51 Global  Maltodextrin Market, by Soups, Sauces, and Gravies, Value, 2017-2030 (US$ Mn)
FIG. 52 Global  Maltodextrin Market, by Pharmaceuticals, Value, 2017-2030 (US$ Mn)
FIG. 53 Global  Maltodextrin Market, by Personal Care and Cosmetics, Value, 2017-2030 (US$ Mn)
FIG. 54 Global  Maltodextrin Market, by Industrial Applications, Value, 2017-2030 (US$ Mn)
FIG. 55 Global  Maltodextrin Market Value Contribution, By Function, 2022 & 2030 (Value %)
FIG. 56 Global  Maltodextrin Market, by Thickening Agent, Value, 2017-2030 (US$ Mn)
FIG. 57 Global  Maltodextrin Market, by Filler, Value, 2017-2030 (US$ Mn)
FIG. 58 Global  Maltodextrin Market, by Binder, Value, 2017-2030 (US$ Mn)
FIG. 59 Global  Maltodextrin Market, by Preservative, Value, 2017-2030 (US$ Mn)
FIG. 60 Global  Maltodextrin Market, by Texturizing Agent, Value, 2017-2030 (US$ Mn)
FIG. 61 Global  Maltodextrin Market, by Flavor Carrier, Value, 2017-2030 (US$ Mn)
FIG. 62 Global  Maltodextrin Market Value Contribution, By End-Use Industry, 2022 & 2030 (Value %)
FIG. 63 Global  Maltodextrin Market, by Food and Beverage Industry, Value, 2017-2030 (US$ Mn)
FIG. 64 Global  Maltodextrin Market, by Pharmaceutical Industry, Value, 2017-2030 (US$ Mn)
FIG. 65 Global  Maltodextrin Market, by Cosmetic and Personal Care Industry, Value, 2017-2030 (US$ Mn)
FIG. 66 Global  Maltodextrin Market, by Industrial Sector, Value, 2017-2030 (US$ Mn)
FIG. 67 Global  Maltodextrin Market Value Contribution, By Grade, 2022 & 2030 (Value %)
FIG. 68 Global  Maltodextrin Market, by Food Grade Maltodextrin, Value, 2017-2030 (US$ Mn)
FIG. 69 Global  Maltodextrin Market, by Pharmaceutical Grade Maltodextrin, Value, 2017-2030 (US$ Mn)
FIG. 70 Global  Maltodextrin Market, by Industrial Grade Maltodextrin, Value, 2017-2030 (US$ Mn)
FIG. 71 Global  Maltodextrin Market Value Contribution, By Form, 2022 & 2030 (Value %)
FIG. 72 Global  Maltodextrin Market, by Powder Maltodextrin, Value, 2017-2030 (US$ Mn)
FIG. 73 Global  Maltodextrin Market, by Liquid Maltodextrin, Value, 2017-2030 (US$ Mn)
FIG. 74 Global  Maltodextrin Market Value Contribution, By Certification, 2022 & 2030 (Value %)
FIG. 75 Global  Maltodextrin Market, by Organic Maltodextrin, Value, 2017-2030 (US$ Mn)
FIG. 76 Global  Maltodextrin Market, by Non-GMO Maltodextrin, Value, 2017-2030 (US$ Mn)
FIG. 77 Global  Maltodextrin Market Value Contribution, By Distribution Channel, 2022 & 2030 (Value %)
FIG. 78 Global  Maltodextrin Market, by Direct Sales/Manufacturer Sales, Value, 2017-2030 (US$ Mn)
FIG. 79 Global  Maltodextrin Market, by Distributors, Value, 2017-2030 (US$ Mn)
FIG. 80 Global  Maltodextrin Market, by Online Retail, Value, 2017-2030 (US$ Mn)
FIG. 81 North America  Maltodextrin Market, 2017-2030 (US$ Mn)
FIG. 82 U.S.  Maltodextrin Market, 2017-2030 (US$ Mn)
FIG. 83 Canada  Maltodextrin Market, 2017-2030 (US$ Mn)
FIG. 84 Mexico Maltodextrin Market, 2017-2030 (US$ Mn)
FIG. 85 Europe  Maltodextrin Market, 2017-2030 (US$ Mn)
FIG. 86 Germany  Maltodextrin Market, 2017-2030 (US$ Mn)
FIG. 87 France  Maltodextrin Market, 2017-2030 (US$ Mn)
FIG. 88 U.K.  Maltodextrin Market, 2017-2030 (US$ Mn)
FIG. 89 Italy  Maltodextrin Market, 2017-2030 (US$ Mn)
FIG. 90 Spain  Maltodextrin Market, 2017-2030 (US$ Mn)
FIG. 91 Benelux Maltodextrin Market, 2017-2030 (US$ Mn)
FIG. 92 Russia Maltodextrin Market, 2017-2030 (US$ Mn)
FIG. 93 Rest of Europe  Maltodextrin Market, 2017-2030 (US$ Mn)
FIG. 94 Asia Pacific  Maltodextrin Market, 2017-2030 (US$ Mn)
FIG. 95 China  Maltodextrin Market, 2017-2030 (US$ Mn)
FIG. 96 Japan  Maltodextrin Market, 2017-2030 (US$ Mn)
FIG. 97 India  Maltodextrin Market, 2017-2030 (US$ Mn)
FIG. 98 South Korea  Maltodextrin Market, 2017-2030 (US$ Mn)
FIG. 99 South-East Asia  Maltodextrin Market, 2017-2030 (US$ Mn)
FIG. 100 Rest of Asia Pacific  Maltodextrin Market, 2017-2030 (US$ Mn)
FIG. 101 Latin America  Maltodextrin Market, 2017-2030 (US$ Mn)
FIG. 102 Brazil  Maltodextrin Market, 2017-2030 (US$ Mn)
FIG. 103 Argentina Maltodextrin Market, 2017-2030 (US$ Mn)
FIG. 104 Rest of Latin America  Maltodextrin Market, 2017-2030 (US$ Mn)
FIG. 105 Middle East  Maltodextrin Market, 2017-2030 (US$ Mn)
FIG. 106 UAE Maltodextrin Market, 2017-2030 (US$ Mn)
FIG. 107 Saudi Arabia Maltodextrin Market, 2017-2030 (US$ Mn)
FIG. 108 Rest of Middle East  Maltodextrin Market, 2017-2030 (US$ Mn)
FIG. 109 Africa Maltodextrin Market, 2017-2030 (US$ Mn)
FIG. 110 South Africa  Maltodextrin Market, 2017-2030 (US$ Mn)
FIG. 111 Egypt Maltodextrin Market, 2017-2030 (US$ Mn)
FIG. 112 Rest of Africa  Maltodextrin Market, 2017-2030 (US$ Mn)
List of Tables
TABLE 1 Market Snapshot: Global  Maltodextrin Market
TABLE 2 Global  Maltodextrin Market: Drivers Impact Analysis
TABLE 3 Global  Maltodextrin Market: Market Restraints Impact Analysis
TABLE 4 Global  Maltodextrin Market, by Competitive Benchmarking, 2022
TABLE 5 Global  Maltodextrin Market, by Geographical Presence Analysis, 2022
TABLE 6 Global  Maltodextrin Market, by Key Strategies Analysis, 2022
TABLE 7 Global  Maltodextrin Market, by Regular Maltodextrin, By Region, 2017-2022 (US$ Mn)
TABLE 8 Global  Maltodextrin Market, by Regular Maltodextrin, By Region, 2023-2030 (US$ Mn)
TABLE 9 Global  Maltodextrin Market, by Low-Dextrose Equivalent (DE) Maltodextrin, By Region, 2017-2022 (US$ Mn)
TABLE 10 Global  Maltodextrin Market, by Low-Dextrose Equivalent (DE) Maltodextrin, By Region, 2023-2030 (US$ Mn)
TABLE 11 Global  Maltodextrin Market, by DE 10-15, By Region, 2017-2022 (US$ Mn)
TABLE 12 Global  Maltodextrin Market, by DE 10-15, By Region, 2023-2030 (US$ Mn)
TABLE 13 Global  Maltodextrin Market, by DE 15-20, By Region, 2017-2022 (US$ Mn)
TABLE 14 Global  Maltodextrin Market, by DE 15-20, By Region, 2023-2030 (US$ Mn)
TABLE 15 Global  Maltodextrin Market, by DE 20-25, By Region, 2017-2022 (US$ Mn)
TABLE 16 Global  Maltodextrin Market, by DE 20-25, By Region, 2023-2030 (US$ Mn)
TABLE 17 Global  Maltodextrin Market, by DE 25-30, By Region, 2017-2022 (US$ Mn)
TABLE 18 Global  Maltodextrin Market, by DE 25-30, By Region, 2023-2030 (US$ Mn)
TABLE 19 Global  Maltodextrin Market, by DE 30-40, By Region, 2017-2022 (US$ Mn)
TABLE 20 Global  Maltodextrin Market, by DE 30-40, By Region, 2023-2030 (US$ Mn)
TABLE 21 Global  Maltodextrin Market, by DE 40-50, By Region, 2017-2022 (US$ Mn)
TABLE 22 Global  Maltodextrin Market, by DE 40-50, By Region, 2023-2030 (US$ Mn)
TABLE 23 Global  Maltodextrin Market, by DE 50 and above, By Region, 2017-2022 (US$ Mn)
TABLE 24 Global  Maltodextrin Market, by DE 50 and above, By Region, 2023-2030 (US$ Mn)
TABLE 25 Global  Maltodextrin Market, by Corn-Based Maltodextrin, By Region, 2017-2022 (US$ Mn)
TABLE 26 Global  Maltodextrin Market, by Corn-Based Maltodextrin, By Region, 2023-2030 (US$ Mn)
TABLE 27 Global  Maltodextrin Market, by Wheat-Based Maltodextrin, By Region, 2017-2022 (US$ Mn)
TABLE 28 Global  Maltodextrin Market, by Wheat-Based Maltodextrin, By Region, 2023-2030 (US$ Mn)
TABLE 29 Global  Maltodextrin Market, by Potato-Based Maltodextrin, By Region, 2017-2022 (US$ Mn)
TABLE 30 Global  Maltodextrin Market, by Potato-Based Maltodextrin, By Region, 2023-2030 (US$ Mn)
TABLE 31 Global  Maltodextrin Market, by Rice-Based Maltodextrin, By Region, 2017-2022 (US$ Mn)
TABLE 32 Global  Maltodextrin Market, by Rice-Based Maltodextrin, By Region, 2023-2030 (US$ Mn)
TABLE 33 Global  Maltodextrin Market, by Tapioca-Based Maltodextrin, By Region, 2017-2022 (US$ Mn)
TABLE 34 Global  Maltodextrin Market, by Tapioca-Based Maltodextrin, By Region, 2023-2030 (US$ Mn)
TABLE 35 Global  Maltodextrin Market, by Food and Beverages, By Region, 2017-2022 (US$ Mn)
TABLE 36 Global  Maltodextrin Market, by Food and Beverages, By Region, 2023-2030 (US$ Mn)
TABLE 37 Global  Maltodextrin Market, by Bakery and Confectionery, By Region, 2017-2022 (US$ Mn)
TABLE 38 Global  Maltodextrin Market, by Bakery and Confectionery, By Region, 2023-2030 (US$ Mn)
TABLE 39 Global  Maltodextrin Market, by Beverages, By Region, 2017-2022 (US$ Mn)
TABLE 40 Global  Maltodextrin Market, by Beverages, By Region, 2023-2030 (US$ Mn)
TABLE 41 Global  Maltodextrin Market, by Dairy Products, By Region, 2017-2022 (US$ Mn)
TABLE 42 Global  Maltodextrin Market, by Dairy Products, By Region, 2023-2030 (US$ Mn)
TABLE 43 Global  Maltodextrin Market, by Snacks and Convenience Foods, By Region, 2017-2022 (US$ Mn)
TABLE 44 Global  Maltodextrin Market, by Snacks and Convenience Foods, By Region, 2023-2030 (US$ Mn)
TABLE 45 Global  Maltodextrin Market, by Soups, Sauces, and Gravies, By Region, 2017-2022 (US$ Mn)
TABLE 46 Global  Maltodextrin Market, by Soups, Sauces, and Gravies, By Region, 2023-2030 (US$ Mn)
TABLE 47 Global  Maltodextrin Market, by Pharmaceuticals, By Region, 2017-2022 (US$ Mn)
TABLE 48 Global  Maltodextrin Market, by Pharmaceuticals, By Region, 2023-2030 (US$ Mn)
TABLE 49 Global  Maltodextrin Market, by Personal Care and Cosmetics, By Region, 2017-2022 (US$ Mn)
TABLE 50 Global  Maltodextrin Market, by Personal Care and Cosmetics, By Region, 2023-2030 (US$ Mn)
TABLE 51 Global  Maltodextrin Market, by Industrial Applications, By Region, 2017-2022 (US$ Mn)
TABLE 52 Global  Maltodextrin Market, by Industrial Applications, By Region, 2023-2030 (US$ Mn)
TABLE 53 Global  Maltodextrin Market, by Thickening Agent, By Region, 2017-2022 (US$ Mn)
TABLE 54 Global  Maltodextrin Market, by Thickening Agent, By Region, 2023-2030 (US$ Mn)
TABLE 55 Global  Maltodextrin Market, by Filler, By Region, 2017-2022 (US$ Mn)
TABLE 56 Global  Maltodextrin Market, by Filler, By Region, 2023-2030 (US$ Mn)
TABLE 57 Global  Maltodextrin Market, by Binder, By Region, 2017-2022 (US$ Mn)
TABLE 58 Global  Maltodextrin Market, by Binder, By Region, 2023-2030 (US$ Mn)
TABLE 59 Global  Maltodextrin Market, by Preservative, By Region, 2017-2022 (US$ Mn)
TABLE 60 Global  Maltodextrin Market, by Preservative, By Region, 2023-2030 (US$ Mn)
TABLE 61 Global  Maltodextrin Market, by Texturizing Agent, By Region, 2017-2022 (US$ Mn)
TABLE 62 Global  Maltodextrin Market, by Texturizing Agent, By Region, 2023-2030 (US$ Mn)
TABLE 63 Global  Maltodextrin Market, by Flavor Carrier, By Region, 2017-2022 (US$ Mn)
TABLE 64 Global  Maltodextrin Market, by Flavor Carrier, By Region, 2023-2030 (US$ Mn)
TABLE 65 Global  Maltodextrin Market, by Food and Beverage Industry, By Region, 2017-2022 (US$ Mn)
TABLE 66 Global  Maltodextrin Market, by Food and Beverage Industry, By Region, 2023-2030 (US$ Mn)
TABLE 67 Global  Maltodextrin Market, by Pharmaceutical Industry, By Region, 2017-2022 (US$ Mn)
TABLE 68 Global  Maltodextrin Market, by Pharmaceutical Industry, By Region, 2023-2030 (US$ Mn)
TABLE 69 Global  Maltodextrin Market, by Cosmetic and Personal Care Industry, By Region, 2017-2022 (US$ Mn)
TABLE 70 Global  Maltodextrin Market, by Cosmetic and Personal Care Industry, By Region, 2023-2030 (US$ Mn)
TABLE 71 Global  Maltodextrin Market, by Industrial Sector, By Region, 2017-2022 (US$ Mn)
TABLE 72 Global  Maltodextrin Market, by Industrial Sector, By Region, 2023-2030 (US$ Mn)
TABLE 73 Global  Maltodextrin Market, by Food Grade Maltodextrin, By Region, 2017-2022 (US$ Mn)
TABLE 74 Global  Maltodextrin Market, by Food Grade Maltodextrin, By Region, 2023-2030 (US$ Mn)
TABLE 75 Global  Maltodextrin Market, by Powder Maltodextrin, By Region, 2017-2022 (US$ Mn)
TABLE 76 Global  Maltodextrin Market, by Powder Maltodextrin, By Region, 2023-2030 (US$ Mn)
TABLE 77 Global  Maltodextrin Market, by Liquid Maltodextrin, By Region, 2017-2022 (US$ Mn)
TABLE 78 Global  Maltodextrin Market, by Liquid Maltodextrin, By Region, 2023-2030 (US$ Mn)
TABLE 79 Global  Maltodextrin Market, by Organic Maltodextrin, By Region, 2017-2022 (US$ Mn)
TABLE 80 Global  Maltodextrin Market, by Organic Maltodextrin, By Region, 2023-2030 (US$ Mn)
TABLE 81 Global  Maltodextrin Market, by Non-GMO Maltodextrin, By Region, 2017-2022 (US$ Mn)
TABLE 82 Global  Maltodextrin Market, by Non-GMO Maltodextrin, By Region, 2023-2030 (US$ Mn)
TABLE 83 Global  Maltodextrin Market, by Direct Sales/Manufacturer Sales, By Region, 2017-2022 (US$ Mn)
TABLE 84 Global  Maltodextrin Market, by Direct Sales/Manufacturer Sales, By Region, 2023-2030 (US$ Mn)
TABLE 85 Global  Maltodextrin Market, by Distributors, By Region, 2017-2022 (US$ Mn)
TABLE 86 Global  Maltodextrin Market, by Distributors, By Region, 2023-2030 (US$ Mn)
TABLE 87 Global  Maltodextrin Market, by Online Retail, By Region, 2017-2022 (US$ Mn)
TABLE 88 Global  Maltodextrin Market, by Online Retail, By Region, 2023-2030 (US$ Mn)
TABLE 89 Global  Maltodextrin Market, By Type, 2017-2022 (US$ Mn)
TABLE 90 Global  Maltodextrin Market, By Type, 2023-2030 (US$ Mn)
TABLE 91 Global  Maltodextrin Market, By DE (Dextrose Equivalent) Level, 2017-2022 (US$ Mn)
TABLE 92 Global  Maltodextrin Market, By DE (Dextrose Equivalent) Level, 2023-2030 (US$ Mn)
TABLE 93 Global  Maltodextrin Market, By Source, 2017-2022 (US$ Mn)
TABLE 94 Global  Maltodextrin Market, By Source, 2023-2030 (US$ Mn)
TABLE 95 Global  Maltodextrin Market, By Application, By Region, 2017-2022 (US$ Mn)
TABLE 96 Global  Maltodextrin Market, By Application, By Region, 2023-2030 (US$ Mn)
TABLE 97 Global  Maltodextrin Market, By Function, 2017-2022 (US$ Mn)
TABLE 98 Global  Maltodextrin Market, By End-Use Industry, 2017-2022 (US$ Mn)
TABLE 99 Global  Maltodextrin Market, By End-Use Industry, 2023-2030 (US$ Mn)
TABLE 100 Global  Maltodextrin Market, By Grade, 2017-2022 (US$ Mn)
TABLE 101 Global  Maltodextrin Market, By Grade, 2023-2030 (US$ Mn)
TABLE 102 Global  Maltodextrin Market, By Form, 2017-2022 (US$ Mn)
TABLE 103 Global  Maltodextrin Market, By Form, 2023-2030 (US$ Mn)
TABLE 104 Global  Maltodextrin Market, By Certification, By Region, 2017-2022 (US$ Mn)
TABLE 105 Global  Maltodextrin Market, By Certification, By Region, 2023-2030 (US$ Mn)
TABLE 106 Global  Maltodextrin Market, By Distribution Channel, 2017-2022 (US$ Mn)
TABLE 107 Global  Maltodextrin Market, By Distribution Channel, 2023-2030 (US$ Mn)
TABLE 108 Global  Maltodextrin Market, by Region, 2017-2022 (US$ Mn)
TABLE 109 Global  Maltodextrin Market, by Region, 2023-2030 (US$ Mn)
TABLE 110 North America  Maltodextrin Market, By Type, 2017-2022 (US$ Mn)
TABLE 111 North America  Maltodextrin Market, By Type, 2023-2030 (US$ Mn)
TABLE 112 North America  Maltodextrin Market, By DE (Dextrose Equivalent) Level, 2017-2022 (US$ Mn)
TABLE 113 North America  Maltodextrin Market, By DE (Dextrose Equivalent) Level, 2023-2030 (US$ Mn)
TABLE 114 North America  Maltodextrin Market, By Source, 2017-2022 (US$ Mn)
TABLE 115 North America  Maltodextrin Market, By Source, 2023-2030 (US$ Mn)
TABLE 116 North America Maltodextrin Market, By Application, By Region, 2017-2022 (US$ Mn)
TABLE 117 North America Maltodextrin Market, By Application, By Region, 2023-2030 (US$ Mn)
TABLE 118 North America Maltodextrin Market, By Function, 2017-2022 (US$ Mn)
TABLE 119 North America Maltodextrin Market, By Function, 2023-2030 (US$ Mn)
TABLE 120 North America  Maltodextrin Market, By End-Use Industry, 2017-2022 (US$ Mn)
TABLE 121 North America  Maltodextrin Market, By End-Use Industry, 2023-2030 (US$ Mn)
TABLE 122 North America  Maltodextrin Market, By Grade, 2017-2022 (US$ Mn)
TABLE 123 North America  Maltodextrin Market, By Grade, 2023-2030 (US$ Mn)
TABLE 124 North America  Maltodextrin Market, By Form, 2017-2022 (US$ Mn)
TABLE 125 North America  Maltodextrin Market, By Form, 2023-2030 (US$ Mn)
TABLE 126 North America Maltodextrin Market, By Certification, By Region, 2017-2022 (US$ Mn)
TABLE 127 North America Maltodextrin Market, By Certification, By Region, 2023-2030 (US$ Mn)
TABLE 128 North America Maltodextrin Market, By Distribution Channel, 2017-2022 (US$ Mn)
TABLE 129 North America Maltodextrin Market, By Distribution Channel, 2023-2030 (US$ Mn)
TABLE 130 North America  Maltodextrin Market, by Country, 2017-2022 (US$ Mn)
TABLE 131 North America  Maltodextrin Market, by Country, 2023-2030 (US$ Mn)
TABLE 132 United States  Maltodextrin Market, By Type, 2017-2022 (US$ Mn)
TABLE 133 United States  Maltodextrin Market, By Type, 2023-2030 (US$ Mn)
TABLE 134 United States  Maltodextrin Market, By DE (Dextrose Equivalent) Level, 2017-2022 (US$ Mn)
TABLE 135 United States  Maltodextrin Market, By DE (Dextrose Equivalent) Level, 2023-2030 (US$ Mn)
TABLE 136 United States  Maltodextrin Market, By Source, 2017-2022 (US$ Mn)
TABLE 137 United States  Maltodextrin Market, By Source, 2023-2030 (US$ Mn)
TABLE 138 United States Maltodextrin Market, By Application, By Region, 2017-2022 (US$ Mn)
TABLE 139 United States Maltodextrin Market, By Application, By Region, 2023-2030 (US$ Mn)
TABLE 140 United States Maltodextrin Market, By Function, 2017-2022 (US$ Mn)
TABLE 141 United States Maltodextrin Market, By Function, 2023-2030 (US$ Mn)
TABLE 142 United States  Maltodextrin Market, By End-Use Industry, 2017-2022 (US$ Mn)
TABLE 143 United States  Maltodextrin Market, By End-Use Industry, 2023-2030 (US$ Mn)
TABLE 144 United States  Maltodextrin Market, By Grade, 2017-2022 (US$ Mn)
TABLE 145 United States  Maltodextrin Market, By Grade, 2023-2030 (US$ Mn)
TABLE 146 United States  Maltodextrin Market, By Form, 2017-2022 (US$ Mn)
TABLE 147 United States  Maltodextrin Market, By Form, 2023-2030 (US$ Mn)
TABLE 148 United States  Maltodextrin Market, By Certification, By Region, 2017-2022 (US$ Mn)
TABLE 149 United States  Maltodextrin Market, By Certification, By Region, 2023-2030 (US$ Mn)
TABLE 150 United States  Maltodextrin Market, By Distribution Channel, 2017-2022 (US$ Mn)
TABLE 151 United States  Maltodextrin Market, By Distribution Channel, 2023-2030 (US$ Mn)
TABLE 152 Canada  Maltodextrin Market, By Type, 2017-2022 (US$ Mn)
TABLE 153 Canada  Maltodextrin Market, By Type, 2023-2030 (US$ Mn)
TABLE 154 Canada  Maltodextrin Market, By DE (Dextrose Equivalent) Level, 2017-2022 (US$ Mn)
TABLE 155 Canada  Maltodextrin Market, By DE (Dextrose Equivalent) Level, 2023-2030 (US$ Mn)
TABLE 156 Canada  Maltodextrin Market, By Source, 2017-2022 (US$ Mn)
TABLE 157 Canada  Maltodextrin Market, By Source, 2023-2030 (US$ Mn)
TABLE 158 Canada Maltodextrin Market, By Application, By Region, 2017-2022 (US$ Mn)
TABLE 159 Canada Maltodextrin Market, By Application, By Region, 2023-2030 (US$ Mn)
TABLE 160 Canada Maltodextrin Market, By Function, 2017-2022 (US$ Mn)
TABLE 161 Canada  Maltodextrin Market, By Function, 2023-2030 (US$ Mn)
TABLE 162 Canada  Maltodextrin Market, By End-Use Industry, 2017-2022 (US$ Mn)
TABLE 163 Canada  Maltodextrin Market, By End-Use Industry, 2023-2030 (US$ Mn)
TABLE 164 Canada  Maltodextrin Market, By Grade, 2017-2022 (US$ Mn)
TABLE 165 Canada  Maltodextrin Market, By Grade, 2023-2030 (US$ Mn)
TABLE 166 Canada  Maltodextrin Market, By Form, 2017-2022 (US$ Mn)
TABLE 167 Canada  Maltodextrin Market, By Form, 2023-2030 (US$ Mn)
TABLE 168 Canada  Maltodextrin Market, By Certification, By Region, 2017-2022 (US$ Mn)
TABLE 169 Canada  Maltodextrin Market, By Certification, By Region, 2023-2030 (US$ Mn)
TABLE 170 Canada  Maltodextrin Market, By Distribution Channel, 2017-2022 (US$ Mn)
TABLE 171 Canada  Maltodextrin Market, By Distribution Channel, 2023-2030 (US$ Mn)
TABLE 172 Mexico  Maltodextrin Market, By Type, 2017-2022 (US$ Mn)
TABLE 173 Mexico  Maltodextrin Market, By Type, 2023-2030 (US$ Mn)
TABLE 174 Mexico  Maltodextrin Market, By DE (Dextrose Equivalent) Level, 2017-2022 (US$ Mn)
TABLE 175 Mexico  Maltodextrin Market, By DE (Dextrose Equivalent) Level, 2023-2030 (US$ Mn)
TABLE 176 Mexico  Maltodextrin Market, By Source, 2017-2022 (US$ Mn)
TABLE 177 Mexico  Maltodextrin Market, By Source, 2023-2030 (US$ Mn)
TABLE 178 Mexico Maltodextrin Market, By Application, By Region, 2017-2022 (US$ Mn)
TABLE 179 Mexico Maltodextrin Market, By Application, By Region, 2023-2030 (US$ Mn)
TABLE 180 Mexico Maltodextrin Market, By Function, 2017-2022 (US$ Mn)
TABLE 181 Mexico  Maltodextrin Market, By Function, 2023-2030 (US$ Mn)
TABLE 182 Mexico  Maltodextrin Market, By End-Use Industry, 2017-2022 (US$ Mn)
TABLE 183 Mexico  Maltodextrin Market, By End-Use Industry, 2023-2030 (US$ Mn)
TABLE 184 Mexico  Maltodextrin Market, By Grade, 2017-2022 (US$ Mn)
TABLE 185 Mexico  Maltodextrin Market, By Grade, 2023-2030 (US$ Mn)
TABLE 186 Mexico  Maltodextrin Market, By Form, 2017-2022 (US$ Mn)
TABLE 187 Mexico  Maltodextrin Market, By Form, 2023-2030 (US$ Mn)
TABLE 188 Mexico  Maltodextrin Market, By Certification, By Region, 2017-2022 (US$ Mn)
TABLE 189 Mexico  Maltodextrin Market, By Certification, By Region, 2023-2030 (US$ Mn)
TABLE 190 Mexico  Maltodextrin Market, By Distribution Channel, 2017-2022 (US$ Mn)
TABLE 191 Mexico  Maltodextrin Market, By Distribution Channel, 2023-2030 (US$ Mn)
TABLE 192 Europe  Maltodextrin Market, By Type, 2017-2022 (US$ Mn)
TABLE 193 Europe  Maltodextrin Market, By Type, 2023-2030 (US$ Mn)
TABLE 194 Europe  Maltodextrin Market, By DE (Dextrose Equivalent) Level, 2017-2022 (US$ Mn)
TABLE 195 Europe  Maltodextrin Market, By DE (Dextrose Equivalent) Level, 2023-2030 (US$ Mn)
TABLE 196 Europe  Maltodextrin Market, By Source, 2017-2022 (US$ Mn)
TABLE 197 Europe  Maltodextrin Market, By Source, 2023-2030 (US$ Mn)
TABLE 198 Europe Maltodextrin Market, By Application, By Region, 2017-2022 (US$ Mn)
TABLE 199 Europe Maltodextrin Market, By Application, By Region, 2023-2030 (US$ Mn)
TABLE 200 Europe Maltodextrin Market, By Function, 2017-2022 (US$ Mn)
TABLE 201 Europe Maltodextrin Market, By Function, 2023-2030 (US$ Mn)
TABLE 202 Europe  Maltodextrin Market, By End-Use Industry, 2017-2022 (US$ Mn)
TABLE 203 Europe  Maltodextrin Market, By End-Use Industry, 2023-2030 (US$ Mn)
TABLE 204 Europe  Maltodextrin Market, By Grade, 2017-2022 (US$ Mn)
TABLE 205 Europe  Maltodextrin Market, By Grade, 2023-2030 (US$ Mn)
TABLE 206 Europe  Maltodextrin Market, By Form, 2017-2022 (US$ Mn)
TABLE 207 Europe  Maltodextrin Market, By Form, 2023-2030 (US$ Mn)
TABLE 208 Europe  Maltodextrin Market, By Certification, By Region, 2017-2022 (US$ Mn)
TABLE 209 Europe  Maltodextrin Market, By Certification, By Region, 2023-2030 (US$ Mn)
TABLE 210 Europe  Maltodextrin Market, By Distribution Channel, 2017-2022 (US$ Mn)
TABLE 211 Europe  Maltodextrin Market, By Distribution Channel, 2023-2030 (US$ Mn)
TABLE 212 Europe  Maltodextrin Market, by Country, 2017-2022 (US$ Mn)
TABLE 213 Europe  Maltodextrin Market, by Country, 2023-2030 (US$ Mn)
TABLE 214 Germany  Maltodextrin Market, By Type, 2017-2022 (US$ Mn)
TABLE 215 Germany  Maltodextrin Market, By Type, 2023-2030 (US$ Mn)
TABLE 216 Germany  Maltodextrin Market, By DE (Dextrose Equivalent) Level, 2017-2022 (US$ Mn)
TABLE 217 Germany  Maltodextrin Market, By DE (Dextrose Equivalent) Level, 2023-2030 (US$ Mn)
TABLE 218 Germany  Maltodextrin Market, By Source, 2017-2022 (US$ Mn)
TABLE 219 Germany  Maltodextrin Market, By Source, 2023-2030 (US$ Mn)
TABLE 220 Germany Maltodextrin Market, By Application, By Region, 2017-2022 (US$ Mn)
TABLE 221 Germany Maltodextrin Market, By Application, By Region, 2023-2030 (US$ Mn)
TABLE 222 Germany Maltodextrin Market, By Function, 2017-2022 (US$ Mn)
TABLE 223 Germany  Maltodextrin Market, By Function, 2023-2030 (US$ Mn)
TABLE 224 Germany  Maltodextrin Market, By End-Use Industry, 2017-2022 (US$ Mn)
TABLE 225 Germany  Maltodextrin Market, By End-Use Industry, 2023-2030 (US$ Mn)
TABLE 226 Germany  Maltodextrin Market, By Grade, 2017-2022 (US$ Mn)
TABLE 227 Germany  Maltodextrin Market, By Grade, 2023-2030 (US$ Mn)
TABLE 228 Germany  Maltodextrin Market, By Form, 2017-2022 (US$ Mn)
TABLE 229 Germany  Maltodextrin Market, By Form, 2023-2030 (US$ Mn)
TABLE 230 Germany  Maltodextrin Market, By Certification, By Region, 2017-2022 (US$ Mn)
TABLE 231 Germany  Maltodextrin Market, By Certification, By Region, 2023-2030 (US$ Mn)
TABLE 232 Germany  Maltodextrin Market, By Distribution Channel, 2017-2022 (US$ Mn)
TABLE 233 Germany  Maltodextrin Market, By Distribution Channel, 2023-2030 (US$ Mn)
TABLE 234 France  Maltodextrin Market, By Type, 2017-2022 (US$ Mn)
TABLE 235 France  Maltodextrin Market, By Type, 2023-2030 (US$ Mn)
TABLE 236 France  Maltodextrin Market, By DE (Dextrose Equivalent) Level, 2017-2022 (US$ Mn)
TABLE 237 France  Maltodextrin Market, By DE (Dextrose Equivalent) Level, 2023-2030 (US$ Mn)
TABLE 238 France  Maltodextrin Market, By Source, 2017-2022 (US$ Mn)
TABLE 239 France  Maltodextrin Market, By Source, 2023-2030 (US$ Mn)
TABLE 240 France Maltodextrin Market, By Application, By Region, 2017-2022 (US$ Mn)
TABLE 241 France Maltodextrin Market, By Application, By Region, 2023-2030 (US$ Mn)
TABLE 242 France Maltodextrin Market, By Function, 2017-2022 (US$ Mn)
TABLE 243 France  Maltodextrin Market, By Function, 2023-2030 (US$ Mn)
TABLE 244 France  Maltodextrin Market, By End-Use Industry, 2017-2022 (US$ Mn)
TABLE 245 France  Maltodextrin Market, By End-Use Industry, 2023-2030 (US$ Mn)
TABLE 246 France  Maltodextrin Market, By Grade, 2017-2022 (US$ Mn)
TABLE 247 France  Maltodextrin Market, By Grade, 2023-2030 (US$ Mn)
TABLE 248 France  Maltodextrin Market, By Form, 2017-2022 (US$ Mn)
TABLE 249 France  Maltodextrin Market, By Form, 2023-2030 (US$ Mn)
TABLE 250 France  Maltodextrin Market, By Certification, By Region, 2017-2022 (US$ Mn)
TABLE 251 France  Maltodextrin Market, By Certification, By Region, 2023-2030 (US$ Mn)
TABLE 252 France  Maltodextrin Market, By Distribution Channel, 2017-2022 (US$ Mn)
TABLE 253 France  Maltodextrin Market, By Distribution Channel, 2023-2030 (US$ Mn)
TABLE 254 United Kingdom  Maltodextrin Market, By Type, 2017-2022 (US$ Mn)
TABLE 255 United Kingdom  Maltodextrin Market, By Type, 2023-2030 (US$ Mn)
TABLE 256 United Kingdom  Maltodextrin Market, By DE (Dextrose Equivalent) Level, 2017-2022 (US$ Mn)
TABLE 257 United Kingdom  Maltodextrin Market, By DE (Dextrose Equivalent) Level, 2023-2030 (US$ Mn)
TABLE 258 United Kingdom  Maltodextrin Market, By Source, 2017-2022 (US$ Mn)
TABLE 259 United Kingdom  Maltodextrin Market, By Source, 2023-2030 (US$ Mn)
TABLE 260 United Kingdom Maltodextrin Market, By Application, By Region, 2017-2022 (US$ Mn)
TABLE 261 United Kingdom Maltodextrin Market, By Application, By Region, 2023-2030 (US$ Mn)
TABLE 262 United Kingdom Maltodextrin Market, By Function, 2017-2022 (US$ Mn)
TABLE 263 United Kingdom  Maltodextrin Market, By Function, 2023-2030 (US$ Mn)
TABLE 264 United Kingdom  Maltodextrin Market, By End-Use Industry, 2017-2022 (US$ Mn)
TABLE 265 United Kingdom  Maltodextrin Market, By End-Use Industry, 2023-2030 (US$ Mn)
TABLE 266 United Kingdom  Maltodextrin Market, By Grade, 2017-2022 (US$ Mn)
TABLE 267 United Kingdom  Maltodextrin Market, By Grade, 2023-2030 (US$ Mn)
TABLE 268 United Kingdom  Maltodextrin Market, By Form, 2017-2022 (US$ Mn)
TABLE 269 United Kingdom  Maltodextrin Market, By Form, 2023-2030 (US$ Mn)
TABLE 270 United Kingdom  Maltodextrin Market, By Certification, By Region, 2017-2022 (US$ Mn)
TABLE 271 United Kingdom  Maltodextrin Market, By Certification, By Region, 2023-2030 (US$ Mn)
TABLE 272 United Kingdom  Maltodextrin Market, By Distribution Channel, 2017-2022 (US$ Mn)
TABLE 273 United Kingdom  Maltodextrin Market, By Distribution Channel, 2023-2030 (US$ Mn)
TABLE 274 Italy  Maltodextrin Market, By Type, 2017-2022 (US$ Mn)
TABLE 275 Italy  Maltodextrin Market, By Type, 2023-2030 (US$ Mn)
TABLE 276 Italy  Maltodextrin Market, By DE (Dextrose Equivalent) Level, 2017-2022 (US$ Mn)
TABLE 277 Italy  Maltodextrin Market, By DE (Dextrose Equivalent) Level, 2023-2030 (US$ Mn)
TABLE 278 Italy  Maltodextrin Market, By Source, 2017-2022 (US$ Mn)
TABLE 279 Italy  Maltodextrin Market, By Source, 2023-2030 (US$ Mn)
TABLE 280 Italy Maltodextrin Market, By Application, By Region, 2017-2022 (US$ Mn)
TABLE 281 Italy Maltodextrin Market, By Application, By Region, 2023-2030 (US$ Mn)
TABLE 282 Italy Maltodextrin Market, By Function, 2017-2022 (US$ Mn)
TABLE 283 Italy  Maltodextrin Market, By Function, 2023-2030 (US$ Mn)
TABLE 284 Italy  Maltodextrin Market, By End-Use Industry, 2017-2022 (US$ Mn)
TABLE 285 Italy  Maltodextrin Market, By End-Use Industry, 2023-2030 (US$ Mn)
TABLE 286 Italy  Maltodextrin Market, By Grade, 2017-2022 (US$ Mn)
TABLE 287 Italy  Maltodextrin Market, By Grade, 2023-2030 (US$ Mn)
TABLE 288 Italy  Maltodextrin Market, By Form, 2017-2022 (US$ Mn)
TABLE 289 Italy  Maltodextrin Market, By Form, 2023-2030 (US$ Mn)
TABLE 290 Italy  Maltodextrin Market, By Certification, By Region, 2017-2022 (US$ Mn)
TABLE 291 Italy  Maltodextrin Market, By Certification, By Region, 2023-2030 (US$ Mn)
TABLE 292 Italy  Maltodextrin Market, By Distribution Channel, 2017-2022 (US$ Mn)
TABLE 293 Italy  Maltodextrin Market, By Distribution Channel, 2023-2030 (US$ Mn)
TABLE 294 Spain  Maltodextrin Market, By Type, 2017-2022 (US$ Mn)
TABLE 295 Spain  Maltodextrin Market, By Type, 2023-2030 (US$ Mn)
TABLE 296 Spain  Maltodextrin Market, By DE (Dextrose Equivalent) Level, 2017-2022 (US$ Mn)
TABLE 297 Spain  Maltodextrin Market, By DE (Dextrose Equivalent) Level, 2023-2030 (US$ Mn)
TABLE 298 Spain  Maltodextrin Market, By Source, 2017-2022 (US$ Mn)
TABLE 299 Spain  Maltodextrin Market, By Source, 2023-2030 (US$ Mn)
TABLE 300 Spain Maltodextrin Market, By Application, By Region, 2017-2022 (US$ Mn)
TABLE 301 Spain Maltodextrin Market, By Application, By Region, 2023-2030 (US$ Mn)
TABLE 302 Spain Maltodextrin Market, By Function, 2017-2022 (US$ Mn)
TABLE 303 Spain  Maltodextrin Market, By Function, 2023-2030 (US$ Mn)
TABLE 304 Spain  Maltodextrin Market, By End-Use Industry, 2017-2022 (US$ Mn)
TABLE 305 Spain  Maltodextrin Market, By End-Use Industry, 2023-2030 (US$ Mn)
TABLE 306 Spain  Maltodextrin Market, By Grade, 2017-2022 (US$ Mn)
TABLE 307 Spain  Maltodextrin Market, By Grade, 2023-2030 (US$ Mn)
TABLE 308 Spain  Maltodextrin Market, By Form, 2017-2022 (US$ Mn)
TABLE 309 Spain  Maltodextrin Market, By Form, 2023-2030 (US$ Mn)
TABLE 310 Spain  Maltodextrin Market, By Certification, By Region, 2017-2022 (US$ Mn)
TABLE 311 Spain  Maltodextrin Market, By Certification, By Region, 2023-2030 (US$ Mn)
TABLE 312 Spain  Maltodextrin Market, By Distribution Channel, 2017-2022 (US$ Mn)
TABLE 313 Spain  Maltodextrin Market, By Distribution Channel, 2023-2030 (US$ Mn)
TABLE 314 Benelux Maltodextrin Market, By Type, 2017-2022 (US$ Mn)
TABLE 315 Benelux Maltodextrin Market, By Type, 2023-2030 (US$ Mn)
TABLE 316 Benelux Maltodextrin Market, By DE (Dextrose Equivalent) Level, 2017-2022 (US$ Mn)
TABLE 317 Benelux Maltodextrin Market, By DE (Dextrose Equivalent) Level, 2023-2030 (US$ Mn)
TABLE 318 Benelux Maltodextrin Market, By Source, 2017-2022 (US$ Mn)
TABLE 319 Benelux Maltodextrin Market, By Source, 2023-2030 (US$ Mn)
TABLE 320 Benelux Maltodextrin Market, By Application, By Region, 2017-2022 (US$ Mn)
TABLE 321 Benelux Maltodextrin Market, By Application, By Region, 2023-2030 (US$ Mn)
TABLE 322 Benelux Maltodextrin Market, By Function, 2017-2022 (US$ Mn)
TABLE 323 Benelux  Maltodextrin Market, By Function, 2023-2030 (US$ Mn)
TABLE 324 Benelux  Maltodextrin Market, By End-Use Industry, 2017-2022 (US$ Mn)
TABLE 325 Benelux  Maltodextrin Market, By End-Use Industry, 2023-2030 (US$ Mn)
TABLE 326 Benelux  Maltodextrin Market, By Grade, 2017-2022 (US$ Mn)
TABLE 327 Benelux  Maltodextrin Market, By Grade, 2023-2030 (US$ Mn)
TABLE 328 Benelux  Maltodextrin Market, By Form, 2017-2022 (US$ Mn)
TABLE 329 Benelux  Maltodextrin Market, By Form, 2023-2030 (US$ Mn)
TABLE 330 Benelux  Maltodextrin Market, By Certification, By Region, 2017-2022 (US$ Mn)
TABLE 331 Benelux  Maltodextrin Market, By Certification, By Region, 2023-2030 (US$ Mn)
TABLE 332 Benelux  Maltodextrin Market, By Distribution Channel, 2017-2022 (US$ Mn)
TABLE 333 Benelux  Maltodextrin Market, By Distribution Channel, 2023-2030 (US$ Mn)
TABLE 334 Russia Maltodextrin Market, By Type, 2017-2022 (US$ Mn)
TABLE 335 Russia Maltodextrin Market, By Type, 2023-2030 (US$ Mn)
TABLE 336 Russia Maltodextrin Market, By DE (Dextrose Equivalent) Level, 2017-2022 (US$ Mn)
TABLE 337 Russia Maltodextrin Market, By DE (Dextrose Equivalent) Level, 2023-2030 (US$ Mn)
TABLE 338 Russia Maltodextrin Market, By Source, 2017-2022 (US$ Mn)
TABLE 339 Russia Maltodextrin Market, By Source, 2023-2030 (US$ Mn)
TABLE 340 Russia Maltodextrin Market, By Application, By Region, 2017-2022 (US$ Mn)
TABLE 341 Russia Maltodextrin Market, By Application, By Region, 2023-2030 (US$ Mn)
TABLE 342 Russia Maltodextrin Market, By Function, 2017-2022 (US$ Mn)
TABLE 343 Russia  Maltodextrin Market, By Function, 2023-2030 (US$ Mn)
TABLE 344 Russia  Maltodextrin Market, By End-Use Industry, 2017-2022 (US$ Mn)
TABLE 345 Russia  Maltodextrin Market, By End-Use Industry, 2023-2030 (US$ Mn)
TABLE 346 Russia  Maltodextrin Market, By Grade, 2017-2022 (US$ Mn)
TABLE 347 Russia  Maltodextrin Market, By Grade, 2023-2030 (US$ Mn)
TABLE 348 Russia  Maltodextrin Market, By Form, 2017-2022 (US$ Mn)
TABLE 349 Russia  Maltodextrin Market, By Form, 2023-2030 (US$ Mn)
TABLE 350 Russia  Maltodextrin Market, By Certification, By Region, 2017-2022 (US$ Mn)
TABLE 351 Russia  Maltodextrin Market, By Certification, By Region, 2023-2030 (US$ Mn)
TABLE 352 Russia  Maltodextrin Market, By Distribution Channel, 2017-2022 (US$ Mn)
TABLE 353 Russia  Maltodextrin Market, By Distribution Channel, 2023-2030 (US$ Mn)
TABLE 354 Rest of Europe  Maltodextrin Market, By Type, 2017-2022 (US$ Mn)
TABLE 355 Rest of Europe  Maltodextrin Market, By Type, 2023-2030 (US$ Mn)
TABLE 356 Rest of Europe  Maltodextrin Market, By DE (Dextrose Equivalent) Level, 2017-2022 (US$ Mn)
TABLE 357 Rest of Europe  Maltodextrin Market, By DE (Dextrose Equivalent) Level, 2023-2030 (US$ Mn)
TABLE 358 Rest of Europe  Maltodextrin Market, By Source, 2017-2022 (US$ Mn)
TABLE 359 Rest of Europe  Maltodextrin Market, By Source, 2023-2030 (US$ Mn)
TABLE 360 Rest of Europe Maltodextrin Market, By Application, By Region, 2017-2022 (US$ Mn)
TABLE 361 Rest of Europe Maltodextrin Market, By Application, By Region, 2023-2030 (US$ Mn)
TABLE 362 Rest of Europe Maltodextrin Market, By Function, 2017-2022 (US$ Mn)
TABLE 363 Rest of Europe  Maltodextrin Market, By Function, 2023-2030 (US$ Mn)
TABLE 364 Rest of Europe  Maltodextrin Market, By End-Use Industry, 2017-2022 (US$ Mn)
TABLE 365 Rest of Europe  Maltodextrin Market, By End-Use Industry, 2023-2030 (US$ Mn)
TABLE 366 Rest of Europe  Maltodextrin Market, By Grade, 2017-2022 (US$ Mn)
TABLE 367 Rest of Europe  Maltodextrin Market, By Grade, 2023-2030 (US$ Mn)
TABLE 368 Rest of Europe  Maltodextrin Market, By Form, 2017-2022 (US$ Mn)
TABLE 369 Rest of Europe  Maltodextrin Market, By Form, 2023-2030 (US$ Mn)
TABLE 370 Rest of Europe  Maltodextrin Market, By Certification, By Region, 2017-2022 (US$ Mn)
TABLE 371 Rest of Europe  Maltodextrin Market, By Certification, By Region, 2023-2030 (US$ Mn)
TABLE 372 Rest of Europe  Maltodextrin Market, By Distribution Channel, 2017-2022 (US$ Mn)
TABLE 373 Rest of Europe  Maltodextrin Market, By Distribution Channel, 2023-2030 (US$ Mn)
TABLE 374 Asia Pacific  Maltodextrin Market, By Type, 2017-2022 (US$ Mn)
TABLE 375 Asia Pacific  Maltodextrin Market, By Type, 2023-2030 (US$ Mn)
TABLE 376 Asia Pacific  Maltodextrin Market, By DE (Dextrose Equivalent) Level, 2017-2022 (US$ Mn)
TABLE 377 Asia Pacific  Maltodextrin Market, By DE (Dextrose Equivalent) Level, 2023-2030 (US$ Mn)
TABLE 378 Asia Pacific  Maltodextrin Market, By Source, 2017-2022 (US$ Mn)
TABLE 379 Asia Pacific  Maltodextrin Market, By Source, 2023-2030 (US$ Mn)
TABLE 380 Asia Pacific Maltodextrin Market, By Application, By Region, 2017-2022 (US$ Mn)
TABLE 381 Asia Pacific Maltodextrin Market, By Application, By Region, 2023-2030 (US$ Mn)
TABLE 382 Asia Pacific Maltodextrin Market, By Function, 2017-2022 (US$ Mn)
TABLE 383 Asia Pacific  Maltodextrin Market, By Function, 2023-2030 (US$ Mn)
TABLE 384 Asia Pacific  Maltodextrin Market, By End-Use Industry, 2017-2022 (US$ Mn)
TABLE 385 Asia Pacific  Maltodextrin Market, By End-Use Industry, 2023-2030 (US$ Mn)
TABLE 386 Asia Pacific  Maltodextrin Market, By Grade, 2017-2022 (US$ Mn)
TABLE 387 Asia Pacific  Maltodextrin Market, By Grade, 2023-2030 (US$ Mn)
TABLE 388 Asia Pacific  Maltodextrin Market, By Form, 2017-2022 (US$ Mn)
TABLE 389 Asia Pacific  Maltodextrin Market, By Form, 2023-2030 (US$ Mn)
TABLE 390 Asia Pacific  Maltodextrin Market, By Certification, By Region, 2017-2022 (US$ Mn)
TABLE 391 Asia Pacific  Maltodextrin Market, By Certification, By Region, 2023-2030 (US$ Mn)
TABLE 392 Asia Pacific  Maltodextrin Market, By Distribution Channel, 2017-2022 (US$ Mn)
TABLE 393 Asia Pacific  Maltodextrin Market, By Distribution Channel, 2023-2030 (US$ Mn)
TABLE 394 China  Maltodextrin Market, By Type, 2017-2022 (US$ Mn)
TABLE 395 China  Maltodextrin Market, By Type, 2023-2030 (US$ Mn)
TABLE 396 China  Maltodextrin Market, By DE (Dextrose Equivalent) Level, 2017-2022 (US$ Mn)
TABLE 397 China  Maltodextrin Market, By DE (Dextrose Equivalent) Level, 2023-2030 (US$ Mn)
TABLE 398 China  Maltodextrin Market, By Source, 2017-2022 (US$ Mn)
TABLE 399 China  Maltodextrin Market, By Source, 2023-2030 (US$ Mn)
TABLE 400 China Maltodextrin Market, By Application, By Region, 2017-2022 (US$ Mn)
TABLE 401 China Maltodextrin Market, By Application, By Region, 2023-2030 (US$ Mn)
TABLE 402 China Maltodextrin Market, By Function, 2017-2022 (US$ Mn)
TABLE 403 China  Maltodextrin Market, By Function, 2023-2030 (US$ Mn)
TABLE 404 China  Maltodextrin Market, By End-Use Industry, 2017-2022 (US$ Mn)
TABLE 405 China  Maltodextrin Market, By End-Use Industry, 2023-2030 (US$ Mn)
TABLE 406 China  Maltodextrin Market, By Grade, 2017-2022 (US$ Mn)
TABLE 407 China  Maltodextrin Market, By Grade, 2023-2030 (US$ Mn)
TABLE 408 China  Maltodextrin Market, By Form, 2017-2022 (US$ Mn)
TABLE 409 China  Maltodextrin Market, By Form, 2023-2030 (US$ Mn)
TABLE 410 China  Maltodextrin Market, By Certification, By Region, 2017-2022 (US$ Mn)
TABLE 411 China  Maltodextrin Market, By Certification, By Region, 2023-2030 (US$ Mn)
TABLE 412 China  Maltodextrin Market, By Distribution Channel, 2017-2022 (US$ Mn)
TABLE 413 China  Maltodextrin Market, By Distribution Channel, 2023-2030 (US$ Mn)
TABLE 414 Japan  Maltodextrin Market, By Type, 2017-2022 (US$ Mn)
TABLE 415 Japan  Maltodextrin Market, By Type, 2023-2030 (US$ Mn)
TABLE 416 Japan  Maltodextrin Market, By DE (Dextrose Equivalent) Level, 2017-2022 (US$ Mn)
TABLE 417 Japan  Maltodextrin Market, By DE (Dextrose Equivalent) Level, 2023-2030 (US$ Mn)
TABLE 418 Japan  Maltodextrin Market, By Source, 2017-2022 (US$ Mn)
TABLE 419 Japan  Maltodextrin Market, By Source, 2023-2030 (US$ Mn)
TABLE 420 Japan Maltodextrin Market, By Application, By Region, 2017-2022 (US$ Mn)
TABLE 421 Japan Maltodextrin Market, By Application, By Region, 2023-2030 (US$ Mn)
TABLE 422 Japan Maltodextrin Market, By Function, 2017-2022 (US$ Mn)
TABLE 423 Japan  Maltodextrin Market, By Function, 2023-2030 (US$ Mn)
TABLE 424 Japan  Maltodextrin Market, By End-Use Industry, 2017-2022 (US$ Mn)
TABLE 425 Japan  Maltodextrin Market, By End-Use Industry, 2023-2030 (US$ Mn)
TABLE 426 Japan  Maltodextrin Market, By Grade, 2017-2022 (US$ Mn)
TABLE 427 Japan  Maltodextrin Market, By Grade, 2023-2030 (US$ Mn)
TABLE 428 Japan  Maltodextrin Market, By Form, 2017-2022 (US$ Mn)
TABLE 429 Japan  Maltodextrin Market, By Form, 2023-2030 (US$ Mn)
TABLE 430 Japan  Maltodextrin Market, By Certification, By Region, 2017-2022 (US$ Mn)
TABLE 431 Japan  Maltodextrin Market, By Certification, By Region, 2023-2030 (US$ Mn)
TABLE 432 Japan  Maltodextrin Market, By Distribution Channel, 2017-2022 (US$ Mn)
TABLE 433 Japan  Maltodextrin Market, By Distribution Channel, 2023-2030 (US$ Mn)
TABLE 434 India  Maltodextrin Market, By Type, 2017-2022 (US$ Mn)
TABLE 435 India  Maltodextrin Market, By Type, 2023-2030 (US$ Mn)
TABLE 436 India  Maltodextrin Market, By DE (Dextrose Equivalent) Level, 2017-2022 (US$ Mn)
TABLE 437 India  Maltodextrin Market, By DE (Dextrose Equivalent) Level, 2023-2030 (US$ Mn)
TABLE 438 India  Maltodextrin Market, By Source, 2017-2022 (US$ Mn)
TABLE 439 India  Maltodextrin Market, By Source, 2023-2030 (US$ Mn)
TABLE 440 India Maltodextrin Market, By Application, By Region, 2017-2022 (US$ Mn)
TABLE 441 India Maltodextrin Market, By Application, By Region, 2023-2030 (US$ Mn)
TABLE 442 India Maltodextrin Market, By Function, 2017-2022 (US$ Mn)
TABLE 443 India  Maltodextrin Market, By Function, 2023-2030 (US$ Mn)
TABLE 444 India  Maltodextrin Market, By End-Use Industry, 2017-2022 (US$ Mn)
TABLE 445 India  Maltodextrin Market, By End-Use Industry, 2023-2030 (US$ Mn)
TABLE 446 India  Maltodextrin Market, By Grade, 2017-2022 (US$ Mn)
TABLE 447 India  Maltodextrin Market, By Grade, 2023-2030 (US$ Mn)
TABLE 448 India  Maltodextrin Market, By Form, 2017-2022 (US$ Mn)
TABLE 449 India  Maltodextrin Market, By Form, 2023-2030 (US$ Mn)
TABLE 450 India  Maltodextrin Market, By Certification, By Region, 2017-2022 (US$ Mn)
TABLE 451 India  Maltodextrin Market, By Certification, By Region, 2023-2030 (US$ Mn)
TABLE 452 India  Maltodextrin Market, By Distribution Channel, 2017-2022 (US$ Mn)
TABLE 453 India  Maltodextrin Market, By Distribution Channel, 2023-2030 (US$ Mn)
TABLE 454 South Korea  Maltodextrin Market, By Type, 2017-2022 (US$ Mn)
TABLE 455 South Korea  Maltodextrin Market, By Type, 2023-2030 (US$ Mn)
TABLE 456 South Korea  Maltodextrin Market, By DE (Dextrose Equivalent) Level, 2017-2022 (US$ Mn)
TABLE 457 South Korea  Maltodextrin Market, By DE (Dextrose Equivalent) Level, 2023-2030 (US$ Mn)
TABLE 458 South Korea  Maltodextrin Market, By Source, 2017-2022 (US$ Mn)
TABLE 459 South Korea  Maltodextrin Market, By Source, 2023-2030 (US$ Mn)
TABLE 460 South Korea Maltodextrin Market, By Application, By Region, 2017-2022 (US$ Mn)
TABLE 461 South Korea Maltodextrin Market, By Application, By Region, 2023-2030 (US$ Mn)
TABLE 462 South Korea Maltodextrin Market, By Function, 2017-2022 (US$ Mn)
TABLE 463 South Korea  Maltodextrin Market, By Function, 2023-2030 (US$ Mn)
TABLE 464 South Korea  Maltodextrin Market, By End-Use Industry, 2017-2022 (US$ Mn)
TABLE 465 South Korea  Maltodextrin Market, By End-Use Industry, 2023-2030 (US$ Mn)
TABLE 466 South Korea  Maltodextrin Market, By Grade, 2017-2022 (US$ Mn)
TABLE 467 South Korea  Maltodextrin Market, By Grade, 2023-2030 (US$ Mn)
TABLE 468 South Korea  Maltodextrin Market, By Form, 2017-2022 (US$ Mn)
TABLE 469 South Korea  Maltodextrin Market, By Form, 2023-2030 (US$ Mn)
TABLE 470 South Korea  Maltodextrin Market, By Certification, By Region, 2017-2022 (US$ Mn)
TABLE 471 South Korea  Maltodextrin Market, By Certification, By Region, 2023-2030 (US$ Mn)
TABLE 472 South Korea  Maltodextrin Market, By Distribution Channel, 2017-2022 (US$ Mn)
TABLE 473 South Korea  Maltodextrin Market, By Distribution Channel, 2023-2030 (US$ Mn)
TABLE 474 South-East Asia  Maltodextrin Market, By Type, 2017-2022 (US$ Mn)
TABLE 475 South-East Asia  Maltodextrin Market, By Type, 2023-2030 (US$ Mn)
TABLE 476 South-East Asia  Maltodextrin Market, By DE (Dextrose Equivalent) Level, 2017-2022 (US$ Mn)
TABLE 477 South-East Asia  Maltodextrin Market, By DE (Dextrose Equivalent) Level, 2023-2030 (US$ Mn)
TABLE 478 South-East Asia  Maltodextrin Market, By Source, 2017-2022 (US$ Mn)
TABLE 479 South-East Asia  Maltodextrin Market, By Source, 2023-2030 (US$ Mn)
TABLE 480 South-East Asia Maltodextrin Market, By Application, By Region, 2017-2022 (US$ Mn)
TABLE 481 South-East Asia Maltodextrin Market, By Application, By Region, 2023-2030 (US$ Mn)
TABLE 482 South-East Asia Maltodextrin Market, By Function, 2017-2022 (US$ Mn)
TABLE 483 South-East Asia  Maltodextrin Market, By Function, 2023-2030 (US$ Mn)
TABLE 484 South-East Asia  Maltodextrin Market, By End-Use Industry, 2017-2022 (US$ Mn)
TABLE 485 South-East Asia  Maltodextrin Market, By End-Use Industry, 2023-2030 (US$ Mn)
TABLE 486 South-East Asia  Maltodextrin Market, By Grade, 2017-2022 (US$ Mn)
TABLE 487 South-East Asia  Maltodextrin Market, By Grade, 2023-2030 (US$ Mn)
TABLE 488 South-East Asia  Maltodextrin Market, By Form, 2017-2022 (US$ Mn)
TABLE 489 South-East Asia  Maltodextrin Market, By Form, 2023-2030 (US$ Mn)
TABLE 490 South-East Asia  Maltodextrin Market, By Certification, By Region, 2017-2022 (US$ Mn)
TABLE 491 South-East Asia  Maltodextrin Market, By Certification, By Region, 2023-2030 (US$ Mn)
TABLE 492 South-East Asia  Maltodextrin Market, By Distribution Channel, 2017-2022 (US$ Mn)
TABLE 493 South-East Asia  Maltodextrin Market, By Distribution Channel, 2023-2030 (US$ Mn)
TABLE 494 Rest of Asia Pacific  Maltodextrin Market, By Type, 2017-2022 (US$ Mn)
TABLE 495 Rest of Asia Pacific  Maltodextrin Market, By Type, 2023-2030 (US$ Mn)
TABLE 496 Rest of Asia Pacific  Maltodextrin Market, By DE (Dextrose Equivalent) Level, 2017-2022 (US$ Mn)
TABLE 497 Rest of Asia Pacific  Maltodextrin Market, By DE (Dextrose Equivalent) Level, 2023-2030 (US$ Mn)
TABLE 498 Rest of Asia Pacific  Maltodextrin Market, By Source, 2017-2022 (US$ Mn)
TABLE 499 Rest of Asia Pacific  Maltodextrin Market, By Source, 2023-2030 (US$ Mn)
TABLE 500 Rest of Asia Pacific Maltodextrin Market, By Application, By Region, 2017-2022 (US$ Mn)
TABLE 501 Rest of Asia Pacific Maltodextrin Market, By Application, By Region, 2023-2030 (US$ Mn)
TABLE 502 Rest of Asia Pacific  Maltodextrin Market, By Function, 2017-2022 (US$ Mn)
TABLE 503 Rest of Asia Pacific Maltodextrin Market, By Function, 2023-2030 (US$ Mn)
TABLE 504 Rest of Asia Pacific  Maltodextrin Market, By End-Use Industry, 2017-2022 (US$ Mn)
TABLE 505 Rest of Asia Pacific  Maltodextrin Market, By End-Use Industry, 2023-2030 (US$ Mn)
TABLE 506 Rest of Asia Pacific  Maltodextrin Market, By Grade, 2017-2022 (US$ Mn)
TABLE 507 Rest of Asia Pacific  Maltodextrin Market, By Grade, 2023-2030 (US$ Mn)
TABLE 508 Rest of Asia Pacific  Maltodextrin Market, By Form, 2017-2022 (US$ Mn)
TABLE 509 Rest of Asia Pacific  Maltodextrin Market, By Form, 2023-2030 (US$ Mn)
TABLE 510 Rest of Asia Pacific  Maltodextrin Market, By Certification, By Region, 2017-2022 (US$ Mn)
TABLE 511 Rest of Asia Pacific  Maltodextrin Market, By Certification, By Region, 2023-2030 (US$ Mn)
TABLE 512 Rest of Asia Pacific  Maltodextrin Market, By Distribution Channel, 2017-2022 (US$ Mn)
TABLE 513 Rest of Asia Pacific  Maltodextrin Market, By Distribution Channel, 2023-2030 (US$ Mn)
TABLE 514 Latin America  Maltodextrin Market, By Type, 2017-2022 (US$ Mn)
TABLE 515 Latin America  Maltodextrin Market, By Type, 2023-2030 (US$ Mn)
TABLE 516 Latin America  Maltodextrin Market, By DE (Dextrose Equivalent) Level, 2017-2022 (US$ Mn)
TABLE 517 Latin America  Maltodextrin Market, By DE (Dextrose Equivalent) Level, 2023-2030 (US$ Mn)
TABLE 518 Latin America  Maltodextrin Market, By Source, 2017-2022 (US$ Mn)
TABLE 519 Latin America  Maltodextrin Market, By Source, 2023-2030 (US$ Mn)
TABLE 520 Latin America Maltodextrin Market, By Application, By Region, 2017-2022 (US$ Mn)
TABLE 521 Latin America Maltodextrin Market, By Application, By Region, 2023-2030 (US$ Mn)
TABLE 522 Latin America Maltodextrin Market, By Function, 2017-2022 (US$ Mn)
TABLE 523 Latin America  Maltodextrin Market, By Function, 2023-2030 (US$ Mn)
TABLE 524 Latin America  Maltodextrin Market, By End-Use Industry, 2017-2022 (US$ Mn)
TABLE 525 Latin America  Maltodextrin Market, By End-Use Industry, 2023-2030 (US$ Mn)
TABLE 526 Latin America  Maltodextrin Market, By Grade, 2017-2022 (US$ Mn)
TABLE 527 Latin America  Maltodextrin Market, By Grade, 2023-2030 (US$ Mn)
TABLE 528 Latin America  Maltodextrin Market, By Form, 2017-2022 (US$ Mn)
TABLE 529 Latin America  Maltodextrin Market, By Form, 2023-2030 (US$ Mn)
TABLE 530 Latin America  Maltodextrin Market, By Certification, By Region, 2017-2022 (US$ Mn)
TABLE 531 Latin America  Maltodextrin Market, By Certification, By Region, 2023-2030 (US$ Mn)
TABLE 532 Latin America  Maltodextrin Market, By Distribution Channel, 2017-2022 (US$ Mn)
TABLE 533 Latin America  Maltodextrin Market, By Distribution Channel, 2023-2030 (US$ Mn)
TABLE 534 Brazil  Maltodextrin Market, By Type, 2017-2022 (US$ Mn)
TABLE 535 Brazil  Maltodextrin Market, By Type, 2023-2030 (US$ Mn)
TABLE 536 Brazil  Maltodextrin Market, By DE (Dextrose Equivalent) Level, 2017-2022 (US$ Mn)
TABLE 537 Brazil  Maltodextrin Market, By DE (Dextrose Equivalent) Level, 2023-2030 (US$ Mn)
TABLE 538 Brazil  Maltodextrin Market, By Source, 2017-2022 (US$ Mn)
TABLE 539 Brazil  Maltodextrin Market, By Source, 2023-2030 (US$ Mn)
TABLE 540 Brazil Maltodextrin Market, By Application, By Region, 2017-2022 (US$ Mn)
TABLE 541 Brazil Maltodextrin Market, By Application, By Region, 2023-2030 (US$ Mn)
TABLE 542 Brazil Maltodextrin Market, By Function, 2017-2022 (US$ Mn)
TABLE 543 Brazil  Maltodextrin Market, By Function, 2023-2030 (US$ Mn)
TABLE 544 Brazil  Maltodextrin Market, By End-Use Industry, 2017-2022 (US$ Mn)
TABLE 545 Brazil  Maltodextrin Market, By End-Use Industry, 2023-2030 (US$ Mn)
TABLE 546 Brazil  Maltodextrin Market, By Grade, 2017-2022 (US$ Mn)
TABLE 547 Brazil  Maltodextrin Market, By Grade, 2023-2030 (US$ Mn)
TABLE 548 Brazil  Maltodextrin Market, By Form, 2017-2022 (US$ Mn)
TABLE 549 Brazil  Maltodextrin Market, By Form, 2023-2030 (US$ Mn)
TABLE 550 Brazil  Maltodextrin Market, By Certification, By Region, 2017-2022 (US$ Mn)
TABLE 551 Brazil  Maltodextrin Market, By Certification, By Region, 2023-2030 (US$ Mn)
TABLE 552 Brazil  Maltodextrin Market, By Distribution Channel, 2017-2022 (US$ Mn)
TABLE 553 Brazil  Maltodextrin Market, By Distribution Channel, 2023-2030 (US$ Mn)
TABLE 554 Argentina  Maltodextrin Market, By Type, 2017-2022 (US$ Mn)
TABLE 555 Argentina  Maltodextrin Market, By Type, 2023-2030 (US$ Mn)
TABLE 556 Argentina  Maltodextrin Market, By DE (Dextrose Equivalent) Level, 2017-2022 (US$ Mn)
TABLE 557 Argentina  Maltodextrin Market, By DE (Dextrose Equivalent) Level, 2023-2030 (US$ Mn)
TABLE 558 Argentina  Maltodextrin Market, By Source, 2017-2022 (US$ Mn)
TABLE 559 Argentina  Maltodextrin Market, By Source, 2023-2030 (US$ Mn)
TABLE 560 Argentina Maltodextrin Market, By Application, By Region, 2017-2022 (US$ Mn)
TABLE 561 Argentina Maltodextrin Market, By Application, By Region, 2023-2030 (US$ Mn)
TABLE 562 Argentina Maltodextrin Market, By Function, 2017-2022 (US$ Mn)
TABLE 563 Argentina  Maltodextrin Market, By Function, 2023-2030 (US$ Mn)
TABLE 564 Argentina  Maltodextrin Market, By End-Use Industry, 2017-2022 (US$ Mn)
TABLE 565 Argentina  Maltodextrin Market, By End-Use Industry, 2023-2030 (US$ Mn)
TABLE 566 Argentina  Maltodextrin Market, By Grade, 2017-2022 (US$ Mn)
TABLE 567 Argentina  Maltodextrin Market, By Grade, 2023-2030 (US$ Mn)
TABLE 568 Argentina  Maltodextrin Market, By Form, 2017-2022 (US$ Mn)
TABLE 569 Argentina  Maltodextrin Market, By Form, 2023-2030 (US$ Mn)
TABLE 570 Argentina  Maltodextrin Market, By Certification, By Region, 2017-2022 (US$ Mn)
TABLE 571 Argentina  Maltodextrin Market, By Certification, By Region, 2023-2030 (US$ Mn)
TABLE 572 Argentina  Maltodextrin Market, By Distribution Channel, 2017-2022 (US$ Mn)
TABLE 573 Argentina  Maltodextrin Market, By Distribution Channel, 2023-2030 (US$ Mn)
TABLE 574 Rest of Latin America  Maltodextrin Market, By Type, 2017-2022 (US$ Mn)
TABLE 575 Rest of Latin America  Maltodextrin Market, By Type, 2023-2030 (US$ Mn)
TABLE 576 Rest of Latin America  Maltodextrin Market, By DE (Dextrose Equivalent) Level, 2017-2022 (US$ Mn)
TABLE 577 Rest of Latin America  Maltodextrin Market, By DE (Dextrose Equivalent) Level, 2023-2030 (US$ Mn)
TABLE 578 Rest of Latin America  Maltodextrin Market, By Source, 2017-2022 (US$ Mn)
TABLE 579 Rest of Latin America  Maltodextrin Market, By Source, 2023-2030 (US$ Mn)
TABLE 580 Rest of Latin America Maltodextrin Market, By Application, By Region, 2017-2022 (US$ Mn)
TABLE 581 Rest of Latin America Maltodextrin Market, By Application, By Region, 2023-2030 (US$ Mn)
TABLE 582 Rest of Latin America Maltodextrin Market, By Function, 2017-2022 (US$ Mn)
TABLE 583 Rest of Latin America  Maltodextrin Market, By Function, 2023-2030 (US$ Mn)
TABLE 584 Rest of Latin America  Maltodextrin Market, By End-Use Industry, 2017-2022 (US$ Mn)
TABLE 585 Rest of Latin America  Maltodextrin Market, By End-Use Industry, 2023-2030 (US$ Mn)
TABLE 586 Rest of Latin America  Maltodextrin Market, By Grade, 2017-2022 (US$ Mn)
TABLE 587 Rest of Latin America  Maltodextrin Market, By Grade, 2023-2030 (US$ Mn)
TABLE 588 Rest of Latin America  Maltodextrin Market, By Form, 2017-2022 (US$ Mn)
TABLE 589 Rest of Latin America  Maltodextrin Market, By Form, 2023-2030 (US$ Mn)
TABLE 590 Rest of Latin America  Maltodextrin Market, By Certification, By Region, 2017-2022 (US$ Mn)
TABLE 591 Rest of Latin America  Maltodextrin Market, By Certification, By Region, 2023-2030 (US$ Mn)
TABLE 592 Rest of Latin America  Maltodextrin Market, By Distribution Channel, 2017-2022 (US$ Mn)
TABLE 593 Rest of Latin America  Maltodextrin Market, By Distribution Channel, 2023-2030 (US$ Mn)
TABLE 594 Middle East Maltodextrin Market, By Type, 2017-2022 (US$ Mn)
TABLE 595 Middle East Maltodextrin Market, By Type, 2023-2030 (US$ Mn)
TABLE 596 Middle East Maltodextrin Market, By DE (Dextrose Equivalent) Level, 2017-2022 (US$ Mn)
TABLE 597 Middle East Maltodextrin Market, By DE (Dextrose Equivalent) Level, 2023-2030 (US$ Mn)
TABLE 598 Middle East Maltodextrin Market, By Source, 2017-2022 (US$ Mn)
TABLE 599 Middle East Maltodextrin Market, By Source, 2023-2030 (US$ Mn)
TABLE 600 Middle East Maltodextrin Market, By Application, By Region, 2017-2022 (US$ Mn)
TABLE 601 Middle East Maltodextrin Market, By Application, By Region, 2023-2030 (US$ Mn)
TABLE 602 Middle East Maltodextrin Market, By Function, 2017-2022 (US$ Mn)
TABLE 603 Middle East  Maltodextrin Market, By Function, 2023-2030 (US$ Mn)
TABLE 604 Middle East  Maltodextrin Market, By End-Use Industry, 2017-2022 (US$ Mn)
TABLE 605 Middle East  Maltodextrin Market, By End-Use Industry, 2023-2030 (US$ Mn)
TABLE 606 Middle East  Maltodextrin Market, By Grade, 2017-2022 (US$ Mn)
TABLE 607 Middle East  Maltodextrin Market, By Grade, 2023-2030 (US$ Mn)
TABLE 608 Middle East  Maltodextrin Market, By Form, 2017-2022 (US$ Mn)
TABLE 609 Middle East  Maltodextrin Market, By Form, 2023-2030 (US$ Mn)
TABLE 610 Middle East  Maltodextrin Market, By Certification, By Region, 2017-2022 (US$ Mn)
TABLE 611 Middle East  Maltodextrin Market, By Certification, By Region, 2023-2030 (US$ Mn)
TABLE 612 Middle East  Maltodextrin Market, By Distribution Channel, 2017-2022 (US$ Mn)
TABLE 613 Middle East  Maltodextrin Market, By Distribution Channel, 2023-2030 (US$ Mn)
TABLE 614 UAE Maltodextrin Market, By Type, 2017-2022 (US$ Mn)
TABLE 615 UAE Maltodextrin Market, By Type, 2023-2030 (US$ Mn)
TABLE 616 UAE Maltodextrin Market, By DE (Dextrose Equivalent) Level, 2017-2022 (US$ Mn)
TABLE 617 UAE Maltodextrin Market, By DE (Dextrose Equivalent) Level, 2023-2030 (US$ Mn)
TABLE 618 UAE Maltodextrin Market, By Source, 2017-2022 (US$ Mn)
TABLE 619 UAE Maltodextrin Market, By Source, 2023-2030 (US$ Mn)
TABLE 620 UAE Maltodextrin Market, By Application, By Region, 2017-2022 (US$ Mn)
TABLE 621 UAE Maltodextrin Market, By Application, By Region, 2023-2030 (US$ Mn)
TABLE 622 UAE Maltodextrin Market, By Function, 2017-2022 (US$ Mn)
TABLE 623 UAE  Maltodextrin Market, By Function, 2023-2030 (US$ Mn)
TABLE 624 UAE  Maltodextrin Market, By End-Use Industry, 2017-2022 (US$ Mn)
TABLE 625 UAE  Maltodextrin Market, By End-Use Industry, 2023-2030 (US$ Mn)
TABLE 626 UAE  Maltodextrin Market, By Grade, 2017-2022 (US$ Mn)
TABLE 627 UAE  Maltodextrin Market, By Grade, 2023-2030 (US$ Mn)
TABLE 628 UAE  Maltodextrin Market, By Form, 2017-2022 (US$ Mn)
TABLE 629 UAE  Maltodextrin Market, By Form, 2023-2030 (US$ Mn)
TABLE 630 UAE  Maltodextrin Market, By Certification, By Region, 2017-2022 (US$ Mn)
TABLE 631 UAE  Maltodextrin Market, By Certification, By Region, 2023-2030 (US$ Mn)
TABLE 632 UAE  Maltodextrin Market, By Distribution Channel, 2017-2022 (US$ Mn)
TABLE 633 UAE  Maltodextrin Market, By Distribution Channel, 2023-2030 (US$ Mn)
TABLE 634 Saudi Arabia Maltodextrin Market, By Type, 2017-2022 (US$ Mn)
TABLE 635 Saudi Arabia Maltodextrin Market, By Type, 2023-2030 (US$ Mn)
TABLE 636 Saudi Arabia Maltodextrin Market, By DE (Dextrose Equivalent) Level, 2017-2022 (US$ Mn)
TABLE 637 Saudi Arabia Maltodextrin Market, By DE (Dextrose Equivalent) Level, 2023-2030 (US$ Mn)
TABLE 638 Saudi Arabia Maltodextrin Market, By Source, 2017-2022 (US$ Mn)
TABLE 639 Saudi Arabia Maltodextrin Market, By Source, 2023-2030 (US$ Mn)
TABLE 640 Saudi Arabia Maltodextrin Market, By Application, By Region, 2017-2022 (US$ Mn)
TABLE 641 Saudi Arabia Maltodextrin Market, By Application, By Region, 2023-2030 (US$ Mn)
TABLE 642 Saudi Arabia Maltodextrin Market, By Function, 2017-2022 (US$ Mn)
TABLE 643 Saudi Arabia  Maltodextrin Market, By Function, 2023-2030 (US$ Mn)
TABLE 644 Saudi Arabia  Maltodextrin Market, By End-Use Industry, 2017-2022 (US$ Mn)
TABLE 645 Saudi Arabia  Maltodextrin Market, By End-Use Industry, 2023-2030 (US$ Mn)
TABLE 646 Saudi Arabia  Maltodextrin Market, By Grade, 2017-2022 (US$ Mn)
TABLE 647 Saudi Arabia  Maltodextrin Market, By Grade, 2023-2030 (US$ Mn)
TABLE 648 Saudi Arabia  Maltodextrin Market, By Form, 2017-2022 (US$ Mn)
TABLE 649 Saudi Arabia  Maltodextrin Market, By Form, 2023-2030 (US$ Mn)
TABLE 650 Saudi Arabia  Maltodextrin Market, By Certification, By Region, 2017-2022 (US$ Mn)
TABLE 651 Saudi Arabia  Maltodextrin Market, By Certification, By Region, 2023-2030 (US$ Mn)
TABLE 652 Saudi Arabia  Maltodextrin Market, By Distribution Channel, 2017-2022 (US$ Mn)
TABLE 653 Saudi Arabia  Maltodextrin Market, By Distribution Channel, 2023-2030 (US$ Mn)
TABLE 654 Rest of Middle East Maltodextrin Market, By Type, 2017-2022 (US$ Mn)
TABLE 655 Rest of Middle East Maltodextrin Market, By Type, 2023-2030 (US$ Mn)
TABLE 656 Rest of Middle East Maltodextrin Market, By DE (Dextrose Equivalent) Level, 2017-2022 (US$ Mn)
TABLE 657 Rest of Middle East Maltodextrin Market, By DE (Dextrose Equivalent) Level, 2023-2030 (US$ Mn)
TABLE 658 Rest of Middle East Maltodextrin Market, By Source, 2017-2022 (US$ Mn)
TABLE 659 Rest of Middle East Maltodextrin Market, By Source, 2023-2030 (US$ Mn)
TABLE 660 Rest of Middle East Maltodextrin Market, By Application, By Region, 2017-2022 (US$ Mn)
TABLE 661 Rest of Middle East Maltodextrin Market, By Application, By Region, 2023-2030 (US$ Mn)
TABLE 662 Rest of Middle East Maltodextrin Market, By Function, 2017-2022 (US$ Mn)
TABLE 663 Rest of Middle East  Maltodextrin Market, By Function, 2023-2030 (US$ Mn)
TABLE 664 Rest of Middle East  Maltodextrin Market, By End-Use Industry, 2017-2022 (US$ Mn)
TABLE 665 Rest of Middle East  Maltodextrin Market, By End-Use Industry, 2023-2030 (US$ Mn)
TABLE 666 Rest of Middle East  Maltodextrin Market, By Grade, 2017-2022 (US$ Mn)
TABLE 667 Rest of Middle East  Maltodextrin Market, By Grade, 2023-2030 (US$ Mn)
TABLE 668 Rest of Middle East  Maltodextrin Market, By Form, 2017-2022 (US$ Mn)
TABLE 669 Rest of Middle East  Maltodextrin Market, By Form, 2023-2030 (US$ Mn)
TABLE 670 Rest of Middle East  Maltodextrin Market, By Certification, By Region, 2017-2022 (US$ Mn)
TABLE 671 Rest of Middle East  Maltodextrin Market, By Certification, By Region, 2023-2030 (US$ Mn)
TABLE 672 Rest of Middle East  Maltodextrin Market, By Distribution Channel, 2017-2022 (US$ Mn)
TABLE 673 Rest of Middle East  Maltodextrin Market, By Distribution Channel, 2023-2030 (US$ Mn)
TABLE 674 Africa  Maltodextrin Market, By Type, 2017-2022 (US$ Mn)
TABLE 675 Africa Maltodextrin Market, By Type, 2023-2030 (US$ Mn)
TABLE 676 Africa Maltodextrin Market, By DE (Dextrose Equivalent) Level, 2017-2022 (US$ Mn)
TABLE 677 Africa Maltodextrin Market, By DE (Dextrose Equivalent) Level, 2023-2030 (US$ Mn)
TABLE 678 Africa Maltodextrin Market, By Source, 2017-2022 (US$ Mn)
TABLE 679 Africa Maltodextrin Market, By Source, 2023-2030 (US$ Mn)
TABLE 680 Africa Maltodextrin Market, By Application, By Region, 2017-2022 (US$ Mn)
TABLE 681 Africa Maltodextrin Market, By Application, By Region, 2023-2030 (US$ Mn)
TABLE 682 Africa Maltodextrin Market, By Function, 2017-2022 (US$ Mn)
TABLE 683 Africa  Maltodextrin Market, By Function, 2023-2030 (US$ Mn)
TABLE 684 Africa  Maltodextrin Market, By End-Use Industry, 2017-2022 (US$ Mn)
TABLE 685 Africa  Maltodextrin Market, By End-Use Industry, 2023-2030 (US$ Mn)
TABLE 686 Africa  Maltodextrin Market, By Grade, 2017-2022 (US$ Mn)
TABLE 687 Africa  Maltodextrin Market, By Grade, 2023-2030 (US$ Mn)
TABLE 688 Africa  Maltodextrin Market, By Form, 2017-2022 (US$ Mn)
TABLE 689 Africa  Maltodextrin Market, By Form, 2023-2030 (US$ Mn)
TABLE 690 Africa  Maltodextrin Market, By Certification, By Region, 2017-2022 (US$ Mn)
TABLE 691 Africa  Maltodextrin Market, By Certification, By Region, 2023-2030 (US$ Mn)
TABLE 692 Africa  Maltodextrin Market, By Distribution Channel, 2017-2022 (US$ Mn)
TABLE 693 Africa  Maltodextrin Market, By Distribution Channel, 2023-2030 (US$ Mn)
TABLE 694 South Africa  Maltodextrin Market, By Type, 2017-2022 (US$ Mn)
TABLE 695 South Africa Maltodextrin Market, By Type, 2023-2030 (US$ Mn)
TABLE 696 South Africa Maltodextrin Market, By DE (Dextrose Equivalent) Level, 2017-2022 (US$ Mn)
TABLE 697 South Africa Maltodextrin Market, By DE (Dextrose Equivalent) Level, 2023-2030 (US$ Mn)
TABLE 698 South Africa Maltodextrin Market, By Source, 2017-2022 (US$ Mn)
TABLE 699 South Africa Maltodextrin Market, By Source, 2023-2030 (US$ Mn)
TABLE 700 South Africa Maltodextrin Market, By Application, By Region, 2017-2022 (US$ Mn)
TABLE 701 South Africa Maltodextrin Market, By Application, By Region, 2023-2030 (US$ Mn)
TABLE 702 South Africa Maltodextrin Market, By Function, 2017-2022 (US$ Mn)
TABLE 703 South Africa  Maltodextrin Market, By Function, 2023-2030 (US$ Mn)
TABLE 704 South Africa  Maltodextrin Market, By End-Use Industry, 2017-2022 (US$ Mn)
TABLE 705 South Africa  Maltodextrin Market, By End-Use Industry, 2023-2030 (US$ Mn)
TABLE 706 South Africa  Maltodextrin Market, By Grade, 2017-2022 (US$ Mn)
TABLE 707 South Africa  Maltodextrin Market, By Grade, 2023-2030 (US$ Mn)
TABLE 708 South Africa  Maltodextrin Market, By Form, 2017-2022 (US$ Mn)
TABLE 709 South Africa  Maltodextrin Market, By Form, 2023-2030 (US$ Mn)
TABLE 710 South Africa  Maltodextrin Market, By Certification, By Region, 2017-2022 (US$ Mn)
TABLE 711 South Africa  Maltodextrin Market, By Certification, By Region, 2023-2030 (US$ Mn)
TABLE 712 South Africa  Maltodextrin Market, By Distribution Channel, 2017-2022 (US$ Mn)
TABLE 713 South Africa  Maltodextrin Market, By Distribution Channel, 2023-2030 (US$ Mn)
TABLE 714 Egypt Maltodextrin Market, By Type, 2017-2022 (US$ Mn)
TABLE 715 Egypt Maltodextrin Market, By Type, 2023-2030 (US$ Mn)
TABLE 716 Egypt Maltodextrin Market, By DE (Dextrose Equivalent) Level, 2017-2022 (US$ Mn)
TABLE 717 Egypt Maltodextrin Market, By DE (Dextrose Equivalent) Level, 2023-2030 (US$ Mn)
TABLE 718 Egypt Maltodextrin Market, By Source, 2017-2022 (US$ Mn)
TABLE 719 Egypt Maltodextrin Market, By Source, 2023-2030 (US$ Mn)
TABLE 720 Egypt Maltodextrin Market, By Application, By Region, 2017-2022 (US$ Mn)
TABLE 721 Egypt Maltodextrin Market, By Application, By Region, 2023-2030 (US$ Mn)
TABLE 722 Egypt Maltodextrin Market, By Function, 2017-2022 (US$ Mn)
TABLE 723 Egypt  Maltodextrin Market, By Function, 2023-2030 (US$ Mn)
TABLE 724 Egypt  Maltodextrin Market, By End-Use Industry, 2017-2022 (US$ Mn)
TABLE 725 Egypt  Maltodextrin Market, By End-Use Industry, 2023-2030 (US$ Mn)
TABLE 726 Egypt  Maltodextrin Market, By Grade, 2017-2022 (US$ Mn)
TABLE 727 Egypt  Maltodextrin Market, By Grade, 2023-2030 (US$ Mn)
TABLE 728 Egypt  Maltodextrin Market, By Form, 2017-2022 (US$ Mn)
TABLE 729 Egypt  Maltodextrin Market, By Form, 2023-2030 (US$ Mn)
TABLE 730 Egypt  Maltodextrin Market, By Certification, By Region, 2017-2022 (US$ Mn)
TABLE 731 Egypt  Maltodextrin Market, By Certification, By Region, 2023-2030 (US$ Mn)
TABLE 732 Egypt  Maltodextrin Market, By Distribution Channel, 2017-2022 (US$ Mn)
TABLE 733 Egypt  Maltodextrin Market, By Distribution Channel, 2023-2030 (US$ Mn)
TABLE 734 Rest of Africa Maltodextrin Market, By Type, 2017-2022 (US$ Mn)
TABLE 735 Rest of Africa Maltodextrin Market, By Type, 2023-2030 (US$ Mn)
TABLE 736 Rest of Africa Maltodextrin Market, By DE (Dextrose Equivalent) Level, 2017-2022 (US$ Mn)
TABLE 737 Rest of Africa Maltodextrin Market, By DE (Dextrose Equivalent) Level, 2023-2030 (US$ Mn)
TABLE 738 Rest of Africa Maltodextrin Market, By Source, 2017-2022 (US$ Mn)
TABLE 739 Rest of Africa Maltodextrin Market, By Source, 2023-2030 (US$ Mn)
TABLE 740 Rest of Africa Maltodextrin Market, By Application, By Region, 2017-2022 (US$ Mn)
TABLE 741 Rest of Africa Maltodextrin Market, By Application, By Region, 2023-2030 (US$ Mn)
TABLE 742 Rest of Africa Maltodextrin Market, By Function, 2017-2022 (US$ Mn)
TABLE 743 Rest of Africa  Maltodextrin Market, By Function, 2023-2030 (US$ Mn)
TABLE 744 Rest of Africa  Maltodextrin Market, By End-Use Industry, 2017-2022 (US$ Mn)
TABLE 745 Rest of Africa  Maltodextrin Market, By End-Use Industry, 2023-2030 (US$ Mn)
TABLE 746 Rest of Africa  Maltodextrin Market, By Grade, 2017-2022 (US$ Mn)
TABLE 747 Rest of Africa  Maltodextrin Market, By Grade, 2023-2030 (US$ Mn)
TABLE 748 Rest of Africa  Maltodextrin Market, By Form, 2017-2022 (US$ Mn)
TABLE 749 Rest of Africa  Maltodextrin Market, By Form, 2023-2030 (US$ Mn)
TABLE 750 Rest of Africa  Maltodextrin Market, By Certification, By Region, 2017-2022 (US$ Mn)
TABLE 751 Rest of Africa  Maltodextrin Market, By Certification, By Region, 2023-2030 (US$ Mn)
TABLE 752 Rest of Africa  Maltodextrin Market, By Distribution Channel, 2017-2022 (US$ Mn)
What is the current size of the global Maltodextrin Market?

The global Maltodextrin Market was valued at USD 3.6 Million in 2023.

What is the expected growth rate of the Maltodextrin Market between 2024 and 2032?

The Maltodextrin Market is expected to grow at a CAGR of 5.00% between 2024 and 2032, reaching USD 5.58 Million in 2032.

Which segment is leading the market share in terms of Form?

In 2022, the powder maltodextrin segment led the market.

Which Certification segment governs the demand for Function?

The non-GMO maltodextrin category has the largest market demand.

Which Grade segment is expected to post the fastest growing during the forecast period?

Food Grade Maltodextrin is the fastest expanding segment

Who are the major players in the global Maltodextrin Market?

The top players include Hunan Er-Kang Pharmaceutical Co., Ltd (China), American Key Food Products (U.S.), Cargill, Incorporated (U.S.), SPAC Starch Products (India) Ltd (India) and Others.

Curcumin Market

Published:
Report ID: 4031

Corn Oil Market

Published:
Report ID: 3513

ASEAN Dysphagia Diet Thickening Agents Market

Published:
Report ID: 34321

Weight Loss and Weight Management Diet Market

Published:
Report ID: 32001

South Africa Ethnic Foods Market

Published:
Report ID: 33893

Malaysia Meat Market

Published:
Report ID: 29262

Ethnic Foods Market

Published:
Report ID: 24068

Food Waste Disposable Units Market

Published:
Report ID: 33778

Australia Ethnic Foods Market

Published:
Report ID: 33763

Food Microencapsulation Market

Published:
Report ID: 33670

Soil Fertility Testing Market

Published:
Report ID: 33658

Fructooligosaccharides (FOS) Market

Published:
Report ID: 5708

Purchase Options

$2999
Delivery Format: Excel.
$4999
Designed for the individual purchaser.
$6999
Users located at a single corporate site or regional office.
$7999
Allowed for unlimited sharing globally within one company.
Smallform of Sample request

Have a question?

User Profile

Don’t settle for less – trust Mitul to help you find the best solution.

Report delivery within 24 to 48 hours

– Other Info –

What people say?-

User Review

I am very impressed with the information in this report. The author clearly did their research when they came up with this product and it has already given me a lot of ideas.

Jana Schmidt
CEDAR CX Technologies

– Connect with us –

Phone

+91 6232 49 3207


support

24/7 Research Support


sales@credenceresearch.com

– Research Methodology –

Going beyond the basics: advanced techniques in research methodology

– Trusted By –

Pepshi, LG, Nestle
Motorola, Honeywell, Johnson and johnson
LG Chem, SIEMENS, Pfizer
Unilever, Samsonite, QIAGEN