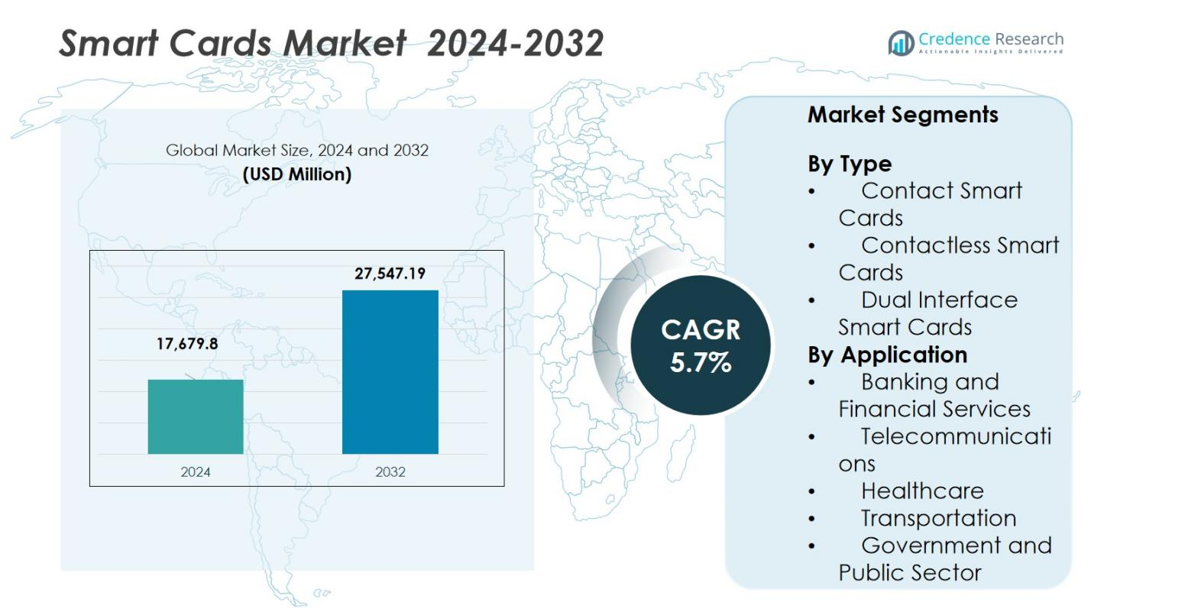
Global Smart Cards Market By Type (Contact-Based Smart Cards, Contactless Smart Cards, Dual-Interface Smart Cards, Hybrid Smart Cards), By Component (Microcontroller-Based Smart Cards, Memory Card-Based Smart Cards), By Application (Smart Cards Market For Telecommunication, Smart Cards Market For Payment, Smart Cards Market For Security, Smart Cards Market For Healthcare Informatics) – Growth, Share, Opportunities & Competitive Analysis, 2016 – 2030

Price: $4999

Published: | Report ID: 10079 | Report Format : PDF

Key Highlights of the Report

How are the major segments performing in the Smart Cards market?

  • In 2022, the Memory segment accounted for the largest market share. Demand for the microcontroller-based category is anticipated to be driven by benefits related to extended durability and fraud prevention capabilities.
  • In 2022, the Contact segment was anticipated to hold a prominent global Smart Cards market share. Contact-based cards’ lower costs are the primary factors influencing the segment’s growth.
  • In 2022, the Transaction segment accounted for the largest market share due to greater demand for efficient and secure financial transactions.
  • In 2022, the Smart Card segment was anticipated to hold a major share of the global Smart Cards market as applications for smart cards are numerous and include safe access systems, government identity, payment systems, and healthcare.
  • In 2022, the BFSI segment accounted for the largest market share. This product has several advantages in banking and financial institutions, including safe data transfer and personal data protection.

What is the Market Size of Smart Cards regarding value?

The global Smart Cards market is anticipated to grow at a substantial CAGR of 4.50% in the upcoming years. The global Smart Cards industry was estimated to be worth USD 14.5 billion in 2022 and was expected to be worth USD 19.73 billion by 2030.

Design Element 2

Access crucial information at unmatched prices!

Request your free sample report today & start making informed decisions powered by Credence Research!

Download Free Sample
CTA Design Element 3

Which Region dominated the Smart Cards market?

The worldwide smart card market is anticipated to be dominated by North America and Europe. Due to the significant presence of well-known smart card makers, the Asia Pacific region holds the highest share of the worldwide smart card market. The demand for smart cards is also likely supported by favorable governmental support for developing commercial and infrastructural facilities in the Region, including those for transportation, government, banking, and the financial sector.

Which are the key countries in the Smart Cards market?

A big consumer base and major smart card manufacturers in China are expected to result in a strong demand for smart cards in the Region. Smart cards were adopted by several banking institutions, which helped the market expand.

Germany will continue to dominate the European Region in 2022. Residents of 32 countries can obtain free European Health Insurance Cards. Numerous European nations have their own national healthcare identification cards. These elements are expected to accelerate market expansion.

How is the economy impacting the global Smart Cards growth?

Due to the tight lockdowns and social seclusion used to stop the COVID-19 virus’s spread, the smart card market suffered. The uncertain economy, a partial corporate shutdown, and poor consumer confidence impacted the demand for intelligent solar technology. During the epidemic, the supply chain was impeded along with logistics operations. However, because of the loosening of limitations and the quickening growth of the e-commerce sector, the smart card industry is anticipated to pick up speed in the post-pandemic environment.

What is the competitive environment of the Smart Cards market?

Vendors invest in new product launches, geographic expansions, alliances, and acquisitions to stay competitive. For example, Infineon and IDEX Biometrics unveiled a platform for biometric smart cards in July 2021. This platform offers superior performance and scalable, affordable manufacturing. The level of the card system is substantially improved by this new design, which makes it simple to integrate into the current hot lamination card manufacturing processes. The architecture simultaneously lowers manufacturing sophistication while improving card performance. A new card with a biometric sensor was introduced in July 2021 by Gemalto NV, giving users increased security. The contactless biometric card offers a crucial degree of privacy while facilitating proximity payments.

Smart Cards Market

Executive Summary

What are the key trends in the Smart Cards market?

  • Smart cards can be used to conduct secure transactions and grant secure access to various services with several devices, including card readers, point-of-sale (POS) terminals, and automated teller machines (ATMs). Traditional magnetic stripe cards cannot offer the same level of security as the embedded chip on the card.
  • The main factors impacting the growth of the smart card market are the rising need for safe and convenient payment methods and the rising demand for safe identification and authentication. Smart cards are frequently employed for identity and authentication applications, such as access control, secure login, and digital signatures. The need for smart cards is anticipated to rise as more sectors require secure identity verification.

How are Growing Adoption of Digital Payments Affecting the Growth of the Smart Cards Market?

According to a recent demand analysis of smart cards, the industry is anticipated to grow in acceptance of digital payment technologies over traditional cash-based payments due to their increased convenience and security. For convenience, users pay with smart cards online rather than cash when the item is delivered. Because smart card-based transactions are extremely secure, smart cards guarantee privacy and facilitate the simple maintenance of payment data. Rapid urbanization and rising industrialization in developing nations like India, China, Mexico, South Africa, and Brazil offer attractive opportunities for participants in the worldwide smart card market. The smart card market is also being driven by the growth of the markets for prepaid credit cards, contactless smart cards, and universal smart cards, which are increasingly used to execute financial transactions.

Which are the key investments by the Smart Cards market players?

The major manufacturers are spending more money on research and development projects to release a cutting-edge line of smart cards on the market to meet the growing demand for smart cards. Motiv ICT Security, one of the top Managed Security Services (MSS) companies, was purchased by Atos in February 2021. Atos will become the third-largest provider of managed security services by enhancing regional capabilities and investing in the Managed Detection and Response (MDR) platform.

Some major players in the Smart Cards market are Samsung Electronics Co. Ltd., Sony Corporation, CPI Card Company, Square Inc., Francisco Partners, Inteligensa Group, Infineon Technologies AG, NXP Semiconductors N.V., CARD Corporation, Giesecke & Devrient (G&D) GmbH, Ingenico, and others.

What are the Major Driving Factors for the Smart Cards Market?

Since the invention of smart cards, several decades have passed. Smart apps now offer a vastly expanded range of functions, from allowing mobile communication to providing smart card control. Smart card-based solutions, including contactless, contact-based, hybrid, and dual interface cards, are being employed in increasing industrial verticals. The Covid-19 pandemic is the root cause of this. This has increased the need for smart cards across the board.

Additionally, the use of smart cards has significantly expanded due to travel limitations and the widespread acceptance of the work-from-home paradigm during the epidemic. Digital payment methods like tap and pay cards are becoming more well-known to consumers. Tap and pay cards are one of the latest market trends. Consequently, customer demand for tap and pay cards is one of the key factors driving the market’s expansion. Due to rising smartphone ownership and internet usage globally, the global smart card industry is growing considerably. In addition, the growing desire for more secure financial applications in emerging countries has fuelled demand for smart cards. Consumers can utilize smart cards across several organizations with ease and security.

What are the Major Risks for the Smart Cards Market?

It is anticipated that with high infrastructure costs, security, and data theft worries, the introduction of mobile wallets, which impact demand for smart cards, would restrain market expansion. Additionally, it is anticipated that the absence of smart card standards, growing security concerns, and rising adoption of digital identity cards will challenge the smart card market during the forecast period.

Which is the key Interface in the Smart Cards market?

The contact segment is anticipated to grow during the forecast period. The segment growth is anticipated to be boosted by the increasing use of contactless smart cards due to their advantages over contact-based smart cards and the lack of a reader required. They establish wireless communication between the smart card and the location where it is meant to be used via NFC technology or radio frequencies.

How is the Smart Cards market performing in regions?

Asia-Pacific is another region projected to follow North America’s market trajectory in the coming years. Because of its greater rate of smart card adoption and the resulting demand from BFSI, healthcare, retail, and government, the Asia Pacific region is predicted to dominate the global smart card market. Several banks operating in the Region have partnered with smart card creators to establish various types of smart cards in the nation. The use of smart cards by other end users is a recent development and endeavor that supports market expansion.

What is the regulatory landscape for the Smart Cards market?

Currently, smart card technology is acknowledged as the most suitable technology for identity applications that must adhere to stringent security standards. Smart cards are used in numerous nations’ payment, secure identity, and healthcare systems. Public corporations also utilize smart employee ID cards to control network access, computer systems, and physical buildings. In addition to mandating smart cards in new identity programs for residents, transportation workers, and first responders, the U.S. Federal government has made smart cards the standard for identification cards for employees and contractors.

Shape Your Report to Specific Countries or Regions & Enjoy 30% Off!

What are the major players planning for the future of the Smart Cards market?

Due to the recent introduction of additional security and privacy concerns for enhanced smart card security applications, the demand for smart cards has increased yearly, with applications in many end-use sector markets. The market for smart cards is anticipated to be dominated by the banking and financial sector globally. Security remains the key priority because crucial financial operations are the industry’s foundation. This encourages the sector to accept the smart card and fosters the development of sophisticated authentication systems.

REPORT ATTRIBUTE DETAILS
Smart Cards Market by Value Yes
Smart Cards Market, Tornado Analysis Yes
Smart Cards Market, STAR Analysis Yes
Smart Cards Market, SRC Analysis Yes
Smart Cards Market Pricing Analysis Yes (On Demand)
Smart Cards Market Segment Analysis By Type (Memory and MPU Microprocessor)

By Interface (Contact, Contactless, and Dual)

By Functionality (Transaction, Communication, and Security & Access Control)

By Offering (Smart Card and Smart Card Readers)

By Vertical (BFSI, Telecommunication, Government and Healthcare, Education, Retail, Transportation, and Others)

Smart Cards Market, Regional Analysis North America (US and Canada)

Europe (Germany, UK, France, Italy, Spain, and Rest of Europe)

Asia Pacific (China, India, Japan, South Korea, South East Asia, and Rest of Asia Pacific)

Latin America (Brazil, Mexico, and Rest of Latin America)

Middle East and Africa (GCC Countries, South Africa, and the Rest of the Middle East and Africa)

Smart Cards Market Key Companies Samsung Electronics Co. Ltd., Sony Corporation, CPI Card Company, Square Inc., Francisco Partners, Intelligence Group, Infineon Technologies AG, NXP Semiconductors N.V., CARD Corporation, Giesecke & Devrient (G&D) GmbH, Ingenico, and others.
Smart Cards Market Competitive Landscape Market Share Analysis

Competitive Benchmarking

Key Players Market Positioning

Geographical Presence Analysis

Major Strategies Adopted

Segmentation of Global Smart Cards Market-

Global Smart Cards Market – By Type

  • Memory
  • MPU Microprocessor

Global Smart Cards Market – By Interface

  • Contact
  • Contactless
  • Dual

Global Smart Cards Market – By Functionality

  • Transaction
  • Communication
  • Security & Access Control

Global Smart Cards Market – By Offering

  • Smart Card
  • Smart Card Readers

Global Smart Cards Market – By Vertical

  • BFSI
  • Telecommunication
  • Government and Healthcare
  • Education
  • Retail
  • Transportation
  • Others

Global Smart Cards Market – By Region

  • North America
    • U.S.
    • Canada
  • Europe
    • Germany
    • France
    • U.K.
    • Italy
    • Spain
    • Rest of Europe
  • Asia Pacific
    • China
    • Japan
    • India
    • South Korea
    • South-east Asia
    • Rest of Asia Pacific
  • Latin America
    • Brazil
    • Mexico
    • Rest of Latin America
  • Middle East & Africa
    • GCC Countries
    • South Africa
    • Rest of the Middle East and Africa

1. Preface
1.1. Report Description
1.1.1. Purpose of the Report
1.1.2. Target Audience
1.1.3. USP and Key Offerings
1.2. Research Scope
1.3. Research Methodology
1.3.1. Phase I – Secondary Research
1.3.2. Phase II – Data Modelling
1.3.2.1. Company Share Analysis Model
1.3.2.2. Revenue Based Modelling
1.3.3. Phase III – Primary Research
1.3.4. Research Limitations
1.3.5. Assumptions
1.4. Market Introduction
1.5. Market Research Scope

2. Executive Summary
2.1. Market Snapshot: Global Smart Cards Market
2.2. Global Smart Cards Market, By Type
2.3. Global Smart Cards Market, By Interface
2.4. Global Smart Cards Market, By Functionality
2.5. Global Smart Cards Market, By Offering
2.6. Global Smart Cards Market, By Vertical
2.7. Global Smart Cards Market, By Region

3. Market Dynamics & Factors Analysis
3.1. Introduction
3.1.1. Global Smart Cards Market Value, 2017-2030, (US$ Mn)
3.1.2. Y-o-Y Growth Trend Analysis
3.2. Market Dynamics
3.2.1. Market Drivers
3.2.1.1. Driver 1
3.2.1.2. Driver 2
3.2.1.3. Driver 3
3.2.2. Market Restraints
3.2.2.1. Restraint 1
3.2.2.2. Restraint 2
3.2.3. Market Opportunities
3.2.3.1. Opportunity 1
3.2.3.2. Opportunity 2
3.2.4. Major Industry Challenges
3.2.4.1. Challenge 1
3.2.4.2. Challenge 2
3.3. Growth and Development Patterns
3.4. Investment Feasibility Analysis
3.5. Market Opportunity Analysis
3.5.1. Type
3.5.2. Interface
3.5.3. Functionality
3.5.4. Offering
3.5.5. Vertical
3.5.6. Geography

4. Premium Insights
4.1. STAR (Situation, Task, Action, Results) Analysis
4.2. Porter’s Five Forces Analysis
4.2.1. Threat of New Entrants
4.2.2. Bargaining Power of Buyers/Consumers
4.2.3. Bargaining Power of Suppliers
4.2.4. Threat of Substitute Types
4.2.5. Intensity of Competitive Rivalry
4.3. Key Market Trends
4.3.1. Demand Side Trends
4.3.2. Supply Side Trends
4.4. Value Chain Analysis
4.5. Type Analysis
4.6. Analysis and Recommendations
4.7. Marketing Strategy Analysis
4.7.1. Direct Marketing
4.7.2. Indirect Marketing
4.7.3. Marketing Channel Development Trend

5. Market Positioning of Key Players, 2022
5.1. Company market share of key players, 2022
5.2. Competitive Benchmarking
5.3. Market Positioning of Key Vendors
5.4. Geographical Presence Analysis
5.5. Major Strategies Adopted by Key Players
5.5.1. Key Strategies Analysis
5.5.2. Mergers and Acquisitions
5.5.3. Partnerships
5.5.4. Product Launch
5.5.5. Geographical Expansion
5.5.6. Others

6. Economic Impact Analysis
6.1. Recession Impact
6.1.1. North America
6.1.2. Europe
6.1.3. Asia Pacific
6.1.4. Latin America
6.1.5. Middle East and Africa
6.2. Ukraine-Russia War Impact
6.2.1. North America
6.2.2. Europe
6.2.3. Asia Pacific
6.2.4. Latin America
6.2.5. Middle East and Africa
6.3. COVID-19 Impact Analysis
6.3.1. North America
6.3.2. Europe
6.3.3. Asia Pacific
6.3.4. Latin America
6.3.5. Middle East and Africa

7. Global Smart Cards Market, By Type
7.1. Global Smart Cards Market Overview, by Type
7.1.1. Global Smart Cards Market Revenue Share, By Type, 2022 Vs 2030 (in %)
7.2. Memory
7.2.1. Global Smart Cards Market, By Region, 2017-2030 (US$ Mn)
7.3. MPU Microprocessor
7.3.1. Global Smart Cards Market, By Region, 2017-2030 (US$ Mn)

8. Global Smart Cards Market, By Interface
8.1. Global Smart Cards Market Overview, by Interface
8.1.1. Global Smart Cards Market, By Interface, 2022 vs 2030 (in %)
8.2. Contact
8.2.1. Global Smart Cards Market, By Region, 2017-2030 (US$ Mn)
8.3. Contactless
8.3.1. Global Smart Cards Market, By Region, 2017-2030 (US$ Mn)
8.4. Dual
8.4.1. Global Smart Cards Market, By Region, 2017-2030 (US$ Mn)

9. Global Smart Cards Market, by Functionality, 2017-2030 (US$ Mn)
9.1. Global Smart Cards Market Overview, by Functionality
9.1.1. Global Smart Cards Market, By Functionality, 2022 vs 2030 (in%)
9.2. Transaction
9.2.1. Global Smart Cards Market, By Region, 2017-2030 (US$ Mn)
9.3. Communication
9.3.1. Global Smart Cards Market, By Region, 2017-2030 (US$ Mn)
9.4. Security & Access Control
9.4.1. Global Smart Cards Market, By Region, 2017-2030 (US$ Mn)

10. Global Smart Cards Market, by Offering, 2017-2030 (US$ Mn)
10.1. Global Smart Cards Market Overview, by Offering
10.1.1. Global Smart Cards Market, By Functionality, 2022 vs 2030 (in%)
10.2. Smart Card
10.2.1. Global Smart Cards Market, By Region, 2017-2030 (US$ Mn)
10.3. Smart Card Readers
10.3.1. Global Smart Cards Market, By Region, 2017-2030 (US$ Mn)

11. Global Smart Cards Market, by Vertical, 2017-2030 (US$ Mn)
11.1. Global Smart Cards Market Overview, by Vertical
11.1.1. Global Smart Cards Market, By Vertical, 2022 vs 2030 (in%)
11.2. BFSI
11.2.1. Global Smart Cards Market, By Region, 2017-2030 (US$ Mn)
11.3. Telecommunication
11.3.1. Global Smart Cards Market, By Region, 2017-2030 (US$ Mn)
11.4. Circulating Cell-Free RNA
11.4.1. Global Smart Cards Market, By Region, 2017-2030 (US$ Mn)
11.5. Government and Healthcare
11.5.1. Global Smart Cards Market, By Region, 2017-2030 (US$ Mn)
11.6. Education
11.6.1. Global Smart Cards Market, By Region, 2017-2030 (US$ Mn)
11.7. Retail
11.7.1. Global Smart Cards Market, By Region, 2017-2030 (US$ Mn)
11.8. Transportation
11.8.1. Global Smart Cards Market, By Region, 2017-2030 (US$ Mn)
11.9. Others
11.9.1. Global Smart Cards Market, By Region, 2017-2030 (US$ Mn)

12. Global Smart Cards Market, By Region
12.1. Global Smart Cards Market Overview, by Region
12.1.1. Global Smart Cards Market, By Region, 2022 vs 2030 (in%)
12.2. Type
12.2.1. Global Smart Cards Market, By Type, 2017-2030 (US$ Mn)
12.3. Interface
12.3.1. Global Smart Cards Market, By Interface, 2017-2030 (US$ Mn)
12.4. Functionality
12.4.1. Global Smart Cards Market, By Functionality, 2017-2030 (US$ Mn)
12.5. Offering
12.5.1. Global Smart Cards Market, By Offering, 2017-2030 (US$ Mn)
12.6. Vertical
12.6.1. Global Smart Cards Market, By Vertical, 2017-2030 (US$ Mn)

13. North America Smart Cards Market Analysis
13.1. North America Smart Cards Market, by Type, 2017-2030(US$ Mn)
13.1.1. Overview
13.1.2. SRC Analysis
13.2. North America Smart Cards Market, by Interface, 2017-2030(US$ Mn)
13.2.1. Overview
13.2.2. SRC Analysis
13.3. North America Smart Cards Market, by Functionality, 2017-2030(US$ Mn)
13.3.1. Overview
13.3.2. SRC Analysis
13.4. North America Smart Cards Market, by Offering, 2017-2030(US$ Mn)
13.4.1. Overview
13.4.2. SRC Analysis
13.5. North America Smart Cards Market, by Vertical, 2017-2030(US$ Mn)
13.5.1. Overview
13.5.2. SRC Analysis
13.6. North America Smart Cards Market, by Country, 2017-2030 (US$ Mn)
13.6.1. North America Smart Cards Market, by Country, 2022 Vs 2030 (in%)
13.6.2. U.S.
13.6.2.1. U.S. Smart Cards Market Estimates and Forecast, 2017-2030 (US$ Mn)
13.6.2.2. U.S. Smart Cards, By Type, 2017-2030 (US$ Mn)
13.6.2.3. U.S. Smart Cards, By Interface, 2017-2030 (US$ Mn)
13.6.2.4. U.S. Smart Cards, By Functionality, 2017-2030 (US$ Mn)
13.6.2.5. U.S. Smart Cards, By Offering, 2017-2030 (US$ Mn)
13.6.2.6. U.S. Smart Cards, By Vertical, 2017-2030 (US$ Mn)
13.6.3. Canada
13.6.3.1. Canada Smart Cards Market Estimates and Forecast, 2017-2030 (US$ Mn)
13.6.3.2. Canada Smart Cards, By Type, 2017-2030 (US$ Mn)
13.6.3.3. Canada Smart Cards, By Interface, 2017-2030 (US$ Mn)
13.6.3.4. Canada Smart Cards, By Functionality, 2017-2030 (US$ Mn)
13.6.3.5. Canada Smart Cards, By Offering, 2017-2030 (US$ Mn)
13.6.3.6. Canada Smart Cards, By Vertical, 2017-2030 (US$ Mn)
13.6.4. Mexico
13.6.4.1. Mexico Smart Cards Market Estimates and Forecast, 2017-2030 (US$ Mn)
13.6.4.2. Mexico Smart Cards, By Type, 2017-2030 (US$ Mn)
13.6.4.3. Mexico Smart Cards, By Interface, 2017-2030 (US$ Mn)
13.6.4.4. Mexico Smart Cards, By Functionality, 2017-2030 (US$ Mn)
13.6.4.5. Mexico Smart Cards, By Offering, 2017-2030 (US$ Mn)
13.6.4.6. Mexico Smart Cards, By Vertical, 2017-2030 (US$ Mn)

14. Europe Smart Cards Market Analysis
14.1. Europe Smart Cards Market, by Type, 2017-2030(US$ Mn)
14.1.1. Overview
14.1.2. SRC Analysis
14.2. Europe Smart Cards Market, by Interface, 2017-2030(US$ Mn)
14.2.1. Overview
14.2.2. SRC Analysis
14.3. Europe Smart Cards Market, by Functionality, 2017-2030(US$ Mn)
14.3.1. Overview
14.3.2. SRC Analysis
14.4. Europe Smart Cards Market, by Offering, 2017-2030(US$ Mn)
14.4.1. Overview
14.4.2. SRC Analysis
14.5. Europe Smart Cards Market, by Vertical, 2017-2030(US$ Mn)
14.5.1. Overview
14.5.2. SRC Analysis
14.6. Europe Smart Cards Market, by Country, 2017-2030 (US$ Mn)
14.6.1. Europe Smart Cards Market, by Country, 2022 Vs 2030 (in%)
14.6.2. Germany
14.6.2.1. Germany Smart Cards Market Estimates and Forecast, 2017-2030 (US$ Mn)
14.6.2.2. Germany Smart Cards, By Type, 2017-2030 (US$ Mn)
14.6.2.3. Germany Smart Cards, By Interface, 2017-2030 (US$ Mn)
14.6.2.4. Germany Smart Cards, By Functionality, 2017-2030 (US$ Mn)
14.6.2.5. Germany Smart Cards, By Offering, 2017-2030 (US$ Mn)
14.6.2.6. Germany Smart Cards, By Vertical, 2017-2030 (US$ Mn)
14.6.3. France
14.6.3.1. France Smart Cards Market Estimates and Forecast, 2017-2030 (US$ Mn)
14.6.3.2. France Smart Cards, By Type, 2017-2030 (US$ Mn)
14.6.3.3. France Smart Cards, By Interface, 2017-2030 (US$ Mn)
14.6.3.4. France Smart Cards, By Functionality, 2017-2030 (US$ Mn)
14.6.3.5. France Smart Cards, By Offering, 2017-2030 (US$ Mn)
14.6.3.6. France Smart Cards, By Vertical, 2017-2030 (US$ Mn)
14.6.4. UK
14.6.4.1. UK Smart Cards Market Estimates and Forecast, 2017-2030 (US$ Mn)
14.6.4.2. UK Smart Cards, By Type, 2017-2030 (US$ Mn)
14.6.4.3. UK Smart Cards, By Interface, 2017-2030 (US$ Mn)
14.6.4.4. UK Smart Cards, By Functionality, 2017-2030 (US$ Mn)
14.6.4.5. UK Smart Cards, By Offering, 2017-2030 (US$ Mn)
14.6.4.6. UK Smart Cards, By Vertical, 2017-2030 (US$ Mn)
14.6.5. Italy
14.6.5.1. Italy Smart Cards Market Estimates and Forecast, 2017-2030 (US$ Mn)
14.6.5.2. Italy Smart Cards, By Type, 2017-2030 (US$ Mn)
14.6.5.3. Italy Smart Cards, By Interface, 2017-2030 (US$ Mn)
14.6.5.4. Italy Smart Cards, By Functionality, 2017-2030 (US$ Mn)
14.6.5.5. Italy Smart Cards, By Offering, 2017-2030 (US$ Mn)
14.6.5.6. Italy Smart Cards, By Vertical, 2017-2030 (US$ Mn)
14.6.6. Spain
14.6.6.1. Spain Smart Cards Market Estimates and Forecast, 2017-2030 (US$ Mn)
14.6.6.2. Spain Smart Cards, By Type, 2017-2030 (US$ Mn)
14.6.6.3. Spain Smart Cards, By Interface, 2017-2030 (US$ Mn)
14.6.6.4. Spain Smart Cards, By Functionality, 2017-2030 (US$ Mn)
14.6.6.5. Spain Smart Cards, By Offering, 2017-2030 (US$ Mn)
14.6.6.6. Spain Smart Cards, By Vertical, 2017-2030 (US$ Mn)
14.6.7. Rest of Europe
14.6.7.1. Rest of Europe Smart Cards Market Estimates and Forecast, 2017-2030 (US$ Mn)
14.6.7.2. Rest of Europe Smart Cards, By Type, 2017-2030 (US$ Mn)
14.6.7.3. Rest of Europe Smart Cards, By Interface, 2017-2030 (US$ Mn)
14.6.7.4. Rest of Europe Smart Cards, By Functionality, 2017-2030 (US$ Mn)
14.6.7.5. Rest of Europe Smart Cards, By Offering, 2017-2030 (US$ Mn)
14.6.7.6. Rest of Europe Smart Cards, By Vertical, 2017-2030 (US$ Mn)

15. Asia Pacific Smart Cards Market Analysis
15.1. Asia Pacific Smart Cards Market, by Type, 2017-2030(US$ Mn)
15.1.1. Overview
15.1.2. SRC Analysis
15.2. Asia Pacific Smart Cards Market, by Interface, 2017-2030(US$ Mn)
15.2.1. Overview
15.2.2. SRC Analysis
15.3. Asia Pacific Smart Cards Market, by Functionality, 2017-2030(US$ Mn)
15.3.1. Overview
15.3.2. SRC Analysis
15.4. Asia Pacific Smart Cards Market, by Offering, 2017-2030(US$ Mn)
15.4.1. Overview
15.4.2. SRC Analysis
15.5. Asia Pacific Smart Cards Market, by Vertical, 2017-2030(US$ Mn)
15.5.1. Overview
15.5.2. SRC Analysis
15.6. Asia Pacific Smart Cards Market, by Country, 2017-2030 (US$ Mn)
15.6.1. Asia Pacific Smart Cards Market, by Country, 2022 Vs 2030 (in%)
15.6.2. China
15.6.2.1. China Smart Cards Market Estimates and Forecast, 2017-2030 (US$ Mn)
15.6.2.2. China Smart Cards, By Type, 2017-2030 (US$ Mn)
15.6.2.3. China Smart Cards, By Interface, 2017-2030 (US$ Mn)
15.6.2.4. China Smart Cards, By Functionality, 2017-2030 (US$ Mn)
15.6.2.5. China Smart Cards, By Offering, 2017-2030 (US$ Mn)
15.6.2.6. China Smart Cards, By Vertical, 2017-2030 (US$ Mn)
15.6.3. Japan
15.6.3.1. Japan Smart Cards Market Estimates and Forecast, 2017-2030 (US$ Mn)
15.6.3.2. Japan Smart Cards, By Type, 2017-2030 (US$ Mn)
15.6.3.3. Japan Smart Cards, By Interface, 2017-2030 (US$ Mn)
15.6.3.4. Japan Smart Cards, By Functionality, 2017-2030 (US$ Mn)
15.6.3.5. Japan Smart Cards, By Offering, 2017-2030 (US$ Mn)
15.6.3.6. Japan Smart Cards, By Vertical, 2017-2030 (US$ Mn)
15.6.4. India
15.6.4.1. India Smart Cards Market Estimates and Forecast, 2017-2030 (US$ Mn)
15.6.4.2. India Smart Cards, By Type, 2017-2030 (US$ Mn)
15.6.4.3. India Smart Cards, By Interface, 2017-2030 (US$ Mn)
15.6.4.4. India Smart Cards, By Functionality, 2017-2030 (US$ Mn)
15.6.4.5. India Smart Cards, By Offering, 2017-2030 (US$ Mn)
15.6.4.6. India Smart Cards, By Vertical, 2017-2030 (US$ Mn)
15.6.5. South Korea
15.6.5.1. South Korea Smart Cards Market Estimates and Forecast, 2017-2030 (US$ Mn)
15.6.5.2. South Korea Smart Cards, By Type, 2017-2030 (US$ Mn)
15.6.5.3. South Korea Smart Cards, By Interface, 2017-2030 (US$ Mn)
15.6.5.4. South Korea Smart Cards, By Functionality, 2017-2030 (US$ Mn)
15.6.5.5. South Korea Smart Cards, By Offering, 2017-2030 (US$ Mn)
15.6.5.6. South Korea Smart Cards, By Vertical, 2017-2030 (US$ Mn)
15.6.6. South-East Asia
15.6.6.1. South-East Asia Smart Cards Market Estimates and Forecast, 2017-2030 (US$ Mn)
15.6.6.2. South-East Asia Smart Cards, By Type, 2017-2030 (US$ Mn)
15.6.6.3. South-East Asia Smart Cards, By Interface, 2017-2030 (US$ Mn)
15.6.6.4. South Korea Smart Cards, By Functionality, 2017-2030 (US$ Mn)
15.6.6.5. South Korea Smart Cards, By Offering, 2017-2030 (US$ Mn)
15.6.6.6. South-East Asia Smart Cards, By Vertical, 2017-2030 (US$ Mn)
15.6.7. Rest of Asia Pacific
15.6.7.1. Rest of Asia Pacific Smart Cards Market Estimates and Forecast, 2017-2030 (US$ Mn)
15.6.7.2. Rest of Asia Pacific Smart Cards, By Type, 2017-2030 (US$ Mn)
15.6.7.3. Rest of Asia Pacific Smart Cards, By Interface, 2017-2030 (US$ Mn)
15.6.7.4. Rest of Asia Pacific Smart Cards, By Functionality, 2017-2030 (US$ Mn)
15.6.7.5. Rest of Asia Pacific Smart Cards, By Offering, 2017-2030 (US$ Mn)
15.6.7.6. Rest of Asia Pacific Smart Cards, By Vertical, 2017-2030 (US$ Mn)

16. Latin America Smart Cards Market Analysis
16.1. Latin America Smart Cards Market, by Type, 2017-2030(US$ Mn)
16.1.1. Overview
16.1.2. SRC Analysis
16.2. Latin America Smart Cards Market, by Interface, 2017-2030(US$ Mn)
16.2.1. Overview
16.2.2. SRC Analysis
16.3. Latin America Smart Cards Market, by Functionality, 2017-2030(US$ Mn)
16.3.1. Overview
16.3.2. SRC Analysis
16.4. Latin America Smart Cards Market, by Offering, 2017-2030(US$ Mn)
16.4.1. Overview
16.4.2. SRC Analysis
16.5. Latin America Smart Cards Market, by Vertical, 2017-2030(US$ Mn)
16.5.1. Overview
16.5.2. SRC Analysis
16.5.3. SRC Analysis
16.6. Latin America Smart Cards Market, by Country, 2017-2030 (US$ Mn)
16.6.1. Latin America Smart Cards Market, by Country, 2022 Vs 2030 (in%)
16.6.2. Brazil
16.6.2.1. Brazil Smart Cards Market Estimates and Forecast, 2017-2030 (US$ Mn)
16.6.2.2. Brazil Smart Cards, By Type, 2017-2030 (US$ Mn)
16.6.2.3. Brazil Smart Cards, By Interface, 2017-2030 (US$ Mn)
16.6.2.4. Brazil Smart Cards, By Functionality, 2017-2030 (US$ Mn)
16.6.2.5. Brazil Smart Cards, By Offering, 2017-2030 (US$ Mn)
16.6.2.6. Brazil Smart Cards, By Vertical, 2017-2030 (US$ Mn)
16.6.3. Argentina
16.6.3.1. Argentina Smart Cards Market Estimates and Forecast, 2017-2030 (US$ Mn)
16.6.3.2. Argentina Smart Cards, By Type, 2017-2030 (US$ Mn)
16.6.3.3. Argentina Smart Cards, By Interface, 2017-2030 (US$ Mn)
16.6.3.4. Argentina Smart Cards, By Functionality, 2017-2030 (US$ Mn)
16.6.3.5. Argentina Smart Cards, By Offering, 2017-2030 (US$ Mn)
16.6.3.6. Argentina Smart Cards, By Vertical, 2017-2030 (US$ Mn)
16.6.4. Rest of Latin America
16.6.4.1. Rest of Latin America Smart Cards Market Estimates and Forecast, 2017-2030 (US$ Mn)
16.6.4.2. Rest of Latin America Smart Cards, By Type, 2017-2030 (US$ Mn)
16.6.4.3. Rest of Latin America Smart Cards, By Interface, 2017-2030 (US$ Mn)
16.6.4.4. Rest of Latin America Smart Cards, By Functionality, 2017-2030 (US$ Mn)
16.6.4.5. Rest of Latin America Smart Cards, By Offering, 2017-2030 (US$ Mn)
16.6.4.6. Rest of Latin America Smart Cards, By Vertical, 2017-2030 (US$ Mn)

17. Middle East and Africa Smart Cards Market Analysis
17.1. Middle East and Africa Smart Cards Market, by Type, 2017-2030(US$ Mn)
17.1.1. Overview
17.1.2. SRC Analysis
17.2. Middle East and Africa Smart Cards Market, by Interface, 2017-2030(US$ Mn)
17.2.1. Overview
17.2.2. SRC Analysis
17.3. Middle East and Africa Smart Cards Market, by Functionality, 2017-2030(US$ Mn)
17.3.1. Overview
17.3.2. SRC Analysis
17.4. Middle East and Africa Smart Cards Market, by Offering, 2017-2030(US$ Mn)
17.4.1. Overview
17.4.2. SRC Analysis
17.5. Middle East and Africa Smart Cards Market, by Vertical, 2017-2030(US$ Mn)
17.5.1. Overview
17.5.2. SRC Analysis
17.6. Middle East and Africa Smart Cards Market, by Country, 2017-2030 (US$ Mn)
17.6.1. Middle East and Africa Smart Cards Market, by Country, 2022 Vs 2030 (in%)
17.6.2. GCC Countries
17.6.2.1. GCC Countries Smart Cards Market Estimates and Forecast, 2017-2030 (US$ Mn)
17.6.2.2. GCC Countries Smart Cards, By Type, 2017-2030 (US$ Mn)
17.6.2.3. GCC Countries Smart Cards, By Interface, 2017-2030 (US$ Mn)
17.6.2.4. GCC Countries Smart Cards, By Functionality, 2017-2030 (US$ Mn)
17.6.2.5. GCC Smart Cards, By Offering, 2017-2030 (US$ Mn)
17.6.2.6. GCC Countries Smart Cards, By Vertical, 2017-2030 (US$ Mn)
17.6.3. South Africa
17.6.3.1. South Africa Smart Cards Market Estimates and Forecast, 2017-2030 (US$ Mn)
17.6.3.2. South Africa Smart Cards, By Type, 2017-2030 (US$ Mn)
17.6.3.3. South Africa Smart Cards, By Interface, 2017-2030 (US$ Mn)
17.6.3.4. South Africa Smart Cards, By Functionality, 2017-2030 (US$ Mn)
17.6.3.5. South Africa Smart Cards, By Offering, 2017-2030 (US$ Mn)
17.6.3.6. South Africa Smart Cards, By Vertical, 2017-2030 (US$ Mn)
17.6.4. Rest of Middle East and Africa
17.6.4.1. Rest of Middle East and Africa Smart Cards Market Estimates and Forecast, 2017-2030 (US$ Mn)
17.6.4.2. Rest of Middle East and Africa Smart Cards, By Type, 2017-2030 (US$ Mn)
17.6.4.3. Rest of Middle East and Africa Smart Cards, By Interface, 2017-2030 (US$ Mn)
17.6.4.4. Rest of Middle East and Africa Smart Cards, By Functionality, 2017-2030 (US$ Mn)
17.6.4.5. Rest of Middle East and Africa Smart Cards, By Offering, 2017-2030 (US$ Mn)
17.6.4.6. Rest of Middle East and Africa Smart Cards, By Vertical, 2017-2030 (US$ Mn)

18. Company Profiles
18.1. Samsung Electronics Co. Ltd.
18.1.1. Company Overview
18.1.2. Products/Services Portfolio
18.1.3. Geographical Presence
18.1.4. Financial Summary
18.1.4.1. Market Revenue and Net Profit (2019-2022)
18.1.4.2. Business Segment Revenue Analysis
18.1.4.3. Geographical Revenue Analysis
18.2. Sony Corporation
18.3. CPI Card Company
18.4. Square Inc.
18.5. Francisco Partners
18.6. Inteligensa Group
18.7. Infineon Technologies AG
18.8. NXP Semiconductors N.V.
18.9. CARD Corporation
18.10. Giesecke & Devrient (G&D) GmbH
18.11. Ingenico

List of Figures
FIG. 1 Global Smart Cards Market: Research Methodology
FIG. 2 Market Size Estimation – Top Down & Bottom up Approach
FIG. 3 Global Smart Cards Market Segment
FIG. 4 Global Smart Cards Market, by Type, 2022 (US$ Mn)
FIG. 5 Global Smart Cards Market, by Interface, 2022 (US$ Mn)
FIG. 6 Global Smart Cards Market, by Functionality, 2022 (US$ Mn)
FIG. 7 Global Smart Cards Market, by Offering, 2022 (US$ Mn)
FIG. 8 Global Smart Cards Market, by Vertical, 2022 (US$ Mn)
FIG. 9 Global Smart Cards Market, by Geography, 2022 (US$ Mn)
FIG. 10 Attractive Investment Proposition, by Type, 2022
FIG. 11 Attractive Investment Proposition, by Interface, 2022
FIG. 12 Attractive Investment Proposition, by Functionality, 2022
FIG. 13 Attractive Investment Proposition, by Offering, 2022
FIG. 14 Attractive Investment Proposition, by Vertical, 2022
FIG. 15 Attractive Investment Proposition, by Geography, 2022
FIG. 16 Global Market Share Analysis of Key Smart Cards Market Manufacturers, 2022
FIG. 17 Global Market Positioning of Key Smart Cards Market Manufacturers, 2022
FIG. 18 Global Smart Cards Market Value Contribution, By Type, 2022 & 2030 (Value %)
FIG. 19 Global Smart Cards Market, by Memory, Value, 2017-2030 (US$ Mn)
FIG. 20 Global Smart Cards Market, by MPU Microprocessor, Value, 2017-2030 (US$ Mn)
FIG. 21 Global Smart Cards Market Value Contribution, By Interface, 2022 & 2030 (Value %)
FIG. 22 Global Smart Cards Market, by Contact, Value, 2017-2030 (US$ Mn)
FIG. 23 Global Smart Cards Market, by Contactless, 2017-2030 (US$ Mn)
FIG. 24 Global Smart Cards Market, by Dual, 2017-2030 (US$ Mn)
FIG. 25 Global Smart Cards Market Value Contribution, By Functionality, 2022 & 2030 (Value %)
FIG. 26 Global Smart Cards Market, by Transaction, Value, 2017-2030 (US$ Mn)
FIG. 27 Global Smart Cards Market, by Security & Access Control, Value, 2017-2030 (US$ Mn)
FIG. 28 Global Smart Cards Market Value Contribution, By Offering, 2022 & 2030 (Value %)
FIG. 29 Global Smart Cards Market, by Smart Card, Value, 2017-2030 (US$ Mn)
FIG. 30 Global Smart Cards Market, by Smart Card Readers, 2017-2030 (US$ Mn)
FIG. 31 Global Smart Cards Market Value Contribution, By Vertical, 2022 & 2030 (Value %)
FIG. 32 Global Smart Cards Market, by BFSI, 2017-2030 (US$ Mn)
FIG. 33 Global Smart Cards Market, by Telecommunication, 2017-2030 (US$ Mn)
FIG. 34 Global Smart Cards Market, by Government and Healthcare, 2017-2030 (US$ Mn)
FIG. 35 Global Smart Cards Market, by Education, 2017-2030 (US$ Mn)
FIG. 36 Global Smart Cards Market, by Retail, 2017-2030 (US$ Mn)
FIG. 37 Global Smart Cards Market, by Transportation, 2017-2030 (US$ Mn)
FIG. 38 Global Smart Cards Market, by Others, 2017-2030 (US$ Mn)
FIG. 39 North America Smart Cards Market, 2017-2030 (US$ Mn)
FIG. 40 North America Smart Cards Market, 2017-2030 (US$ Mn)
FIG. 41 U.S. Smart Cards Market, 2017-2030 (US$ Mn)
FIG. 42 Canada Smart Cards Market, 2017-2030 (US$ Mn)
FIG. 43 Europe Smart Cards Market, 2017-2030 (US$ Mn)
FIG. 44 Germany Smart Cards Market, 2017-2030 (US$ Mn)
FIG. 45 France Smart Cards Market, 2017-2030 (US$ Mn)
FIG. 46 U.K. Smart Cards Market, 2017-2030 (US$ Mn)
FIG. 47 Italy Smart Cards Market, 2017-2030 (US$ Mn)
FIG. 48 Spain Smart Cards Market, 2017-2030 (US$ Mn)
FIG. 49 Rest of Europe Smart Cards Market, 2017-2030 (US$ Mn)
FIG. 50 Asia Pacific Smart Cards Market, 2017-2030 (US$ Mn)
FIG. 51 China Smart Cards Market, 2017-2030 (US$ Mn)
FIG. 52 Japan Smart Cards Market, 2017-2030 (US$ Mn)
FIG. 53 India Smart Cards Market, 2017-2030 (US$ Mn)
FIG. 54 South Korea Smart Cards Market, 2017-2030 (US$ Mn)
FIG. 55 South-East Asia Smart Cards Market, 2017-2030 (US$ Mn)
FIG. 56 Rest of Asia Pacific Smart Cards Market, 2017-2030 (US$ Mn)
FIG. 57 Latin America Smart Cards Market, 2017-2030 (US$ Mn)
FIG. 58 Brazil Smart Cards Market, 2017-2030 (US$ Mn)
FIG. 59 Mexico Smart Cards Market, 2017-2030 (US$ Mn)
FIG. 60 Rest of Latin America Smart Cards Market, 2017-2030 (US$ Mn)
FIG. 61 Middle East & Africa Smart Cards Market, 2017-2030 (US$ Mn)
FIG. 62 GCC Countries Smart Cards Market, 2017-2030 (US$ Mn)
FIG. 63 South Africa Smart Cards Market, 2017-2030 (US$ Mn)
FIG. 64 Rest of Middle East and Africa Smart Cards Market, 2017-2030 (US$ Mn)

List of Tables
TABLE 1 Market Snapshot: Global Smart Cards Market
TABLE 2 Global Smart Cards Market: Market Drivers Impact Analysis
TABLE 3 Global Smart Cards Market: Market Restraints Impact Analysis
TABLE 4 Global Smart Cards Market, by Competitive Benchmarking, 2022
TABLE 5 Global Smart Cards Market, by Geographical Presence Analysis, 2022
TABLE 6 Global Smart Cards Market, by Key Strategies Analysis, 2022
TABLE 7 Global Smart Cards Market, by Memory, By Region, 2017-2022 (US$ Mn)
TABLE 8 Global Smart Cards Market, by Memory, By Region, 2023-2030 (US$ Mn)
TABLE 9 Global Smart Cards Market, by MPU Microprocessor, By Region, 2017-2022 (US$ Mn)
TABLE 10 Global Smart Cards Market, by MPU Microprocessor, By Region, 2023-2030 (US$ Mn)
TABLE 11 Global Smart Cards Market, by Contact, By Region, 2017-2022 (US$ Mn)
TABLE 12 Global Smart Cards Market, by Contact, By Region, 2023-2030 (US$ Mn)
TABLE 13 Global Smart Cards Market, by Contactless, By Region, 2017-2022 (US$ Mn)
TABLE 14 Global Smart Cards Market, by Contactless, By Region, 2023-2030 (US$ Mn)
TABLE 15 Global Smart Cards Market, by Dual, By Region, 2017-2022 (US$ Mn)
TABLE 16 Global Smart Cards Market, by Dual, By Region, 2023-2030 (US$ Mn)
TABLE 17 Global Smart Cards Market, by Transaction, By Region, 2017-2022 (US$ Mn)
TABLE 18 Global Smart Cards Market, by Transaction, By Region, 2023-2030 (US$ Mn)
TABLE 19 Global Smart Cards Market, by Communication, By Region, 2017-2022 (US$ Mn)
TABLE 20 Global Smart Cards Market, by Communication, By Region, 2023-2030 (US$ Mn)
TABLE 21 Global Smart Cards Market, by Smart Card, By Region, 2017-2022 (US$ Mn)
TABLE 22 Global Smart Cards Market, by Smart Card, By Region, 2023-2030 (US$ Mn)
TABLE 23 Global Smart Cards Market, by Smart Card Readers, By Region, 2017-2022 (US$ Mn)
TABLE 24 Global Smart Cards Market, by Smart Card Readers, By Region, 2023-2030 (US$ Mn)
TABLE 25 Global Smart Cards Market, by BFSI, By Region, 2017-2022 (US$ Mn)
TABLE 26 Global Smart Cards Market, by BFSI, By Region, 2023-2030 (US$ Mn)
TABLE 27 Global Smart Cards Market, by Telecommunication, By Region, 2017-2022 (US$ Mn)
TABLE 28 Global Smart Cards Market, by Telecommunication, By Region, 2023-2030 (US$ Mn)
TABLE 29 Global Smart Cards Market, by Government and Healthcare, By Region, 2017-2022 (US$ Mn)
TABLE 30 Global Smart Cards Market, by Government and Healthcare, By Region, 2023-2030 (US$ Mn)
TABLE 31 Global Smart Cards Market, by Education, By Region, 2017-2022 (US$ Mn)
TABLE 32 Global Smart Cards Market, by Education, By Region, 2023-2030 (US$ Mn)
TABLE 33 Global Smart Cards Market, by Transportation, By Region, 2017-2022 (US$ Mn)
TABLE 34 Global Smart Cards Market, by Transportation, By Region, 2023-2030 (US$ Mn)
TABLE 35 Global Smart Cards Market, by Others, By Region, 2017-2022 (US$ Mn)
TABLE 36 Global Smart Cards Market, by Others, By Region, 2023-2030 (US$ Mn)
TABLE 37 Global Smart Cards Market, by Type, 2017-2022 (US$ Mn)
TABLE 38 Global Smart Cards Market, by Type, 2023-2030 (US$ Mn)
TABLE 39 Global Smart Cards Market, by Interface, 2017-2022 (US$ Mn)
TABLE 40 Global Smart Cards Market, by Interface, 2023-2030 (US$ Mn)
TABLE 41 Global Smart Cards Market, by Functionality, 2017-2022 (US$ Mn)
TABLE 42 Global Smart Cards Market, by Functionality, 2023-2030 (US$ Mn)
TABLE 43 Global Smart Cards Market, by Offering, 2017-2022 (US$ Mn)
TABLE 44 Global Smart Cards Market, by Offering, 2023-2030 (US$ Mn)
TABLE 45 Global Smart Cards Market, by Vertical, 2017-2022 (US$ Mn)
TABLE 46 Global Smart Cards Market, by Vertical, 2023-2030 (US$ Mn)
TABLE 47 Global Smart Cards Market, by Region, 2017-2022 (US$ Mn)
TABLE 48 Global Smart Cards Market, by Region, 2023-2030 (US$ Mn)
TABLE 49 North America Smart Cards Market, by Type, 2017-2022 (US$ Mn)
TABLE 50 North America Smart Cards Market, by Type, 2023-2030 (US$ Mn)
TABLE 51 North America Smart Cards Market, by Interface, 2017-2022 (US$ Mn)
TABLE 52 North America Smart Cards Market, by Interface, 2023-2030 (US$ Mn)
TABLE 53 North America Smart Cards Market, by Functionality, 2017-2022 (US$ Mn)
TABLE 54 North America Smart Cards Market, by Functionality, 2023-2030 (US$ Mn)
TABLE 55 North America Smart Cards Market, by Offering, 2017-2022 (US$ Mn)
TABLE 56 North America Smart Cards Market, by Offering, 2023-2030 (US$ Mn)
TABLE 57 North America Smart Cards Market, by Vertical, 2017-2022 (US$ Mn)
TABLE 58 North America Smart Cards Market, by Vertical, 2023-2030 (US$ Mn)
TABLE 59 North America Smart Cards Market, by Country, 2017-2022 (US$ Mn)
TABLE 60 North America Smart Cards Market, by Country, 2023-2030 (US$ Mn)
TABLE 61 United States Smart Cards Market, by Type, 2017-2022 (US$ Mn)
TABLE 62 United States Smart Cards Market, by Type, 2023-2030 (US$ Mn)
TABLE 63 United States Smart Cards Market, by Interface, 2017-2022 (US$ Mn)
TABLE 64 United States Smart Cards Market, by Interface, 2023-2030 (US$ Mn)
TABLE 65 United States Smart Cards Market, by Functionality, 2017-2022 (US$ Mn)
TABLE 66 United States Smart Cards Market, by Functionality, 2023-2030 (US$ Mn)
TABLE 67 United States Smart Cards Market, by Offering, 2017-2022 (US$ Mn)
TABLE 68 United States Smart Cards Market, by Offering, 2023-2030 (US$ Mn)
TABLE 69 United States Smart Cards Market, by Vertical, 2017-2022 (US$ Mn)
TABLE 70 United States Smart Cards Market, by Vertical, 2023-2030 (US$ Mn)
TABLE 71 Canada Smart Cards Market, by Type, 2017-2022 (US$ Mn)
TABLE 72 Canada Smart Cards Market, by Type, 2023-2030 (US$ Mn)
TABLE 73 Canada Smart Cards Market, by Interface, 2017-2022 (US$ Mn)
TABLE 74 Canada Smart Cards Market, by Interface, 2023-2030 (US$ Mn)
TABLE 75 Canada Smart Cards Market, by Functionality, 2017-2022 (US$ Mn)
TABLE 76 Canada Smart Cards Market, by Functionality, 2023-2030 (US$ Mn)
TABLE 77 Canada Smart Cards Market, by Offering, 2017-2022 (US$ Mn)
TABLE 78 Canada Smart Cards Market, by Offering, 2023-2030 (US$ Mn)
TABLE 79 Canada Smart Cards Market, by Vertical, 2017-2022 (US$ Mn)
TABLE 80 Canada Smart Cards Market, by Vertical, 2023-2030 (US$ Mn)
TABLE 81 Mexico Smart Cards Market, by Type, 2017-2022 (US$ Mn)
TABLE 82 Mexico Smart Cards Market, by Type, 2023-2030 (US$ Mn)
TABLE 83 Mexico Smart Cards Market, by Interface, 2017-2022 (US$ Mn)
TABLE 84 Mexico Smart Cards Market, by Interface, 2023-2030 (US$ Mn)
TABLE 85 Mexico Smart Cards Market, by Functionality, 2017-2022 (US$ Mn)
TABLE 86 Mexico Smart Cards Market, by Functionality, 2023-2030 (US$ Mn)
TABLE 87 Mexico Smart Cards Market, by Offering, 2017-2022 (US$ Mn)
TABLE 88 Mexico Smart Cards Market, by Offering, 2023-2030 (US$ Mn)
TABLE 89 Mexico Smart Cards Market, by Vertical, 2017-2022 (US$ Mn)
TABLE 90 Mexico Smart Cards Market, by Vertical, 2023-2030 (US$ Mn)
TABLE 91 Europe Smart Cards Market, by Type, 2017-2022 (US$ Mn)
TABLE 92 Europe Smart Cards Market, by Type, 2023-2030 (US$ Mn)
TABLE 93 Europe Smart Cards Market, by Interface, 2017-2022 (US$ Mn)
TABLE 94 Europe Smart Cards Market, by Interface, 2023-2030 (US$ Mn)
TABLE 95 Europe Smart Cards Market, by Functionality, 2017-2022 (US$ Mn)
TABLE 96 Europe Smart Cards Market, by Functionality, 2023-2030 (US$ Mn)
TABLE 97 Europe Smart Cards Market, by Offering, 2017-2022 (US$ Mn)
TABLE 98 Europe Smart Cards Market, by Offering, 2023-2030 (US$ Mn)
TABLE 99 Europe Smart Cards Market, by Vertical, 2017-2022 (US$ Mn)
TABLE 100 Europe Smart Cards Market, by Vertical, 2023-2030 (US$ Mn)
TABLE 101 Europe Smart Cards Market, by Country, 2017-2022 (US$ Mn)
TABLE 102 Europe Smart Cards Market, by Country, 2023-2030 (US$ Mn)
TABLE 103 Germany Smart Cards Market, by Type, 2017-2022 (US$ Mn)
TABLE 104 Germany Smart Cards Market, by Type, 2023-2030 (US$ Mn)
TABLE 105 Germany Smart Cards Market, by Interface, 2017-2022 (US$ Mn)
TABLE 106 Germany Smart Cards Market, by Interface, 2023-2030 (US$ Mn)
TABLE 107 Germany Smart Cards Market, by Functionality, 2017-2022 (US$ Mn)
TABLE 108 Germany Smart Cards Market, by Functionality, 2023-2030 (US$ Mn)
TABLE 109 Germany Smart Cards Market, by Offering, 2017-2022 (US$ Mn)
TABLE 110 Germany Smart Cards Market, by Offering, 2023-2030 (US$ Mn)
TABLE 111 Germany Smart Cards Market, by Vertical, 2017-2022 (US$ Mn)
TABLE 112 Germany Smart Cards Market, by Vertical, 2023-2030 (US$ Mn)
TABLE 113 France Smart Cards Market, by Type, 2017-2022 (US$ Mn)
TABLE 114 France Smart Cards Market, by Type, 2023-2030 (US$ Mn)
TABLE 115 France Smart Cards Market, by Interface, 2017-2022 (US$ Mn)
TABLE 116 France Smart Cards Market, by Interface, 2023-2030 (US$ Mn)
TABLE 117 France Smart Cards Market, by Functionality, 2017-2022 (US$ Mn)
TABLE 118 France Smart Cards Market, by Functionality, 2023-2030 (US$ Mn)
TABLE 119 France Smart Cards Market, by Offering, 2017-2022 (US$ Mn)
TABLE 120 France Smart Cards Market, by Offering, 2023-2030 (US$ Mn)
TABLE 121 France Smart Cards Market, by Vertical, 2017-2022 (US$ Mn)
TABLE 122 France Smart Cards Market, by Vertical, 2023-2030 (US$ Mn)
TABLE 123 United Kingdom Smart Cards Market, by Type, 2017-2022 (US$ Mn)
TABLE 124 United Kingdom Smart Cards Market, by Type, 2023-2030 (US$ Mn)
TABLE 125 United Kingdom Smart Cards Market, by Interface, 2017-2022 (US$ Mn)
TABLE 126 United Kingdom Smart Cards Market, by Interface, 2023-2030 (US$ Mn)
TABLE 127 United Kingdom Smart Cards Market, by Functionality, 2017-2022 (US$ Mn)
TABLE 128 United Kingdom Smart Cards Market, by Functionality, 2023-2030 (US$ Mn)
TABLE 129 United Kingdom Smart Cards Market, by Offering, 2017-2022 (US$ Mn)
TABLE 130 United Kingdom Smart Cards Market, by Offering, 2023-2030 (US$ Mn)
TABLE 131 United Kingdom Smart Cards Market, by Vertical, 2017-2022 (US$ Mn)
TABLE 132 United Kingdom Smart Cards Market, by Vertical, 2023-2030 (US$ Mn)
TABLE 133 Italy Smart Cards Market, by Type, 2017-2022 (US$ Mn)
TABLE 134 Italy Smart Cards Market, by Type, 2023-2030 (US$ Mn)
TABLE 135 Italy Smart Cards Market, by Interface, 2017-2022 (US$ Mn)
TABLE 136 Italy Smart Cards Market, by Interface, 2023-2030 (US$ Mn)
TABLE 137 Italy Smart Cards Market, by Functionality, 2017-2022 (US$ Mn)
TABLE 138 Italy Smart Cards Market, by Functionality, 2023-2030 (US$ Mn)
TABLE 139 Italy Smart Cards Market, by Offering, 2017-2022 (US$ Mn)
TABLE 140 Italy Smart Cards Market, by Offering, 2023-2030 (US$ Mn)
TABLE 141 Italy Smart Cards Market, by Vertical, 2017-2022 (US$ Mn)
TABLE 142 Italy Smart Cards Market, by Vertical, 2023-2030 (US$ Mn)
TABLE 143 Spain Smart Cards Market, by Type, 2017-2022 (US$ Mn)
TABLE 144 Spain Smart Cards Market, by Type, 2023-2030 (US$ Mn)
TABLE 145 Spain Smart Cards Market, by Interface, 2017-2022 (US$ Mn)
TABLE 146 Spain Smart Cards Market, by Interface, 2023-2030 (US$ Mn)
TABLE 147 Spain Smart Cards Market, by Functionality, 2017-2022 (US$ Mn)
TABLE 148 Spain Smart Cards Market, by Functionality, 2023-2030 (US$ Mn)
TABLE 149 Spain Smart Cards Market, by Offering, 2017-2022 (US$ Mn)
TABLE 150 Spain Smart Cards Market, by Offering, 2023-2030 (US$ Mn)
TABLE 151 Spain Smart Cards Market, by Vertical, 2023-2030 (US$ Mn)
TABLE 152 Spain Smart Cards Market, by Vertical, 2017-2022 (US$ Mn)
TABLE 153 Rest of Europe Smart Cards Market, by Type, 2017-2022 (US$ Mn)
TABLE 154 Rest of Europe Smart Cards Market, by Type, 2023-2030 (US$ Mn)
TABLE 155 Rest of Europe Smart Cards Market, by Interface, 2017-2022 (US$ Mn)
TABLE 156 Rest of Europe Smart Cards Market, by Interface, 2023-2030 (US$ Mn)
TABLE 157 Rest of Europe Smart Cards Market, by Functionality, 2017-2022 (US$ Mn)
TABLE 158 Rest of Europe Smart Cards Market, by Functionality, 2023-2030 (US$ Mn)
TABLE 159 Rest of Europe Smart Cards Market, by Offering, 2017-2022 (US$ Mn)
TABLE 160 Rest of Europe Smart Cards Market, by Offering, 2023-2030 (US$ Mn)
TABLE 161 Rest of Europe Smart Cards Market, by Vertical, 2017-2022 (US$ Mn)
TABLE 162 Rest of Europe Smart Cards Market, by Vertical, 2023-2030 (US$ Mn)
TABLE 163 Asia Pacific Smart Cards Market, by Type, 2017-2022 (US$ Mn)
TABLE 164 Asia Pacific Smart Cards Market, by Type, 2023-2030 (US$ Mn)
TABLE 165 Asia Pacific Smart Cards Market, by Interface, 2017-2022 (US$ Mn)
TABLE 166 Asia Pacific Smart Cards Market, by Interface, 2023-2030 (US$ Mn)
TABLE 167 Asia Pacific Smart Cards Market, by Functionality, 2017-2022 (US$ Mn)
TABLE 168 Asia Pacific Smart Cards Market, by Functionality, 2023-2030 (US$ Mn)
TABLE 169 Asia Pacific Smart Cards Market, by Offering, 2017-2022 (US$ Mn)
TABLE 170 Asia Pacific Smart Cards Market, by Offering, 2023-2030 (US$ Mn)
TABLE 171 Asia Pacific Smart Cards Market, by Vertical, 2017-2022 (US$ Mn)
TABLE 172 Asia Pacific Smart Cards Market, by Vertical, 2023-2030 (US$ Mn)
TABLE 173 China Smart Cards Market, by Type, 2017-2022 (US$ Mn)
TABLE 174 China Smart Cards Market, by Type, 2023-2030 (US$ Mn)
TABLE 175 China Smart Cards Market, by Interface, 2017-2022 (US$ Mn)
TABLE 176 China Smart Cards Market, by Interface, 2023-2030 (US$ Mn)
TABLE 177 China Smart Cards Market, by Functionality, 2017-2022 (US$ Mn)
TABLE 178 China Smart Cards Market, by Functionality, 2023-2030 (US$ Mn)
TABLE 179 China Smart Cards Market, by Offering, 2017-2022 (US$ Mn)
TABLE 180 China Smart Cards Market, by Offering, 2023-2030 (US$ Mn)
TABLE 181 China Smart Cards Market, by Vertical, 2017-2022 (US$ Mn)
TABLE 182 China Smart Cards Market, by Vertical, 2023-2030 (US$ Mn)
TABLE 183 Japan Smart Cards Market, by Type, 2017-2022 (US$ Mn)
TABLE 184 Japan Smart Cards Market, by Type, 2023-2030 (US$ Mn)
TABLE 185 Japan Smart Cards Market, by Interface, 2017-2022 (US$ Mn)
TABLE 186 Japan Smart Cards Market, by Interface, 2023-2030 (US$ Mn)
TABLE 187 Japan Smart Cards Market, by Functionality, 2017-2022 (US$ Mn)
TABLE 188 Japan Smart Cards Market, by Functionality, 2023-2030 (US$ Mn)
TABLE 189 Japan Smart Cards Market, by Offering, 2017-2022 (US$ Mn)
TABLE 190 Japan Smart Cards Market, by Offering, 2023-2030 (US$ Mn)
TABLE 191 Japan Smart Cards Market, by Vertical, 2017-2022 (US$ Mn)
TABLE 192 Japan Smart Cards Market, by Vertical, 2023-2030 (US$ Mn)
TABLE 193 India Smart Cards Market, by Type, 2017-2022 (US$ Mn)
TABLE 194 India Smart Cards Market, by Type, 2023-2030 (US$ Mn)
TABLE 195 India Smart Cards Market, by Interface, 2017-2022 (US$ Mn)
TABLE 196 India Smart Cards Market, by Interface, 2023-2030 (US$ Mn)
TABLE 197 India Smart Cards Market, by Functionality, 2017-2022 (US$ Mn)
TABLE 198 India Smart Cards Market, by Functionality, 2023-2030 (US$ Mn)
TABLE 199 India Smart Cards Market, by Offering, 2017-2022 (US$ Mn)
TABLE 200 India Smart Cards Market, by Offering, 2023-2030 (US$ Mn)
TABLE 201 India Smart Cards Market, by Vertical, 2017-2022 (US$ Mn)
TABLE 202 India Smart Cards Market, by Vertical, 2023-2030 (US$ Mn)
TABLE 203 South Korea Smart Cards Market, by Type, 2017-2022 (US$ Mn)
TABLE 204 South Korea Smart Cards Market, by Type, 2023-2030 (US$ Mn)
TABLE 205 South Korea Smart Cards Market, by Interface, 2017-2022 (US$ Mn)
TABLE 206 South Korea Smart Cards Market, by Interface, 2023-2030 (US$ Mn)
TABLE 207 South Korea Smart Cards Market, by Functionality, 2017-2022 (US$ Mn)
TABLE 208 South Korea Smart Cards Market, by Functionality, 2023-2030 (US$ Mn)
TABLE 209 South Korea Smart Cards Market, by Offering, 2017-2022 (US$ Mn)
TABLE 210 South Korea Smart Cards Market, by Offering, 2023-2030 (US$ Mn)
TABLE 211 South Korea Smart Cards Market, by Vertical, 2017-2022 (US$ Mn)
TABLE 212 South Korea Smart Cards Market, by Vertical, 2023-2030 (US$ Mn)
TABLE 213 South-East Asia Smart Cards Market, by Type, 2017-2022 (US$ Mn)
TABLE 214 South-East Asia Smart Cards Market, by Type, 2023-2030 (US$ Mn)
TABLE 215 South-East Asia Smart Cards Market, by Interface, 2017-2022 (US$ Mn)
TABLE 216 South-East Asia Smart Cards Market, by Interface, 2023-2030 (US$ Mn)
TABLE 217 South-East Asia Smart Cards Market, by Functionality, 2017-2022 (US$ Mn)
TABLE 218 South-East Asia Smart Cards Market, by Functionality, 2023-2030 (US$ Mn)
TABLE 219 South-East Asia Smart Cards Market, by Offering, 2017-2022 (US$ Mn)
TABLE 220 South-East Asia Smart Cards Market, by Offering, 2023-2030 (US$ Mn)
TABLE 221 South-East Asia Smart Cards Market, by Vertical, 2017-2022 (US$ Mn)
TABLE 222 South-East Asia Smart Cards Market, by Vertical, 2023-2030 (US$ Mn)
TABLE 223 Rest of Asia Pacific Smart Cards Market, by Type, 2017-2022 (US$ Mn)
TABLE 224 Rest of Asia Pacific Smart Cards Market, by Type, 2023-2030 (US$ Mn)
TABLE 225 Rest of Asia Pacific Smart Cards Market, by Interface, 2017-2022 (US$ Mn)
TABLE 226 Rest of Asia Pacific Smart Cards Market, by Interface, 2023-2030 (US$ Mn)
TABLE 227 Rest of Asia Pacific Smart Cards Market, by Functionality, 2017-2022 (US$ Mn)
TABLE 228 Rest of Asia Pacific Smart Cards Market, by Functionality, 2023-2030 (US$ Mn)
TABLE 229 Rest of Asia Pacific Smart Cards Market, by Offering, 2017-2022 (US$ Mn)
TABLE 230 Rest of Asia Pacific Smart Cards Market, by Offering, 2023-2030 (US$ Mn)
TABLE 231 Rest of Asia Pacific Smart Cards Market, by Vertical, 2017-2022 (US$ Mn)
TABLE 232 Rest of Asia Pacific Smart Cards Market, by Vertical, 2023-2030 (US$ Mn)
TABLE 233 Latin America Smart Cards Market, by Type, 2017-2022 (US$ Mn)
TABLE 234 Latin America Smart Cards Market, by Type, 2023-2030 (US$ Mn)
TABLE 235 Latin America Smart Cards Market, by Interface, 2017-2022 (US$ Mn)
TABLE 236 Latin America Smart Cards Market, by Interface, 2023-2030 (US$ Mn)
TABLE 237 Latin America Smart Cards Market, by Functionality, 2017-2022 (US$ Mn)
TABLE 238 Latin America Smart Cards Market, by Functionality, 2023-2030 (US$ Mn)
TABLE 239 Latin America Smart Cards Market, by Offering, 2017-2022 (US$ Mn)
TABLE 240 Latin America Smart Cards Market, by Offering, 2023-2030 (US$ Mn)
TABLE 241 Latin America Smart Cards Market, by Vertical, 2017-2022 (US$ Mn)
TABLE 242 Latin America Smart Cards Market, by Vertical, 2023-2030 (US$ Mn)
TABLE 243 Brazil Smart Cards Market, by Type, 2017-2022 (US$ Mn)
TABLE 244 Brazil Smart Cards Market, by Type, 2023-2030 (US$ Mn)
TABLE 245 Brazil Smart Cards Market, by Interface, 2017-2022 (US$ Mn)
TABLE 246 Brazil Smart Cards Market, by Interface, 2023-2030 (US$ Mn)
TABLE 247 Brazil Smart Cards Market, by Functionality, 2017-2022 (US$ Mn)
TABLE 248 Brazil Smart Cards Market, by Functionality, 2023-2030 (US$ Mn)
TABLE 249 Brazil Smart Cards Market, by Offering, 2017-2022 (US$ Mn)
TABLE 250 Brazil Smart Cards Market, by Offering, 2023-2030 (US$ Mn)
TABLE 251 Brazil Smart Cards Market, by Vertical, 2017-2022 (US$ Mn)
TABLE 252 Brazil Smart Cards Market, by Vertical, 2023-2030 (US$ Mn)
TABLE 253 Argentina Smart Cards Market, by Type, 2017-2022 (US$ Mn)
TABLE 254 Argentina Smart Cards Market, by Type, 2023-2030 (US$ Mn)
TABLE 255 Argentina Smart Cards Market, by Interface, 2017-2022 (US$ Mn)
TABLE 256 Argentina Smart Cards Market, by Interface, 2023-2030 (US$ Mn)
TABLE 257 Argentina Smart Cards Market, by Functionality, 2017-2022 (US$ Mn)
TABLE 258 Argentina Smart Cards Market, by Functionality, 2023-2030 (US$ Mn)
TABLE 259 Argentina Smart Cards Market, by Offering, 2017-2022 (US$ Mn)
TABLE 260 Argentina Smart Cards Market, by Offering, 2023-2030 (US$ Mn)
TABLE 261 Argentina Smart Cards Market, by Vertical, 2017-2022 (US$ Mn)
TABLE 262 Argentina Smart Cards Market, by Vertical, 2023-2030 (US$ Mn)
TABLE 263 Rest of Latin America Smart Cards Market, by Type, 2017-2022 (US$ Mn)
TABLE 264 Rest of Latin America Smart Cards Market, by Type, 2023-2030 (US$ Mn)
TABLE 265 Rest of Latin America Smart Cards Market, by Interface, 2017-2022 (US$ Mn)
TABLE 266 Rest of Latin America Smart Cards Market, by Interface, 2023-2030 (US$ Mn)
TABLE 267 Rest of Latin America Smart Cards Market, by Functionality, 2017-2022 (US$ Mn)
TABLE 268 Rest of Latin America Smart Cards Market, by Functionality, 2023-2030 (US$ Mn)
TABLE 269 Rest of Latin America Smart Cards Market, by Offering, 2017-2022 (US$ Mn)
TABLE 270 Rest of Latin America Smart Cards Market, by Offering, 2023-2030 (US$ Mn)
TABLE 271 Rest of Latin America Smart Cards Market, by Vertical, 2017-2022 (US$ Mn)
TABLE 272 Rest of Latin America Smart Cards Market, by Vertical, 2023-2030 (US$ Mn)
TABLE 273 Middle East and Africa Smart Cards Market, by Type, 2017-2022 (US$ Mn)
TABLE 274 Middle East and Africa Smart Cards Market, by Type, 2023-2030 (US$ Mn)
TABLE 275 Middle East and Africa Smart Cards Market, by Interface, 2017-2022 (US$ Mn)
TABLE 276 Middle East and Africa Smart Cards Market, by Interface, 2023-2030 (US$ Mn)
TABLE 277 Middle East and Africa Smart Cards Market, by Functionality, 2017-2022 (US$ Mn)
TABLE 278 Middle East and Africa Smart Cards Market, by Functionality, 2023-2030 (US$ Mn)
TABLE 279 Middle East and Africa Smart Cards Market, by Offering, 2017-2022 (US$ Mn)
TABLE 280 Middle East and Africa Smart Cards Market, by Offering, 2023-2030 (US$ Mn)
TABLE 281 Middle East and Africa Smart Cards Market, by Vertical, 2017-2022 (US$ Mn)
TABLE 282 Middle East and Africa Smart Cards Market, by Vertical, 2023-2030 (US$ Mn)
TABLE 283 GCC Countries Smart Cards Market, by Type, 2017-2022 (US$ Mn)
TABLE 284 GCC Countries Smart Cards Market, by Type, 2023-2030 (US$ Mn)
TABLE 285 GCC Countries Smart Cards Market, by Interface, 2017-2022 (US$ Mn)
TABLE 286 GCC Countries Smart Cards Market, by Interface, 2023-2030 (US$ Mn)
TABLE 287 GCC Countries Smart Cards Market, by Functionality, 2017-2022 (US$ Mn)
TABLE 288 GCC Countries Smart Cards Market, by Functionality, 2023-2030 (US$ Mn)
TABLE 289 GCC Countries Smart Cards Market, by Offering, 2017-2022 (US$ Mn)
TABLE 290 GCC Countries Smart Cards Market, by Offering, 2023-2030 (US$ Mn)
TABLE 291 GCC Countries Smart Cards Market, by Vertical, 2017-2022 (US$ Mn)
TABLE 292 GCC Countries Smart Cards Market, by Vertical, 2023-2030 (US$ Mn)

TABLE 293 South Africa Smart Cards Market, by Type, 2017-2022 (US$ Mn)
TABLE 294 South Africa Smart Cards Market, by Type, 2023-2030 (US$ Mn)
TABLE 295 South Africa Smart Cards Market, by Interface, 2017-2022 (US$ Mn)
TABLE 296 South Africa Smart Cards Market, by Interface, 2023-2030 (US$ Mn)
TABLE 297 South Africa Smart Cards Market, by Functionality, 2017-2022 (US$ Mn)
TABLE 298 South Africa Smart Cards Market, by Functionality, 2023-2030 (US$ Mn)
TABLE 299 South Africa Smart Cards Market, by Offering, 2017-2022 (US$ Mn)
TABLE 300 South Africa Smart Cards Market, by Offering, 2023-2030 (US$ Mn)
TABLE 301 South Africa Smart Cards Market, by Vertical, 2017-2022 (US$ Mn)
TABLE 302 South Africa Smart Cards Market, by Vertical, 2023-2030 (US$ Mn)
TABLE 303 Rest of Middle East and Africa Smart Cards Market, by Type, 2017-2022 (US$ Mn)
TABLE 304 Rest of Middle East and Africa Smart Cards Market, by Type, 2023-2030 (US$ Mn)
TABLE 305 Rest of Middle East and Africa Smart Cards Market, by Interface, 2017-2022 (US$ Mn)
TABLE 306 Rest of Middle East and Africa Smart Cards Market, by Interface, 2023-2030 (US$ Mn)
TABLE 307 Rest of Middle East and Africa Smart Cards Market, by Functionality, 2017-2022 (US$ Mn)
TABLE 308 Rest of Middle East and Africa Smart Cards Market, by Functionality, 2023-2030 (US$ Mn)
TABLE 309 Rest of Middle East and Africa Smart Cards Market, by Offering, 2017-2022 (US$ Mn)
TABLE 310 Rest of Middle East and Africa Smart Cards Market, by Offering, 2023-2030 (US$ Mn)
TABLE 311 Rest of Middle East and Africa Smart Cards Market, by Vertical, 2017-2022 (US$ Mn)
TABLE 312 Rest of Middle East and Africa Smart Cards Market, by Vertical, 2023-2030 (US$ Mn)

Frequently Asked Questions:

How does COVID-19 Impact the global Smart Cards market?

The COVID-19 epidemic less impacted the telecoms and healthcare-specific smart card industries than others.

Which is the leading Region of the market for Smart Cards?

North America accounted for the largest market share of the global Smart Cards market.

What are the key drivers for the growth of the Smart Cards market?

It is projected that developments in micro-embedded electronics and the increased adoption of the Internet of Things (IoT) will foster industrial growth.

Which is the major segment in the Smart Cards market by Type?

The memory segment had a major share of the global market in 2022.

Which is the major segment in the Smart Cards market by Interface?

The contact segment had a major share in the global market.

Smart Grid Managed Services Market

Published:
Report ID: 10208

Picture Archiving and Communication Systems (PACS) Market

Published:
Report ID: 9676

Chatbots Market

Published:
Report ID: 3733

Over-the-Top (OTT) Market

Published:
Report ID: 8377

Enterprise Video Market

Published:
Report ID: 5414

Enterprise Video Conferencing Market

Published:
Report ID: 5393

Conditional Access System (CAS) Market

Published:
Report ID: 4145

Internet Protocol Television (IPTV) Market

Published:
Report ID: 7037

Non-Volatile Memory Market

Published:
Report ID: 34142

Automotive Fuse Market

Published:
Report ID: 34095

Wireless Fetal Monitoring System Market

Published:
Report ID: 33986

Action Cameras Market

Published:
Report ID: 1277

Purchase Options

$2999
Delivery Format: Excel.
$4999
Designed for the individual purchaser.
$6999
Users located at a single corporate site or regional office.
$7999
Allowed for unlimited sharing globally within one company.
Smallform of Sample request

Have a question?

User Profile

Don’t settle for less – trust Mitul to help you find the best solution.

Report delivery within 24 to 48 hours

– Other Info –

What people say?-

User Review

I am very impressed with the information in this report. The author clearly did their research when they came up with this product and it has already given me a lot of ideas.

Jana Schmidt
CEDAR CX Technologies

– Connect with us –

Phone

+91 6232 49 3207


support

24/7 Research Support


sales@credenceresearch.com

– Research Methodology –

Going beyond the basics: advanced techniques in research methodology

– Trusted By –

Pepshi, LG, Nestle
Motorola, Honeywell, Johnson and johnson
LG Chem, SIEMENS, Pfizer
Unilever, Samsonite, QIAGEN