
Market Overview
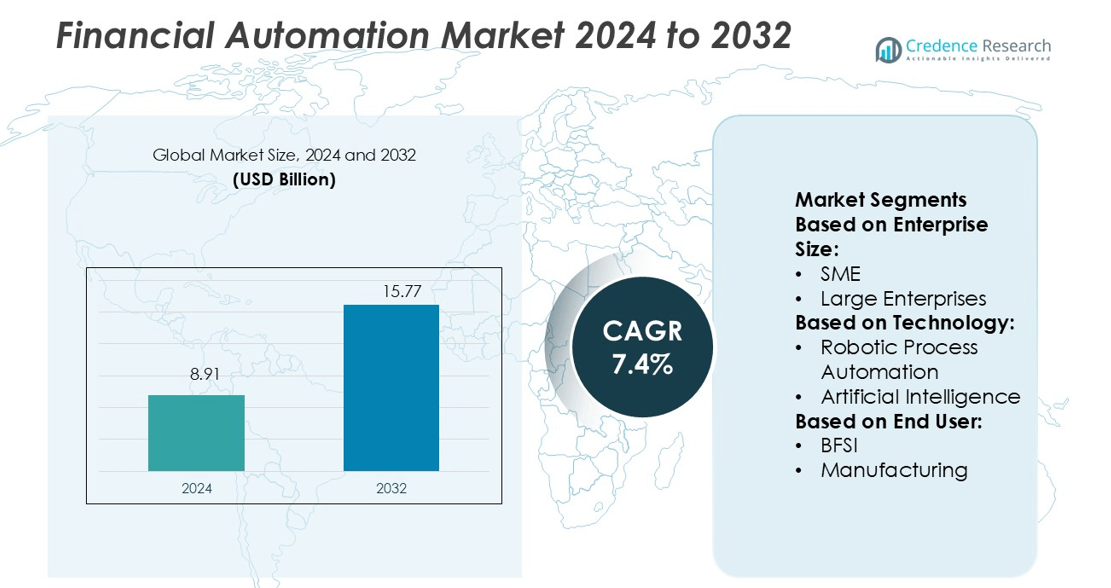
Financial Automation Market size was valued USD 8.91 billion in 2024 and is anticipated to reach USD 15.77 billion by 2032, at a CAGR of 7.4% during the forecast period.
| REPORT ATTRIBUTE | DETAILS |
|---|---|
| Historical Period | 2020-2023 |
| Base Year | 2024 |
| Forecast Period | 2025-2032 |
| Financial Automation Market Size 2024 | USD 8.91 billion |
| Financial Automation Market, CAGR | 7.4% |
| Financial Automation Market Size 2032 | USD 15.77 billion |
The Financial Automation Market is driven by strong competition among top players including Microsoft, Celonis, NICE, Nintex UK Ltd, Tungsten Automation Corporation (Kofax), Automation Anywhere, Inc., IBM, Pegasystems Inc., Blue Prism Limited, and Fortra, LLC. These companies focus on enhancing their portfolios through AI integration, RPA advancements, and cloud-based automation platforms. They invest in secure, compliant, and scalable solutions to meet growing financial sector demands. Strategic collaborations and regional expansion further strengthen their market presence. North America leads the global market with a 34% share, supported by early technology adoption, strong fintech infrastructure, and strict regulatory frameworks that encourage automation investments across banking, insurance, and capital markets.
Market Insights
- The Financial Automation Market was valued at USD 8.91 billion in 2024 and is expected to reach USD 15.77 billion by 2032, growing at a CAGR of 7.4%.
- Rising demand for AI-powered RPA and cloud solutions is driving strong adoption across banking, insurance, and capital markets.
- Leading players are enhancing competitiveness through strategic partnerships, product innovation, and expansion into high-growth regions.
- High initial investment costs and strict regulatory compliance requirements remain key restraints for smaller financial institutions.
- North America leads with a 34% share, supported by advanced fintech infrastructure, while large enterprises dominate the enterprise segment with strong demand for scalable and secure automation platforms.
Market Segmentation Analysis:
By Enterprise Size
Large enterprises lead the financial automation market with a 63% share in 2024. Their dominance stems from strong adoption of end-to-end automated financial workflows, advanced compliance systems, and real-time reporting capabilities. These enterprises invest heavily in automation to reduce operational costs and improve accuracy in complex transactions. SMEs are increasing adoption due to growing access to affordable cloud-based solutions, but their overall market share remains smaller. The demand from large enterprises is driven by the need for scalable infrastructure, regulatory compliance, and faster decision-making processes.
- For instance, Microsoft has integrated AI-powered Copilot tools into its Dynamics 365 Finance platform to automate and streamline financial processes, including tasks related to journal entries.
By Technology
Robotic Process Automation (RPA) holds the dominant share of 41% in 2024. RPA enables organizations to automate repetitive accounting and reconciliation tasks, improving speed and accuracy. It is widely deployed in invoice processing, payment approvals, and audit management. Artificial intelligence and cloud computing follow closely, enabling predictive analytics and secure, scalable platforms. RPA’s dominance is supported by its easy integration with legacy systems, faster ROI, and strong demand from financial institutions aiming to enhance operational efficiency and reduce human error.
- For instance, Chubb embeds insurance in partner platforms via Chubb Studio. According to the company's website, its API ecosystem issues over 10 million digital quotes per day, handles over 15 million monthly claims digitally, and supports over 2 million API calls per month.
By End User
The BFSI segment accounts for the largest market share of 48% in 2024. Banks and financial institutions rely heavily on automation to streamline transactions, detect fraud, and ensure regulatory compliance. Automation solutions enhance customer experience through real-time processing and reduce operational costs by minimizing manual interventions. Other sectors such as manufacturing, healthcare, retail, and IT are also expanding adoption to improve financial visibility and process accuracy. However, BFSI remains the core driver due to its high transaction volumes and need for advanced risk management.
Key Growth Drivers
Rising Demand for Real-Time Financial Insights
Financial institutions are rapidly adopting automation to enhance real-time decision-making. Automation tools allow instant reconciliation, faster reporting, and improved cash flow visibility. This improves strategic planning and reduces operational delays. CFOs increasingly prioritize automated forecasting to respond faster to market changes. Advanced tools like AI-powered analytics and automated dashboards support compliance and accuracy. This strong demand for data-driven financial insights continues to fuel market growth.
- For instance, Allstate uses generative AI to draft claims-related emails, which are reviewed by agents before being sent. A separate cognitive agent, Amelia, handles over 250,000 monthly conversations with customers, resolving about 75% of inquiries on the first contact.
Cost Optimization and Operational Efficiency
Companies are investing in financial automation to cut manual workload and operating costs. Automated workflows eliminate repetitive accounting tasks, reducing error rates and improving team productivity. Businesses gain faster processing times in invoicing, accounts payable, and payroll. Cost savings enable organizations to allocate resources toward innovation. This efficiency is especially attractive to large enterprises managing high transaction volumes. As a result, automation adoption is rising steadily across industries.
- For instance, Imetrik is a telematics service provider for usage-based insurance (UBI). The company, a global player in the industry, has over 800,000 connected vehicles, offering services to both insurers and vehicle finance companies.
Growing Compliance and Risk Management Needs
Tighter financial regulations are driving the adoption of automation solutions. Automated compliance systems ensure accurate reporting, maintain audit trails, and detect anomalies in real time. These features help firms meet regulatory requirements and avoid penalties. Financial automation tools also strengthen fraud detection through AI and machine learning models. Industries like banking, insurance, and retail are integrating these solutions to manage growing compliance burdens. This regulatory push plays a key role in market expansion
Key Trends & Opportunities
Integration of AI and Machine Learning
AI and ML are transforming financial automation with predictive capabilities and smart processing. These technologies automate complex tasks like anomaly detection, forecasting, and reconciliation. Intelligent algorithms enhance accuracy while reducing the need for manual intervention. Vendors are launching AI-enabled platforms to boost decision-making and operational speed. This integration creates new opportunities for innovation across finance functions, especially for large organizations handling massive datasets.
- For instance, Agero processes approximately 12 million service events annually through its Swoop dispatch and accident management network for its clients, which include insurance carriers and auto manufacturers.
Expansion of Cloud-Based Financial Automation Solutions
Cloud deployment is becoming a preferred choice due to its scalability and flexibility. Businesses benefit from lower infrastructure costs, real-time data access, and improved security. Cloud solutions allow companies to integrate automation tools seamlessly across regions. Many vendors now offer hybrid or fully cloud-based platforms to meet diverse needs. This trend supports broader adoption across SMEs and large enterprises seeking modernization.
- For instance, Semtech announced that the HL7900 module had been certified by major US carriers AT&T, T-Mobile, and Verizon, as well as the Japanese carrier KDDI.
Rising Adoption of Embedded Finance and API-Driven Models
Embedded finance and open API frameworks are simplifying automation across financial systems. These solutions allow faster integration of payment gateways, banking systems, and ERPs. Businesses can build flexible workflows without heavy infrastructure investment. This model boosts speed, improves transparency, and creates opportunities for fintech partnerships. Such ecosystem-driven innovation is expected to shape the next phase of financial automation.
Key Challenges
High Initial Implementation Costs
Despite long-term savings, the initial cost of deploying automation remains high. Investment includes software, integration, staff training, and system upgrades. This creates barriers for SMEs with limited budgets. Complex legacy systems further increase implementation costs. Companies often struggle to justify these expenses in the short term, slowing adoption.
Data Security and Privacy Concerns
Financial automation involves sensitive data, making security a critical issue. Cloud-based systems face risks such as unauthorized access, data breaches, and compliance violations. Companies must invest in robust encryption and cybersecurity frameworks. Meeting strict data protection regulations adds extra complexity. These security concerns continue to challenge broader adoption of financial automation solutions.
Regional Analysis
North America
North America holds a 34% share of the Financial Automation Market in 2024. The region benefits from high digital adoption in banking, insurance, and investment sectors. The U.S. leads with widespread implementation of AI-driven process automation and RPA platforms in large enterprises. Major banks integrate automated compliance tools to improve transaction monitoring and reduce manual errors. Strong regulatory frameworks support secure digital transformations. Canada is expanding cloud-based financial solutions for mid-sized firms. Continuous investment in fintech infrastructure and advanced analytics tools positions the region as a core innovation hub in financial automation.
Europe
Europe captures a 29% market share in the global Financial Automation Market. The region focuses on regulatory compliance and operational transparency, driving automation in banking and insurance. Countries like Germany, France, and the UK are investing in AI-enabled workflow tools to streamline financial reporting and fraud detection. Open banking regulations support the rapid adoption of automated transaction processing. Fintech firms collaborate with banks to deliver efficient digital solutions. Strong cybersecurity frameworks enhance trust in automated platforms, while growing SME digital transformation further boosts regional demand for automated financial tools.
Asia Pacific
Asia Pacific accounts for a 26% share of the Financial Automation Market and shows strong growth potential. Rapid digitalization in China, India, and Japan is driving adoption of RPA, cloud platforms, and AI-powered tools in financial institutions. Rising transaction volumes in banking and e-commerce sectors increase the need for automated workflows. Governments support digital payment ecosystems and fintech innovation, expanding opportunities for automation providers. Regional banks are investing in scalable platforms to reduce operational costs and enhance service delivery. Strong SME growth and fintech expansion make Asia Pacific a key growth region.
Latin America
Latin America holds an 8% market share in the Financial Automation Market. The region is adopting automation to reduce operational inefficiencies in banking and insurance. Brazil and Mexico lead in implementing AI-based transaction monitoring and automated reporting. Regulatory modernization supports secure digital payments and financial transparency. Fintech startups are driving low-cost automation solutions for underserved markets. Cloud migration is increasing among mid-sized banks to enable real-time financial processing. Despite infrastructure challenges, the region’s growing digital economy supports steady adoption of financial automation tools across multiple industries.
Middle East & Africa
The Middle East & Africa region represents a 3% share of the Financial Automation Market. Financial institutions are gradually shifting toward digital platforms to improve operational resilience. The UAE and Saudi Arabia lead with strong investments in fintech infrastructure and AI-driven automation systems. Banks adopt RPA solutions to enhance customer onboarding and compliance workflows. Government-led digital transformation programs support secure payment automation and data integration. Africa’s fintech startups are bridging service gaps with affordable solutions. Although market maturity is lower than other regions, rising investments create significant growth opportunities.
Market Segmentations:
By Enterprise Size:
- SME
- Large Enterprises
By Technology:
- Robotic Process Automation
- Artificial Intelligence
By End User:
- BFSI
- Manufacturing
By Geography
- North America
- U.S.
- Canada
- Mexico
- Europe
- Germany
- France
- U.K.
- Italy
- Spain
- Rest of Europe
- Asia Pacific
- China
- Japan
- India
- South Korea
- South-east Asia
- Rest of Asia Pacific
- Latin America
- Brazil
- Argentina
- Rest of Latin America
- Middle East & Africa
- GCC Countries
- South Africa
- Rest of the Middle East and Africa
Competitive Landscape
The competitive landscape of the Financial Automation Market is shaped by key players including Microsoft, Celonis, NICE, Nintex UK Ltd, Tungsten Automation Corporation (Kofax), Automation Anywhere, Inc., IBM, Pegasystems Inc., Blue Prism Limited, and Fortra, LLC. The Financial Automation Market is defined by rapid innovation, strategic partnerships, and technology integration. Companies are focusing on expanding their automation capabilities through AI, RPA, and cloud-native platforms to meet rising demand from financial institutions. Advanced automation tools support fraud detection, regulatory compliance, and real-time reporting, enabling organizations to reduce manual workloads and enhance operational efficiency. Vendors are also strengthening cybersecurity measures to address strict financial regulations and data protection standards. Strong investment in product innovation, regional expansion, and ecosystem partnerships is intensifying competition and accelerating market growth.
Key Player Analysis
- Microsoft
- Celonis
- NICE
- Nintex UK Ltd
- Tungsten Automation Corporation (Kofax)
- Automation Anywhere, Inc.
- IBM
- Pegasystems Inc.
- Blue Prism Limited
- Fortra, LLC
Recent Developments
- In September 2025, Oxa tapped NVIDIA to enhance industrial mobility automation. A self-driving vehicle software introduces, reinforcing its collaboration with the leader in the AI processor to expand its plans in the IMA sector.
- In July 2024, Celonis, a key business participant in the intelligent process automation industry, and Emporix, a prominent organization in commerce orchestration, partnered to develop and launch end-to-end process optimization and process orchestration solutions driven by AI technology.
- In June 2024, Nintex UK Ltd, a process intelligence and automation industry participant, announced the launch of AI-powered improvements in the company's Nintex Process Platform. The new feature, which includes generative AI and native data storage, has significantly enhanced the platform's AI capabilities.
- In February 2023, ABB introduced an updated version of its ABB Ability™ Symphony® Plus distributed control system (DCS) to drive digital transformation in the power generation and water industries. DCS offers a secure OPC UA connection to Edge and Cloud environments, supporting digital advancement while maintaining core control and automation functions.
Report Coverage
The research report offers an in-depth analysis based on Enterprise Size, Technology, End-User and Geography. It details leading market players, providing an overview of their business, product offerings, investments, revenue streams, and key applications. Additionally, the report includes insights into the competitive environment, SWOT analysis, current market trends, as well as the primary drivers and constraints. Furthermore, it discusses various factors that have driven market expansion in recent years. The report also explores market dynamics, regulatory scenarios, and technological advancements that are shaping the industry. It assesses the impact of external factors and global economic changes on market growth. Lastly, it provides strategic recommendations for new entrants and established companies to navigate the complexities of the market.
Future Outlook
- The adoption of AI-driven automation will increase across financial institutions.
- RPA platforms will become more advanced, improving speed and accuracy in transactions.
- Cloud-based automation solutions will gain stronger preference for scalability.
- Regulatory compliance will drive higher investment in secure automation systems.
- Process mining and analytics tools will see wider integration into financial workflows.
- Real-time monitoring and reporting features will enhance operational transparency.
- SMEs will increasingly adopt low-cost automation platforms for efficiency.
- Partnerships between fintech firms and banks will strengthen innovation pipelines.
- Automation will play a key role in improving fraud detection and prevention.
- Global expansion of automation solutions will support digital transformation in emerging markets.

Request a Free Sample
Fill in your details and we'll send you a free sample report.
- Sample data tables & charts
- Research methodology
Need a Custom Version of This Report?
Tailor the scope, geography, or segments to your exact requirements.
- Custom geography or segment scope
- Direct access to our analyst team
Frequently Asked Questions
What is the current market size for the Financial Automation Market, and what is its projected size in 2032?
At what Compound Annual Growth Rate is the Financial Automation Market projected to grow between 2025 and 2032?
Which Financial Automation Market segment held the largest share in 2024?
What are the primary factors fueling the growth of the Financial Automation Market?
Who are the leading companies in the Financial Automation Market?
Table of Content
Chapter 1 Market Segmentation
- 1.1 Segmentation Framework
- 1.1.1 Product and Service Classification
- 1.1.2 Application and End-Use Classification
- 1.1.3 Technology and Solution Classification
- 1.1.4 Customer and Distribution Channel Classification
- 1.1.5 Geographic Segmentation
- 1.1.6 Market Segment Definitions and Boundaries
Chapter 2 Introduction
- 2.1 Report Objectives and Scope
- 2.2 Product Definition and Industry Terminology
- 2.3 Market Inclusions and Exclusions
- 2.4 Research Process
- 2.4.1 Primary Research and Expert Interviews
- 2.4.2 Secondary Research and Source Review
- 2.4.3 Top-Down and Bottom-Up Estimation
- 2.4.4 Data Triangulation and Verification
- 2.5 Market Size Measurement Basis
- 2.5.1 2024: USD 8.91 billion → 2032: USD 15.77 billion
- 2.6 Historical and Forecast Reference Periods
- 2.6.1 Base Year: 2024
- 2.6.2 Forecast Period: 2024-2032
- 2.7 Research Assumptions and Limitations
Chapter 3 Executive Summary
- 3.1 Market Snapshot and Key Findings
- 3.2 Base-Year Market Size, 2024
- 3.3 Forecast Market Size, 2032
- 3.4 Revenue and Volume Growth Outlook
- 3.5 Key Demand and Supply Indicators
- 3.6 Leading Market Segments
- 3.7 Fastest-Growing Market Opportunities
- 3.8 Regional Performance Highlights
- 3.9 Technology and Industry Transformation
- 3.10 Competitive Landscape Summary
- 3.11 Analyst View and Strategic Implications
Chapter 4 Global Financial Automation Market Trends and Developments
- 4.1 Historical Industry Development
- 4.2 Recent Market Trends and Developments
- 4.3 Demand and Customer Behavior Trends
- 4.4 Technology and Product Innovation
- 4.5 Artificial Intelligence, Automation and Digitalization
- 4.6 Local Manufacturing and Supply Chain Realignment
- 4.7 Industry Partnerships, Mergers and Acquisitions
- 4.8 Sustainability and Circular Economy Developments
- 4.9 Government and Private Sector Investment Trends
- 4.10 Emerging Business Models and Commercialization
- 4.11 Industry Developments and Announcements
Chapter 5 Global Financial Automation Market Production, Supply and Demand Analysis
- 5.1 Demand Trend and Consumption Analysis
- 5.2 Demand Forecast, 2024-2032
- 5.3 Production and Output Trend
- 5.4 Production and Output Forecast, 2024-2032
- 5.5 Installed Capacity and Capacity Utilization
- 5.6 Company-Wise Production Plants and Statistics
- 5.6.1 Installed Production Capacity
- 5.6.2 Actual Production
- 5.6.3 Planned Capacity and Expansion Targets
- 5.7 Supply Chain Structure and Procurement Trends
- 5.8 Supply-Demand Gap and Bottlenecks
- 5.9 Import Dependence and Sourcing Structure
- 5.10 Contract Manufacturing and Outsourcing
- 5.11 Regional Supply and Demand Concentration
Chapter 6 Global Financial Automation Market Pricing Analysis
- 6.1 Pricing Structure and Measurement
- 6.2 Historical Pricing Trends
- 6.3 Pricing Outlook, 2024-2032
- 6.4 Average Selling Price and Unit Economics
- 6.5 Pricing by Product and Market Segment
- 6.6 Geographic Pricing Differences
- 6.7 Key Input, Energy, Labor and Logistics Costs
- 6.8 Contract Pricing and Purchasing Models
- 6.9 Pricing Sensitivity and Competitive Positioning
- 6.10 Price, Margin and Profitability Implications
Chapter 7 Global Financial Automation Market Dynamics
- 7.1 Market Growth Drivers
- 7.1.1 Demand-Side Drivers
- 7.1.2 Technology and Innovation Drivers
- 7.1.3 Infrastructure and Investment Drivers
- 7.1.4 Regulatory and Policy Drivers
- 7.2 Market Restraints
- 7.2.1 Cost and Affordability Constraints
- 7.2.2 Technology and Adoption Barriers
- 7.2.3 Supply Chain and Operational Constraints
- 7.3 Market Challenges
- 7.3.1 Competitive Pressure and Margin Erosion
- 7.3.2 Skills, Infrastructure and Implementation Gaps
- 7.4 Emerging Market Opportunities
- 7.5 Market Dynamics Impact and Time-Horizon Assessment
Chapter 8 Global Financial Automation Value Chain Analysis
- 8.1 Industry Value Chain Overview
- 8.2 Upstream Suppliers and Critical Inputs
- 8.3 Technology and Component Providers
- 8.4 Manufacturing or Service Delivery
- 8.5 Distribution, Channel Partners and Integrators
- 8.6 Downstream Applications and End Users
- 8.7 Value Addition and Profit Pools
- 8.8 Vertical Integration and Outsourcing
- 8.9 Supplier Concentration and Risk
- 8.10 Supply Chain Localization and Resilience
Chapter 9 Global Financial Automation Market Regulations and Policies
- 9.1 Relevant Laws, Standards and Compliance Frameworks
- 9.2 Product, Service, Safety and Quality Requirements
- 9.3 Government Policies, Incentives and Subsidies
- 9.4 Imports, Exports and Trade Barriers
- 9.5 Public Procurement and Local Content Requirements
- 9.6 Environmental and Sustainability Compliance
- 9.7 Data Protection, AI and Cybersecurity Compliance
- 9.8 Upcoming Policy Changes and Market Implications
Chapter 10 Global Financial Automation Market Hotspots and Opportunities
- 10.1 Market Opportunity Mapping and Growth Hotspots
- 10.2 High-Growth Applications and Customer Groups
- 10.3 Underserved Markets and White-Space Opportunities
- 10.4 Emerging Technology and Product Opportunities
- 10.5 New Capacity and Investment Hotspots
- 10.6 Market Entry and Expansion Opportunities
- 10.7 Distribution and Partnership Opportunities
- 10.8 Near-Term and Long-Term Commercial Potential
- 10.9 Opportunity Attractiveness and Execution Risks
Chapter 11 Global Financial Automation Market Outlook, 2024-2032
- 11.1 Market Size and Analysis
- 11.1.1 Revenue (Market Measurement: 2024: USD 8.91 billion → 2032: USD 15.77 billion)
- 11.1.2 Market Volume and Quantity Sold
- 11.1.3 Historical Market Size
- 11.1.4 Base-Year Market Size, 2024
- 11.2 Market Forecast, 2024-2032
- 11.2.1 Revenue Forecast to 2032
- 11.2.2 Volume Forecast to 2032
- 11.2.3 CAGR and Year-on-Year Growth
- 11.2.4 Incremental Revenue Opportunity
- 11.3 Forecast Assumptions and Scenario Analysis
- 11.3.1 Base-Case Forecast
- 11.3.2 Optimistic and Conservative Scenarios
- 11.3.3 Technology, Pricing and Policy Sensitivities
- 11.4 Market Attractiveness and Growth Outlook
Chapter 12 Global Financial Automation Market Segmentation and Outlook
- 12.1 Segmentation Summary and Market Shares, 2024
- 12.2 Largest and Fastest-Growing Segments
- 12.3 Segment Growth Comparison
- 12.4 Segment Attractiveness and Priority Matrix
Chapter 13 Global Financial Automation Geographic Market Outlook, 2024-2032
- 13.1 Regional Market Size and Share, 2024
- 13.2 Regional Market Forecast, 2024-2032
- 13.3 Regional Pricing, Production and Demand Differences
- 13.4 North America
- 13.4.1 United States
- 13.4.2 Canada
- 13.4.3 Mexico
- 13.5 Europe
- 13.5.1 Germany
- 13.5.2 France
- 13.5.3 Italy
- 13.5.4 United Kingdom
- 13.5.5 Spain
- 13.5.6 Poland
- 13.5.7 Russia
- 13.5.8 Netherlands
- 13.5.9 Belgium
- 13.5.10 Sweden
- 13.5.11 Denmark
- 13.5.12 Norway
- 13.5.13 Rest of Europe
- 13.6 Asia Pacific
- 13.6.1 China
- 13.6.2 India
- 13.6.3 Japan
- 13.6.4 South Korea
- 13.6.5 Thailand
- 13.6.6 Indonesia
- 13.6.7 Vietnam
- 13.6.8 Malaysia
- 13.6.9 Australia
- 13.6.10 Rest of Asia Pacific
- 13.7 Latin America
- 13.7.1 Brazil
- 13.7.2 Argentina
- 13.7.3 Colombia
- 13.7.4 Chile
- 13.7.5 Rest of Latin America
- 13.8 Middle East
- 13.8.1 Saudi Arabia
- 13.8.2 United Arab Emirates
- 13.8.3 Turkey
- 13.8.4 Israel
- 13.8.5 Iran
- 13.8.6 Rest of the Middle East
- 13.9 Africa
- 13.9.1 South Africa
- 13.9.2 Egypt
- 13.9.3 Nigeria
- 13.9.4 Morocco
- 13.9.5 Rest of Africa
- 13.10 Regional Investment, Policy and Supply Chain Differences
- 13.11 Regional Competitive Landscape
- 13.12 Geographic Growth Hotspots
Chapter 14 Global Financial Automation Technology, Innovation and Sustainability Outlook
- 14.1 Technology Landscape and Maturity
- 14.2 Product, Process and Service Innovation
- 14.3 AI, Automation and Digital Tools in the Industry
- 14.4 Technology Adoption and Performance Benchmarking
- 14.5 Innovation Pipeline and R&D Investment
- 14.6 Patent and Intellectual Property Trends
- 14.7 Energy Efficiency and Resource Management
- 14.8 Sustainability, Recycling and Circularity
- 14.9 Technology Roadmap, 2024-2032
- 14.10 Risks of Obsolescence and Technology Substitution
Chapter 15 Global Financial Automation Market Key Strategic Imperatives
- 15.1 Growth and Market Entry Priorities
- 15.2 High-Return Products and Segments
- 15.3 Pricing, Profitability and Cost Optimization
- 15.4 Technology Investment and Product Differentiation
- 15.5 Supply Chain Localization and Resilience
- 15.6 Distribution and Customer Acquisition
- 15.7 Partnership, Acquisition and Capacity Strategy
- 15.8 Regional Expansion Priorities
- 15.9 Short-, Medium- and Long-Term Actions
Chapter 16 Competition Outlook
- 16.1 Industry Competition Characteristics
- 16.2 Market Structure and Concentration
- 16.3 Market Share and Competitive Positioning, 2024
- 16.4 Company-Wise Revenue and Product Benchmarking
- 16.5 Production and Service Capacity Benchmarking
- 16.6 Technology, Pricing and Differentiation
- 16.7 Regional Footprint and Distribution Strength
- 16.8 Mergers, Acquisitions and Strategic Alliances
- 16.9 New Entrants and Competitive Threats
- 16.10 Porter's Five Forces and Industry Attractiveness
- 16.11 Competitive Outlook, 2024-2032
Chapter 17 Company Profiles
- 17.1 Company Coverage and Selection Criteria
- 17.2 Leading Market Participants – Standard Profile Structure
- 17.2.1 Business Description
- 17.2.2 Company Ownership and Geographic Presence
- 17.2.3 Product and Service Portfolio
- 17.2.4 Manufacturing and Operating Footprint
- 17.2.5 Production Capacity and Expansion Plans
- 17.2.6 Financial Performance and Investment
- 17.2.7 Market Share and Competitive Position
- 17.2.8 Technology and Innovation Capabilities
- 17.2.9 Strategic Alliances or Partnerships
- 17.2.10 Recent Developments
- 17.2.11 Growth Strategy and Outlook
- 17.3 Other Relevant Market Participants
Note: Every listed company is profiled on the structure shown under the first company. The company list is preliminary and may change based on research findings, market developments, data availability and client requirements.
Chapter 18 Disclaimer
- 18.1 Research and Forecast Disclaimer
- 18.2 Data Source and Estimation Limitations
Note: The depth of individual sections depends on data availability for this market. Volume, capacity, trade and other unit-based metrics are included where applicable.

