Home » Automotive & Transportation » Shipping Container Market

Shipping Containers Market By Type (Dry Containers, Reefer Containers, Tank Containers, Others); By Application (Consumer Goods Transport, Food Transport, Industrial Transport, Others); By Product (ISO Containers, Non-standardized Containers); By Size (20’ Containers, 40’ Containers, High Cube Containers, Others); By Flooring (Wood, Bamboo, Metal, Vinyl, Others) – Growth, Share, Opportunities & Competitive Analysis, 2024 – 2032

Report ID: 10735 | Report Format : Excel, PDF

REPORT ATTRIBUTE DETAILS
Historical Period 2020-2023
Base Year 2024
Forecast Period 2025-2032
Shipping Containers Market Size 2024 USD 10,299.41 million
Shipping Containers Market, CAGR 3.96%
Shipping Containers Market Size 2032 USD 14,003.34 million

Market Overview

The Shipping Containers Market size was valued at USD 9,450.00 million in 2018, increased to USD 10,299.41 million in 2024, and is anticipated to reach USD 14,003.34 million by 2032, growing at a CAGR of 3.96% during the forecast period.

The shipping containers market is led by prominent players such as China International Marine Containers (Group) Ltd., COSCO SHIPPING Development Co., Ltd., Singamas Container Holdings Limited, A.P. Moller – Maersk, Bulkhaul Limited, and TLS Offshore Containers. These companies dominate the market through extensive global networks, large-scale manufacturing, and continuous innovation in container design and smart tracking technologies. Asia Pacific emerges as the leading region, accounting for approximately 26% of the global market share in 2024, driven by high export volumes from China, Japan, and South Korea, along with expanding port infrastructure. North America and Europe follow, supported by well-established logistics systems and increasing intermodal transport activities.

Shipping Containers Market size

Market Insights

  • The shipping containers market was valued at USD 9,450.00 million in 2018, reached USD 10,299.41 million in 2024, and is projected to reach USD 14,003.34 million by 2032, growing at a CAGR of 3.96% during the forecast period.
  • Rising international trade, the expansion of the e-commerce sector, and the growing need for efficient and cost-effective transportation solutions are key drivers boosting market growth.
  • Dry containers dominate the market by type, while consumer goods transport leads the application segment due to increasing global consumer demand and widespread adoption in retail supply chains.
  • The market is competitive with key players like China International Marine Containers, COSCO SHIPPING, and Singamas Container Holdings focusing on product innovation, smart container technology, and strategic partnerships; however, fluctuating raw material prices and high initial investment costs pose significant restraints.
  • Asia Pacific holds the largest regional share of 26%, followed by North America at 39% and Europe at 25%, driven by trade volume and infrastructure development.

Access crucial information at unmatched prices!

Request your sample report today & start making informed decisions powered by Credence Research Inc.!

Download Sample

Market Segmentation Analysis:

By Type:

dry containers hold the dominant market share, accounting for over 65% of the segment in 2024. Dry containers are widely preferred due to their versatility in transporting various goods, including electronics, textiles, and machinery, which drives their extensive adoption across global trade routes. Additionally, their cost-efficiency and widespread availability make them the container of choice for shipping companies. Reefer containers, used primarily for temperature-sensitive goods, are experiencing steady growth, while tank containers and other specialized types serve niche markets, supported by increasing demand for bulk liquid and hazardous material transport.

  • For instance, China International Marine Containers (Group) Ltd. (CIMC) produced over 1.5 million twenty-foot equivalent units (TEUs) of dry containers in 2023, reinforcing its global leadership in standard container production.

By Application:

The consumer goods transport segment leads the market, capturing approximately 40% of the total share in 2024. This dominance is driven by the surging demand for international trade in consumer products, fueled by globalization and e-commerce expansion. The seamless movement of a wide variety of goods, from clothing to electronics, has amplified the need for efficient containerized shipping. The food transport segment follows closely, supported by growing demand for cold chain logistics and reefer containers. Industrial transport is also gaining momentum, particularly in emerging economies investing in heavy machinery and raw material imports.

  • For instance, Maersk handled over 12 million containers of consumer goods in 2023 across its global network, highlighting the scale of its involvement in consumer-driven container shipping.

By Product:

ISO containers lead the product segment in the shipping containers market, capturing the majority market share in 2024. These containers are standardized for global use, making them essential for seamless intermodal transportation across sea, rail, and road. The uniformity in size and design ensures easy handling, storage, and stacking, which significantly reduces logistics costs and improves operational efficiency. Demand for ISO containers is further supported by international regulations that promote container standardization to facilitate global trade. In contrast, non-standardized containers cater to niche requirements and possess a relatively smaller market share due to limited compatibility.

Market Overview

Expansion of Global Trade

The continuous growth of international trade significantly drives the demand for shipping containers. As globalization accelerates, the need for efficient transportation of goods across continents increases, boosting container utilization. Major economies, including China, the United States, and countries in Europe, rely heavily on containerized cargo to support export and import activities. Additionally, the increasing volume of cross-border e-commerce and consumer goods trade enhances container throughput at ports, propelling steady growth in the shipping container market.

  • For instance, the Port of Shanghai processed over 47.3 million TEUs of containers in 2023, maintaining its position as the world’s busiest container port and underscoring the massive scale of global container trade.

Rising Demand for Cold Chain Logistics

The surge in demand for perishable goods, pharmaceuticals, and temperature-sensitive products globally has accelerated the adoption of refrigerated (reefer) containers. These containers are essential for maintaining product integrity during long-haul transportation, particularly in the food and healthcare sectors. The growth of global cold chain networks and stricter food safety regulations have further emphasized the need for reliable, temperature-controlled shipping solutions, directly contributing to the expanding shipping containers market.

  • For instance, Carrier Transicold delivered over 1.2 million operational reefer units by 2023, supporting global cold chain logistics with its advanced refrigeration technology capable of maintaining temperatures as low as -30°C.

Intermodal Transportation Growth

The increasing preference for intermodal transportation is a key growth driver for the shipping containers market. Containers offer seamless transferability between ships, trucks, and trains without the need to unload goods, improving efficiency and reducing handling costs. Governments and logistics providers worldwide are investing in intermodal infrastructure to enhance supply chain efficiency and reduce carbon emissions, which further supports the demand for standardized shipping containers that can easily transition between different modes of transport.

Key Trends & Opportunities

Adoption of Smart Containers

The integration of smart technologies into shipping containers is a growing trend that presents significant market opportunities. Smart containers equipped with GPS tracking, real-time monitoring sensors, and temperature control systems enhance supply chain visibility and improve cargo safety. Logistics companies increasingly prefer these containers to optimize asset management and ensure real-time cargo condition updates, creating new revenue streams for container manufacturers and tech providers.

  • For instance, Hapag-Lloyd has deployed over 3,000 smart reefer containers equipped with IoT technology capable of providing real-time location, humidity, and temperature data to customers since the rollout of their ‘Hapag-Lloyd LIVE’ platform.

Shift Toward Sustainable Container Solutions

There is a noticeable shift in the market toward environmentally sustainable shipping container solutions. Companies are exploring the use of recyclable materials, bamboo flooring, and energy-efficient reefer containers to align with global sustainability goals. This trend is driven by regulatory pressures, rising environmental awareness, and customer demand for greener logistics. Adoption of eco-friendly containers not only reduces the carbon footprint but also offers differentiation opportunities for market players.

  • For instance, Maersk’s Star Cool refrigeration technology reduced energy consumption by up to 50% compared to conventional systems in 2023, and CIMC has produced over 30,000 containers with bamboo flooring, significantly reducing reliance on traditional hardwood.

Key Challenges

Fluctuating Steel Prices

The shipping containers market faces significant challenges due to the volatility in steel prices, which directly impacts manufacturing costs. As steel is the primary raw material for container production, price fluctuations can lead to margin pressures and unpredictable procurement expenses for container manufacturers. This unpredictability often forces companies to adjust pricing strategies and may limit profit potential, especially for smaller manufacturers with less purchasing power.

Trade Disruptions and Geopolitical Tensions

Global trade disruptions, such as port congestion, trade restrictions, and geopolitical conflicts, pose substantial challenges to the shipping containers market. Events like trade wars, political instability, and the imposition of tariffs can disrupt supply chains and affect the steady flow of containerized goods. These uncertainties not only impact container demand but also strain shipping schedules and logistics efficiency, creating bottlenecks throughout the supply chain.

Rising Empty Container Repositioning Costs

Managing the imbalance of container supply and demand across different regions is a persistent operational challenge. High repositioning costs for empty containers significantly impact profitability for shipping companies. When containers accumulate in import-heavy regions and shortages occur elsewhere, companies must bear additional expenses to reposition them, often without revenue-generating cargo. Efficiently managing this imbalance remains a complex logistical and financial burden for the industry.

Regional Analysis

North America

North America held a significant position in the global shipping containers market, valued at USD 3,732.75 million in 2018. In 2024, the market size reached USD 4,022.89 million and is projected to attain USD 5,452.76 million by 2032, expanding at a CAGR of 3.9% during the forecast period. North America accounted for approximately 39% of the global market share in 2024, driven by robust trade volumes, advanced intermodal infrastructure, and rising adoption of smart containers. The region benefits from well-established logistics networks, particularly in the United States, which continues to dominate containerized trade across key global shipping routes.

Europe

Europe’s shipping containers market was valued at USD 2,504.25 million in 2018 and reached USD 2,624.01 million in 2024, with a projected value of USD 3,371.34 million by 2032, growing at a CAGR of 3.2%. Europe held around 25% of the global market share in 2024, supported by strong maritime trade activities, especially in countries like Germany, the Netherlands, and the United Kingdom. The region’s market is driven by rising containerization in industrial and food transport applications. Increasing focus on sustainable logistics and the growing deployment of energy-efficient reefer containers also support Europe’s steady market growth.

Asia Pacific

Asia Pacific is the fastest-growing region in the shipping containers market, with a CAGR of 5.1%. The market was valued at USD 2,315.25 million in 2018 and expanded to USD 2,635.06 million in 2024, with expectations to reach USD 3,919.68 million by 2032. Asia Pacific captured around 26% of the global market share in 2024, propelled by high-volume exports from China, Japan, South Korea, and India. The region benefits from the presence of major manufacturing hubs and dynamic port activities. Rapid industrialization, growing e-commerce exports, and the strengthening of intermodal transport systems significantly contribute to the region’s accelerating growth.

Latin America

Latin America’s shipping containers market was valued at USD 420.53 million in 2018 and increased to USD 452.04 million in 2024. It is projected to reach USD 551.31 million by 2032, growing at a CAGR of 2.6%. In 2024, the region accounted for approximately 4% of the global market share. Latin America’s growth is driven by the expanding trade of consumer goods, agricultural products, and increasing port investments across Brazil, Mexico, and Chile. Although growth is moderate compared to Asia Pacific, the region shows steady development with rising intercontinental trade connections and gradual modernization of container handling infrastructure.

Middle East

The Middle East shipping containers market was valued at USD 330.75 million in 2018 and reached USD 335.69 million in 2024, with a projected size of USD 407.57 million by 2032, advancing at a CAGR of 2.5%. In 2024, the region represented around 3% of the global market share. Growth in the Middle East is supported by increasing trade activities, particularly in the UAE and Saudi Arabia, which serve as key logistics hubs. The region’s ongoing investments in port expansions and free trade zones enhance container throughput, although geopolitical instability remains a limiting factor for faster market growth.

Africa

Africa’s shipping containers market stood at USD 146.48 million in 2018 and rose to USD 229.72 million in 2024. It is expected to reach USD 300.67 million by 2032, growing at a CAGR of 3.2%. In 2024, Africa accounted for nearly 2% of the global market share. Market growth is primarily driven by improving trade infrastructure, expanding port capacity, and increased foreign investment in regions such as Nigeria, South Africa, and Kenya. Although the region faces challenges related to logistical inefficiencies and limited connectivity, rising consumer demand and efforts to modernize shipping facilities are gradually boosting container adoption.

Shipping Containers Market segmentation

Market Segmentations:

By Type

  • Dry Containers
  • Reefer Containers
  • Tank Containers
  • Others

By Application

  • Consumer Goods Transport
  • Food Transport
  • Industrial Transport
  • Others

By Product

  • ISO Containers
  • Non-standardized Containers

By Size

  • 20’ Containers
  • 40’ Containers
  • High Cube Containers
  • Others

By Flooring

  • Wood
  • Bamboo
  • Metal
  • Vinyl
  • Others

By Geography

  • North America
    • U.S.
    • Canada
    • Mexico
  • Europe
    • Germany
    • France
    • U.K.
    • Italy
    • Spain
    • Rest of Europe
  • Asia Pacific
    • China
    • Japan
    • India
    • South Korea
    • South-east Asia
    • Rest of Asia Pacific
  • Latin America
    • Brazil
    • Argentina
    • Rest of Latin America
  • Middle East & Africa
    • GCC Countries
    • South Africa
    • Rest of the Middle East and Africa

Competitive Landscape

The shipping containers market is characterized by intense competition, with key players focusing on expanding their global footprint, enhancing product quality, and adopting advanced manufacturing technologies. Leading companies such as China International Marine Containers (Group) Ltd, COSCO SHIPPING Development Co., Ltd., and Singamas Container Holdings Limited dominate the market, supported by large-scale production capacities and extensive distribution networks. These players continuously invest in research and development to introduce durable, lightweight, and environmentally sustainable container solutions. Additionally, market participants are increasingly adopting smart container technologies to offer real-time tracking and improved cargo security. Strategic collaborations, mergers, and acquisitions remain common as companies aim to strengthen their market positions and tap into emerging regions. Smaller and regional manufacturers, such as TLS Offshore Containers and W&K Containers, Inc., focus on niche markets and customized container solutions to maintain competitiveness. Overall, the market displays a mix of global giants and specialized regional providers, fostering both innovation and pricing competition.

Shape Your Report to Specific Countries or Regions & Enjoy 30% Off!

Key Player Analysis

  • P. Moller – Maersk
  • Bertschi AG
  • BNH Gas Tanks
  • Bulkhaul Limited
  • Danteco Industries BV
  • NewPort Tank
  • China International Marine Containers (Group) Ltd
  • COSCO SHIPPING Development Co., Ltd.
  • CXIC Group
  • IWES LTD.
  • Norcomp Nordic AB
  • Singamas Container Holdings Limited
  • TLS Offshore Containers/TLS Special Containers
  • W&K Containers, Inc.
  • Thurston Group Limited
  • OEG
  • Sea Box, Inc.

Recent Developments

  • In February 2024, Africa introduced its inaugural green reefer, marking a milestone in sustainable refrigerated transportation. AxlePower technology, a result of BPW and Thermo King’s collaboration, enhances the continent’s efforts towards a greener industry.
  • In March 2023, Traxens, the leading smart-container service provider for the worldwide supply chain industry, unveiled the Traxens-Box 3, the third version of their permanent container tracker and flagship product for shipping lines, freight forwarders, and BCOS.
  • In March 2023, BobVila.com® rated U-Haul® as “Best Overall” in the Best Moving Container Companies of 2023 category, granting U-Box the Editor’s Choice designation over all competitors.
  • In July 2022, Monoflo International unveiled a new 48” x 40” collapsible bulk container catering to food processing and distribution needs. This durable, high-pressure injection molded container boasts smooth surfaces for strength and ease of use.

Market Concentration & Characteristics

The Shipping Containers Market demonstrates a moderately consolidated structure with a few large players holding significant market shares. It is driven by high-volume production requirements, standardized product specifications, and the need for global logistics compatibility. Major companies like China International Marine Containers, COSCO SHIPPING Development, and Singamas Container Holdings lead the market through large-scale manufacturing capabilities and extensive distribution networks. It focuses on durability, cost-efficiency, and compliance with international shipping standards. Strong regional presence, particularly in Asia Pacific, supports rapid market scalability. Competitive pricing, smart container integration, and sustainability advancements shape product differentiation. Smaller manufacturers compete by offering specialized and custom-built container solutions.

Report Coverage

The research report offers an in-depth analysis based on Type, Application, Product, Size, Flooring and Geography. It details leading market players, providing an overview of their business, product offerings, investments, revenue streams, and key applications. Additionally, the report includes insights into the competitive environment, SWOT analysis, current market trends, as well as the primary drivers and constraints. Furthermore, it discusses various factors that have driven market expansion in recent years. The report also explores market dynamics, regulatory scenarios, and technological advancements that are shaping the industry. It assesses the impact of external factors and global economic changes on market growth. Lastly, it provides strategic recommendations for new entrants and established companies to navigate the complexities of the market.

Future Outlook

  1. The shipping containers market is expected to grow steadily due to rising global trade volumes.
  2. Demand for dry containers will continue to dominate driven by their versatility and cost-effectiveness.
  3. Increasing adoption of smart containers with tracking and real-time monitoring features will shape future demand.
  4. Growth in e-commerce and cross-border retail shipments will fuel container usage across multiple industries.
  5. Asia Pacific will remain the fastest-growing region due to strong export activities and expanding port infrastructure.
  6. Environmental regulations will drive the development of eco-friendly and reusable container solutions.
  7. Reefer containers will gain traction supported by rising demand for temperature-sensitive food and pharmaceutical transport.
  8. Technological advancements in container manufacturing will improve durability and reduce operational costs.
  9. Intermodal transportation growth will increase the demand for ISO containers due to their global compatibility.
  10. Strategic partnerships and capacity expansion by key players will intensify market competition over the forecast period.

CHAPTER NO. 1 :      GENESIS OF THE MARKET           

1.1 Market Prelude – Introduction & Scope

1.2 The Big Picture – Objectives & Vision

1.3 Strategic Edge – Unique Value Proposition

1.4 Stakeholder Compass – Key Beneficiaries

CHAPTER NO. 2 :      EXECUTIVE LENS

2.1 Pulse of the Industry – Market Snapshot

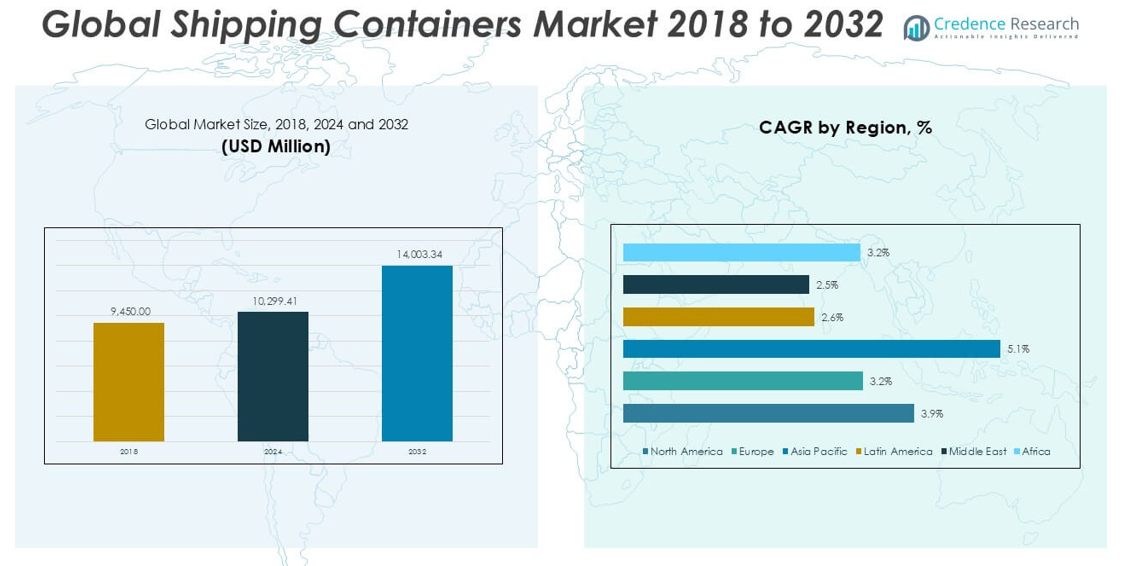
2.2 Growth Arc – Revenue Projections (USD Million)

2.3. Premium Insights – Based on Primary Interviews

CHAPTER NO. 3 :      SHIPPING CONTAINERS MARKET FORCES & INDUSTRY PULSE

3.1 Foundations of Change – Market Overview
3.2 Catalysts of Expansion – Key Market Drivers
3.2.1 Momentum Boosters – Growth Triggers
3.2.2 Innovation Fuel – Disruptive Technologies
3.3 Headwinds & Crosswinds – Market Restraints
3.3.1 Regulatory Tides – Compliance Challenges
3.3.2 Economic Frictions – Inflationary Pressures
3.4 Untapped Horizons – Growth Potential & Opportunities
3.5 Strategic Navigation – Industry Frameworks
3.5.1 Market Equilibrium – Porter’s Five Forces
3.5.2 Ecosystem Dynamics – Value Chain Analysis
3.5.3 Macro Forces – PESTEL Breakdown

3.6 Price Trend Analysis

3.6.1 Regional Price Trend
3.6.2 Price Trend by product

CHAPTER NO. 4 :      KEY INVESTMENT EPICENTER    

4.1 Regional Goldmines – High-Growth Geographies

4.2 Product Frontiers – Lucrative Product Categories

4.3 Application Sweet Spots – Emerging Demand Segments

CHAPTER NO. 5: REVENUE TRAJECTORY & WEALTH MAPPING

5.1 Momentum Metrics – Forecast & Growth Curves

5.2 Regional Revenue Footprint – Market Share Insights

5.3 Segmental Wealth Flow – Type & Application Revenue

CHAPTER NO. 6 :      TRADE & COMMERCE ANALYSIS

6.1.      Import Analysis by Region

6.1.1.    Global Shipping Containers Market Import Revenue By Region

6.2.      Export Analysis by Region

6.2.1.    Global Shipping Containers Market Export Revenue By Region

CHAPTER NO. 7 :      COMPETITION ANALYSIS 

7.1.      Company Market Share Analysis

7.1.1.    Global Shipping Containers Market: Company Market Share

7.2.      Global Shipping Containers Market Company Revenue Market Share

7.3.      Strategic Developments

7.3.1.    Acquisitions & Mergers

7.3.2.    New Product Launch

7.3.3.    Regional Expansion

7.4.      Competitive Dashboard

7.5.    Company Assessment Metrics, 2024

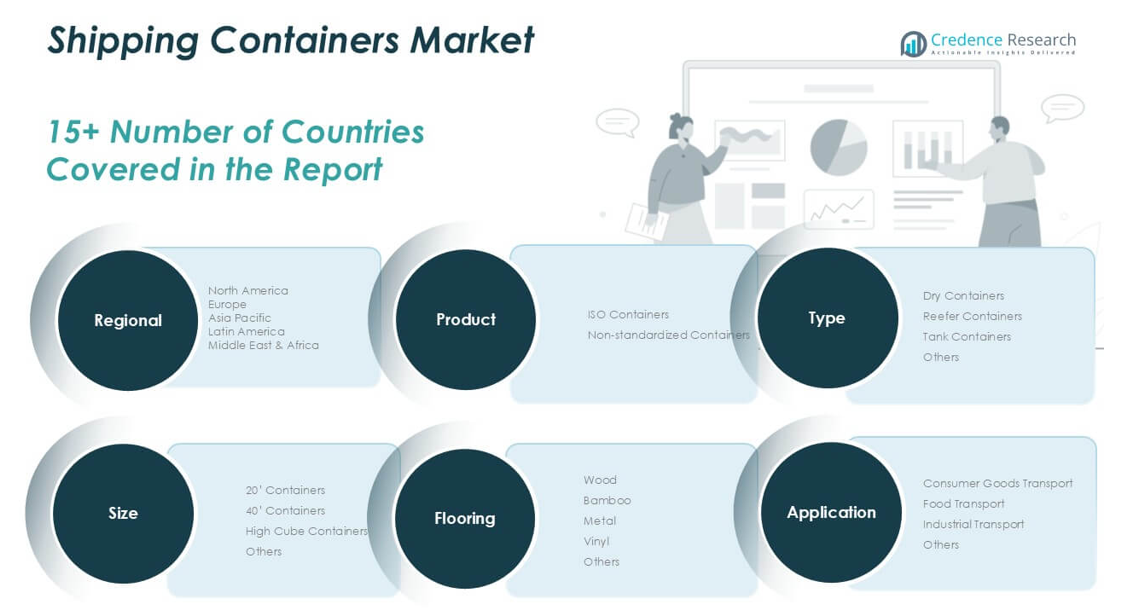
CHAPTER NO. 8 :      SHIPPING CONTAINERS MARKET – BY TYPE SEGMENT ANALYSIS     

8.1.      Shipping Containers Market Overview by Type Segment

8.1.1.    Shipping Containers Market Revenue Share By Type

8.2.      Dry Containers

8.3.      Reefer Containers

8.4.      Tank Containers

8.5.      Others

CHAPTER NO. 9 :      SHIPPING CONTAINERS MARKET – BY APPLICATION SEGMENT ANALYSIS

9.1.      Shipping Containers Market Overview by Application Segment

9.1.1.    Shipping Containers Market Revenue Share By Application

9.2.      Consumer Goods Transport

9.3.      Food Transport

9.4.      Industrial Transport

9.5.      Others

CHAPTER NO. 10 :    SHIPPING CONTAINERS MARKET – BY PRODUCT SEGMENT ANALYSIS

10.1.     Shipping Containers Market Overview by Product Segment

10.1.1.  Shipping Containers Market Revenue Share By Product

10.2.     ISO Containers

10.3.     Non-standardized Containers

CHAPTER NO. 11 :    SHIPPING CONTAINERS MARKET – BY SIZE SEGMENT ANALYSIS

11.1.     Shipping Containers Market Overview by Size Segment

11.1.1.  Shipping Containers Market Revenue Share By Size

11.2.     20’ Containers

11.3.     40’ Containers

11.4.     High Cube Containers

11.5.     Others

CHAPTER NO. 12 :    SHIPPING CONTAINERS MARKET – BY FLOORING SEGMENT ANALYSIS

12.1.     Shipping Containers Market Overview by Flooring Segment

12.1.1.  Shipping Containers Market Revenue Share By Flooring

12.2.     Wood

12.3.     Bamboo

12.4.     Metal

12.5.     Vinyl

12.6.     Others

CHAPTER NO. 13 :    SHIPPING CONTAINERS MARKET – REGIONAL ANALYSIS     

13.1.     Shipping Containers Market Overview by Region Segment

13.1.1.  Global Shipping Containers Market Revenue Share By Region

13.1.2.  Regions

13.1.3.  Global Shipping Containers Market Revenue By Region

13.1.4.  Type

13.1.5.  Global Shipping Containers Market Revenue By Type

13.1.6.  Application

13.1.7.  Global Shipping Containers Market Revenue By Application

13.1.8.  Product

13.1.9.  Global Shipping Containers Market Revenue By Product

13.1.10. Size

13.1.12. Global Shipping Containers Market Revenue By Size

13.1.13. Flooring

13.1.14. Global Shipping Containers Market Revenue By Flooring

CHAPTER NO. 14 :    NORTH AMERICA SHIPPING CONTAINERS MARKET – COUNTRY ANALYSIS         

14.1.     North America Shipping Containers Market Overview by Country Segment

14.1.1.  North America Shipping Containers Market Revenue Share By Region

14.2.     North America

14.2.1.  North America Shipping Containers Market Revenue By Country

14.2.2.  Type

14.2.3.  North America Shipping Containers Market Revenue By Type

14.2.4.  Application

14.2.5.  North America Shipping Containers Market Revenue By Application

14.2.6.  Product

14.2.7.  North America Shipping Containers Market Revenue By Product

14.2.8.  Size

14.2.9.  North America Shipping Containers Market Revenue By Size

14.2.10. Flooring

14.2.11. North America Shipping Containers Market Revenue By Flooring

14.3.     U.S.

14.4.     Canada

14.5.     Mexico

CHAPTER NO. 15 :    EUROPE SHIPPING CONTAINERS MARKET – COUNTRY ANALYSIS     

15.1.     Europe Shipping Containers Market Overview by Country Segment

15.1.1.  Europe Shipping Containers Market Revenue Share By Region

15.2.     Europe

15.2.1.  Europe Shipping Containers Market Revenue By Country

15.2.2.  Type

15.2.3.  Europe Shipping Containers Market Revenue By Type

15.2.4.  Application

15.2.5.  Europe Shipping Containers Market Revenue By Application

15.2.6.  Product

15.2.7.  Europe Shipping Containers Market Revenue By Product

15.2.8.  Size

15.2.9.  Europe Shipping Containers Market Revenue By Size

15.2.10. Flooring

15.2.11. Europe Shipping Containers Market Revenue By Flooring

15.3.     UK

15.4.     France

15.5.     Germany

15.6.     Italy

15.7.     Spain

15.8.     Russia

15.9.   Rest of Europe

CHAPTER NO. 16 :    ASIA PACIFIC SHIPPING CONTAINERS MARKET – COUNTRY ANALYSIS

16.1.     Asia Pacific Shipping Containers Market Overview by Country Segment

16.1.1.  Asia Pacific Shipping Containers Market Revenue Share By Region

16.2.     Asia Pacific

16.2.1.  Asia Pacific Shipping Containers Market Revenue By Country

16.2.2.  Type

16.2.3.  Asia Pacific Shipping Containers Market Revenue By Type

16.2.4.  Application

16.2.5.  Asia Pacific Shipping Containers Market Revenue By Application

16.2.6.  Product

16.2.7.  Asia Pacific Shipping Containers Market Revenue By Product

16.2.8.  Size

16.2.9.  Asia Pacific Shipping Containers Market Revenue By Size

16.2.10. Flooring

16.2.11. Asia Pacific Shipping Containers Market Revenue By Flooring

16.3.     China

16.4.     Japan

16.5.     South Korea

16.6.     India

16.7.     Australia

16.8.     Southeast Asia

16.9.     Rest of Asia Pacific

CHAPTER NO. 17 :    LATIN AMERICA SHIPPING CONTAINERS MARKET – COUNTRY ANALYSIS

17.1.     Latin America Shipping Containers Market Overview by Country Segment

17.1.1.  Latin America Shipping Containers Market Revenue Share By Region

17.2.     Latin America

17.2.1.  Latin America Shipping Containers Market Revenue By Country

17.2.2.  Type

17.2.3.  Latin America Shipping Containers Market Revenue By Type

17.2.4.  Application

17.2.5.  Latin America Shipping Containers Market Revenue By Application

17.2.6.  Product

17.2.7.  Latin America Shipping Containers Market Revenue By Product

17.2.8.  Size

17.2.9.  Latin America Shipping Containers Market Revenue By Size

17.2.10. Flooring

17.2.11. Latin America Shipping Containers Market Revenue By Flooring

17.3.     Brazil

17.4.     Argentina

17.5.     Rest of Latin America

CHAPTER NO. 18 :    MIDDLE EAST SHIPPING CONTAINERS MARKET – COUNTRY ANALYSIS

18.1.     Middle East Shipping Containers Market Overview by Country Segment

18.1.1.  Middle East Shipping Containers Market Revenue Share By Region

18.2.     Middle East

18.2.1.  Middle East Shipping Containers Market Revenue By Country

18.2.2.  Type

18.2.3.  Middle East Shipping Containers Market Revenue By Type

18.2.4.  Application

18.2.5.  Middle East Shipping Containers Market Revenue By Application

18.2.6.  Product

18.2.7.  Middle East Shipping Containers Market Revenue By Product

18.2.8.  Size

18.2.9.  Middle East Shipping Containers Market Revenue By Size

18.2.10. Flooring

18.2.11. Middle East Shipping Containers Market Revenue By Flooring

18.3.     GCC Countries

18.4.     Israel

18.5.     Turkey

18.6.     Rest of Middle East

CHAPTER NO. 19 :    AFRICA SHIPPING CONTAINERS MARKET – COUNTRY ANALYSIS     

19.1.     Africa Shipping Containers Market Overview by Country Segment

19.1.1.  Africa Shipping Containers Market Revenue Share By Region

19.2.     Africa

19.2.1.  Africa Shipping Containers Market Revenue By Country

19.2.2.  Type

19.2.3.  Africa Shipping Containers Market Revenue By Type

19.2.4.  Application

19.2.5.  Africa Shipping Containers Market Revenue By Application

19.2.6.  Product

19.2.7.  Africa Shipping Containers Market Revenue By Product

19.2.8.  Size

19.2.9.  Africa Shipping Containers Market Revenue By Size

19.2.10. Flooring

19.2.11. Africa Shipping Containers Market Revenue By Flooring

19.3.     South Africa

19.4.     Egypt

19.5.     Rest of Africa

CHAPTER NO. 20 :    COMPANY PROFILES         

20.1.     A.P. Moller – Maersk

20.1.1.  Company Overview

20.1.2.  Product Portfolio

20.1.3.  Financial Overview

20.1.4.  Recent Developments

20.1.5.  Growth Strategy

20.1.6.  SWOT Analysis

20.2.     Bertschi AG

20.3.     BNH Gas Tanks

20.4.     Bulkhaul Limited

20.5.     Danteco Industries BV

20.6.     NewPort Tank

20.7.     China International Marine Containers (Group) Ltd

20.8.     COSCO SHIPPING Development Co., Ltd.

20.9.     CXIC Group

20.10.   IWES LTD.

20.11.   Norcomp Nordic AB

20.12.   Singamas Container Holdings Limited

20.13.   TLS Offshore Containers/TLS Special Containers

20.14.   W&K Containers, Inc.

20.15.   Thurston Group Limited

20.16.   OEG

20.17.   Sea Box, Inc.


Request Free Sample

Ready to Transform Data into Decisions?

Request Your Sample Report and Start Your Journey of Informed Choices


Providing the strategic compass for industry titans.

cr-clients-logos

Frequently Asked Questions:

What is the current size of the Shipping Container market?

The Shipping Containers Market is valued at USD 10,299.41 million in 2024.

What factors are driving the growth of the Shipping Container market?

The market is driven by increasing global trade, technological advancements in container design, the growth of intermodal transportation, and rising investment in port infrastructure. Additionally, the rise of e-commerce and the need for just-in-time delivery services are fueling demand.

What are the key segments within the Shipping Container market?

The key segments include container size (large containers, small containers, high cube containers) and product type (dry storage containers, flat rack containers, refrigerated containers, special-purpose containers, others).

What are some challenges faced by the Shipping Container market?

Challenges include overcapacity and fluctuations in demand, port congestion and infrastructure bottlenecks, rising shipping costs, supply chain disruptions, environmental concerns, standardization and regulation issues, and labor shortages.

Who are the major players in the Shipping Container market?

Major players include A.P. Moller–Maersk Group, COSCO SHIPPING Development Co. Ltd, China International Marine Containers, Singamas Container Holdings Limited, and CARU Containers.

About Author

Ganesh Chandwade

Ganesh Chandwade

Senior Industry Consultant

Ganesh is a senior industry consultant specializing in heavy industries and advanced materials.

View Profile

Insulated Styrofoam Shipping Boxes Market

The Insulated Styrofoam Shipping Boxes Market is projected to grow from USD 5,005 million in 2024 to USD 7,063.3 million by 2032, at a compound annual growth rate (CAGR) of 4.4%.

Shipping Labels Market

The Shipping Labels Market is projected to grow from USD 2125 million in 2024 to USD 2683.53 million by 2032, at a compound annual growth rate (CAGR) of 2.96%.

Commercial Marine Emission Control Systems Market

The Commercial Marine Emission Control Systems Market size was valued at USD 4197.8 million in 2024 and is anticipated to reach USD 7598.8 million by 2032, growing at a CAGR of 7.7% during the forecast period.

Commercial Dry Marine Scrubber System Market

The Commercial dry marine scrubber system market  size was valued at USD 350.4 million in 2024 and is anticipated to reach USD 713.71 million by 2032, at a CAGR of 9.3 % during the forecast period (2024-2032).

Marine Applications Predictive Maintenance Market

The Global Marine Applications Predictive Maintenance Market size was valued at USD 180.0 million in 2018 to USD 509.2 million in 2024 and is anticipated to reach USD 1,863.2 million by 2032, at a CAGR of 17.69% during the forecast period.

Automated Parcel Delivery Terminals Market

The Automated Parcel Delivery Terminals market size was valued at USD 624.50 million in 2018, increased to USD 925.46 million in 2024, and is anticipated to reach USD 2,204.76 million by 2032, at a CAGR of 11.51% during the forecast period.

Anti-Static Foam Pouch Market

The Global Anti-Static Foam Pouch Market size was valued at USD 157.67 million in 2018 to USD 238.52 million in 2024 and is anticipated to reach USD 412.54 million by 2032, at a CAGR of 6.60% during the forecast period.

Dunnage Air Bags Market

Dunnage Air Bags Market size was valued at USD 471 million in 2024 and is anticipated to reach USD 733.31 million by 2032, at a CAGR of 5.69% during the forecast period (2024-2032).

Bunkering Services Market

The Bunkering Services Market size was valued at USD 1,56,000.00 million in 2018 to USD 1,90,778.14 million in 2024 and is anticipated to reach USD 3,10,717.97 million by 2032, at a CAGR of 6.35% during the forecast period.

Automotive Evaporative Emission Control System Market

The Automotive Evaporative Emission Control System Market was valued at USD 2,433.1 million in 2024 and is expected to reach USD 3,486.7 million by 2032, growing at a compound annual growth rate of 4.6% over the forecast period.

Bus Door System Market

The bus door system market is projected to grow from USD 774.5 million in 2024 to USD 1,161.8 million by 2032, registering a CAGR of 5.2% during the forecast period.

Powertrain Market

The powertrain market size was valued at USD 118230.7 million in 2024 and is anticipated to reach USD 150938.3 million by 2032, at a CAGR of 3.1 % during the forecast period (2024-2032).

Marine Autopilot Control Unit Market

The marine autopilot control unit market is projected to grow from USD 992.5 million in 2024 to USD 1,718.1 million by 2032, registering a CAGR of 7.1% during the forecast period.

Automotive Door Latch and Hinges Market

Automotive Door Latch Market size was valued at USD 3702.5 million in 2024 and is anticipated to reach USD 6127.6 million by 2032, at a CAGR of 6.5% during the forecast period.

Express Delivery Market

The express delivery market size was valued at USD 367958.8 million in 2024 and is anticipated to reach USD 649924.4 million by 2032, at a CAGR of  7.37 % during the forecast period (2024-2032).

Hydrogen Buses Market

The hydrogen buses market is projected to grow from USD 1,262.3 million in 2024 to USD 10,618.1 million by 2032, registering a robust CAGR of 30.5% during the forecast period.

Hatchback Market

The hatchback market size was valued at USD 663910 million in 2024 and is anticipated to reach USD 1140721 million by 2032, at a CAGR of 7 % during the forecast period (2024-2032).

Hardware-In-The-Loop Market

The hardware-in-the-loop market is projected to grow from USD 1,275.7 million in 2024 to USD 3,415.5 million by 2032, registering a CAGR of 13.1% during the forecast period.

Europe Golf Cart Market

Europe Golf Cart Market size was valued at USD 1208.3 million in 2018 to USD 1485.0 million in 2024 and is anticipated to reach USD 2161.4 million by 2032, at a CAGR of 4.80% during the forecast period.

Golf Cart Market

Golf Cart Market size was valued at USD 1,208.3 million in 2018 to USD 1,485.0million in 2024 and is anticipated to reach USD 2,161.4 million by 2032, at a CAGR of 4.90% during the forecast period.

Tanker Trucks Market

The Tanker truck market is projected to grow from USD 26,945 million in 2024 to an estimated USD 34,747.6 million by 2032, reflecting a compound annual growth rate (CAGR) of 3.23% during the forecast period.

Purchase Options

The report comes as a view-only PDF document, optimized for individual clients. This version is recommended for personal digital use and does not allow printing.
$4699

To meet the needs of modern corporate teams, our report comes in two formats: a printable PDF and a data-rich Excel sheet. This package is optimized for internal analysis and multi-location access, making it an excellent choice for organizations with distributed workforce.
$5699

The report will be delivered in printable PDF format along with the report’s data Excel sheet. This license offers 100 Free Analyst hours where the client can utilize Credence Research Inc.’s research team. It is highly recommended for organizations seeking to execute short, customized research projects related to the scope of the purchased report.
$12699

Credence Staff 3

WILLIAM, North America

Support Staff at Credence Research

KEITH PHILLIPS, Europe

Lee - CR Sales Staff

LEE VALLANCE, Asia Pacific

Kieran Jameson

KIERAN JAMESON, Australia

Report delivery within 24 to 48 hours

User Review

Thank you for the data! The numbers are exactly what we asked for and what we need to build our business case.

Materials Scientist
(privacy requested)

User Review

The report was an excellent overview of the Industrial Burners market. This report does a great job of breaking everything down into manageable chunks.

Imre Hof
Management Assistant, Bekaert

cr-clients-logos

Request Sample