Home » Consumer Goods » Bio Vanillin Market

Bio Vanillin Market By Source (Rice Bran, Wood, Others); By Application (Food and Beverages, Cosmetics and Personal Care, Pharmaceuticals, Fragrances, Chemicals, Detergents, Household) – Growth, Share, Opportunities & Competitive Analysis, 2024 – 2032

Report ID: 108750 | Report Format : Excel, PDF
REPORT ATTRIBUTE DETAILS
Historical Period 2020-2023
Base Year 2024
Forecast Period 2025-2032
Bio Vanillin Market Size 2024 USD 320.62 million
Bio Vanillin Market, CAGR 5.51%
Bio Vanillin Market Size 2032 USD 507.81 million

Market Overview

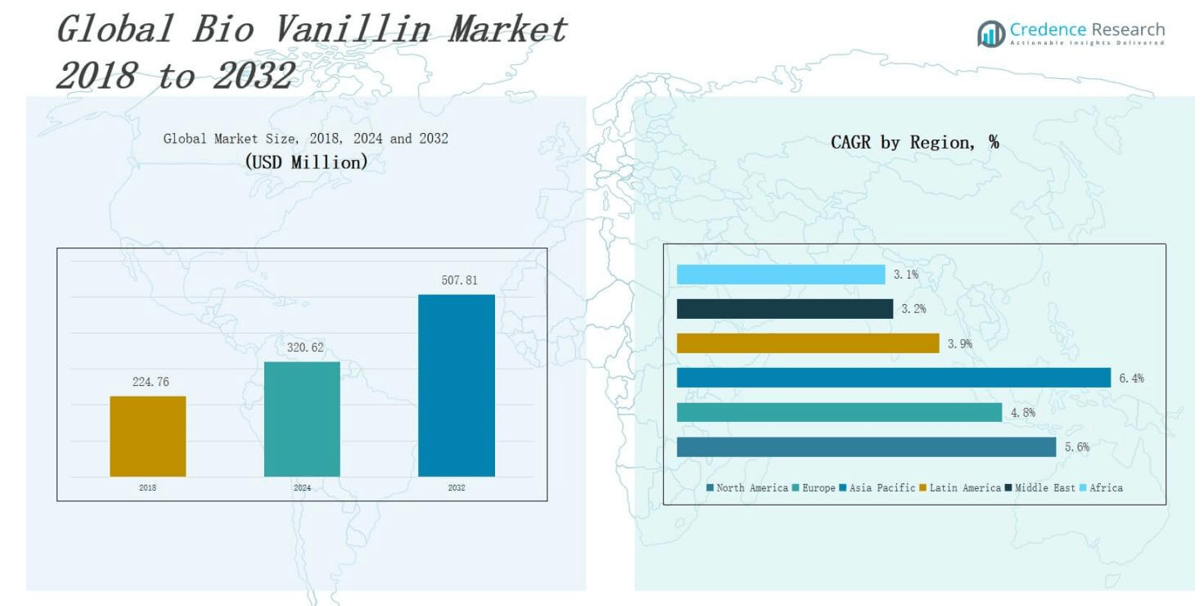
The Bio Vanillin Market size was valued at USD 224.76 million in 2018 to USD 320.62 million in 2024 and is anticipated to reach USD 507.81 million by 2032, at a CAGR of 5.51 % during the forecast period.

The Bio Vanillin market is driven by the growing demand for natural and sustainable flavoring agents across the food and beverage, cosmetics, and pharmaceutical industries. Consumers are increasingly prioritizing clean-label products, prompting manufacturers to replace synthetic additives with bio-based alternatives. Rising awareness of health and environmental concerns accelerates the shift toward bio vanillin derived through fermentation or enzymatic processes, offering reduced toxicity and a lower carbon footprint. Regulatory support for natural ingredients and restrictions on petrochemical-derived vanillin further encourage market adoption. Technological advancements in biosynthesis and microbial fermentation have enhanced production efficiency and purity levels, supporting scalability. Key players are investing in biotechnological innovations to meet rising demand and cost competitiveness. The trend toward premium and organic food products boosts the incorporation of bio vanillin in bakery, dairy, and confectionery applications. Additionally, expanding applications in personal care and aromatherapy highlight its multifunctional appeal, reinforcing its relevance in diverse consumer segments and global markets.

The Bio Vanillin Market exhibits diverse geographical growth, with Asia Pacific leading in volume share due to rising demand in China, India, and Southeast Asia. Europe dominates in revenue share, supported by strict regulatory standards and strong demand in Germany, France, and the UK. North America follows, driven by clean-label adoption across the U.S. and Canada. Latin America, particularly Brazil, shows moderate growth in food and fragrance applications. The Middle East and Africa represent emerging markets, with increasing uptake in the GCC countries, South Africa, and Egypt. Key players include Solvay SA, Givaudan SA, International Flavors & Fragrances Inc., Firmenich SA, Omega Ingredients, Advanced Biotech, Takasago International Corp, Borregaard ASA, Prinova Group, and Archer-Daniels Midland Co. These companies focus on biotechnological innovation, sustainability, and global distribution to expand their presence across these diverse regional markets.

Bio Vanillin Market size

Market Insights

  • The Bio Vanillin Market was valued at USD 224.76 million in 2018 and is projected to reach USD 507.81 million by 2032, growing at a CAGR of 5.51%.
  • Demand for natural and clean-label products is driving adoption across food, beverage, personal care, and pharmaceutical sectors.
  • Europe holds the largest revenue share at nearly 30%, led by Germany, France, and the UK with strong regulatory backing for natural ingredients.
  • Asia Pacific leads in volume share and shows the fastest growth, driven by rising demand in China, India, and Southeast Asia.
  • North America accounts for over 20% of global revenue, with major brands in the U.S. and Canada investing in fermentation technologies and clean-label innovation.
  • High production costs and limited raw material availability remain key challenges, affecting scalability and price competitiveness in mass-market applications.
  • Key players such as Solvay SA, Givaudan SA, IFF, Firmenich SA, and Borregaard ASA are expanding through biotechnological innovations and global distribution strategies.

Access crucial information at unmatched prices!

Request your sample report today & start making informed decisions powered by Credence Research Inc.!

Download Sample

Market Drivers

Rising Demand for Natural Ingredients in Food and Beverage

The Bio Vanillin Market is gaining traction due to the global shift toward natural and clean-label food products. Consumers increasingly reject synthetic additives, prompting manufacturers to replace artificial vanillin with bio-based alternatives. It appeals to health-conscious buyers seeking transparency in ingredient sourcing. Natural flavoring is no longer a niche preference but a mainstream expectation. Regulatory bodies in North America and Europe encourage natural ingredient use. This momentum drives strong adoption across bakery, dairy, and confectionery sectors.

  • For instance, Nestlé reformulated several of its chocolate and dairy products in Europe to use bio vanillin derived from natural sources, responding to consumer demand for clean-label ingredients and transparency in sourcing.

Supportive Regulatory Framework and Sustainability Goals

Stringent regulations against synthetic additives in several regions are accelerating the growth of the Bio Vanillin Market. Governments and food safety authorities are tightening restrictions on petrochemical-based flavorings. It benefits from this shift by aligning with eco-friendly sourcing and sustainable production. Environmental concerns are prompting industries to reduce carbon footprints, driving the preference for bio-based vanillin. Sustainability certifications give bio vanillin a competitive edge. Demand from ethically driven brands is rising steadily.

  • For instance, Symrise developed new biotechnological processes to produce vanillin from renewable resources, moving away from synthetic, petrochemical-based methods to meet regulatory and sustainability targets.

Advancements in Fermentation and Biotechnology

Innovations in microbial fermentation and biotechnological processes have enhanced the production efficiency of bio vanillin. The Bio Vanillin Market is evolving through continuous improvements in yield, purity, and scalability. It now offers a commercially viable alternative to synthetic vanillin with a lower environmental impact. Biotech companies are optimizing enzymatic pathways and fermentation strains to increase output. These advancements make bio vanillin more accessible and cost-effective. This progress is critical to expanding industrial applications and global supply chains.

Rising Use in Personal Care and Pharmaceutical Products

Beyond food, the Bio Vanillin Market benefits from increased demand in cosmetics and pharmaceuticals. Natural aroma compounds are widely used in perfumes, creams, and medicinal formulations. It offers a safer, hypoallergenic alternative to synthetic fragrance agents. Consumer awareness around ingredient safety supports this transition. Bio vanillin’s multifunctional nature expands its commercial viability. Its soothing properties and mild aroma are valued in personal care and wellness applications across developed markets.

 Market Trends

Expansion of Clean-Label and Organic Product Portfolios

The Bio Vanillin Market reflects a strong trend toward clean-label and organic product development. Consumers increasingly demand transparency in ingredients, driving food and beverage brands to use natural flavoring agents. It fits clean-label criteria and supports marketing claims tied to wellness and sustainability. Brands are launching organic-certified products that include bio vanillin as a key flavoring. The push for “free from” formulations is also encouraging broader adoption. Market positioning around purity and authenticity strengthens its appeal globally.

  • For instance, Borregaard produces bio-based vanillin from Norway spruce, certified by the Programme for the Endorsement of Forest Certification (PEFC), offering a product that is 100% renewable and provides a 90% reduction in CO₂ emissions compared to vanillin synthesized from crude oil.

Technological Innovation in Bioprocessing and Fermentation

Continuous innovation in biotechnological methods is shaping the Bio Vanillin Market. Fermentation processes using engineered microbes and lignin valorization are becoming more efficient. It is now produced at commercial scale with better yield and purity. Industry players are adopting enzyme-based methods that reduce by-products and waste. These advancements lower production costs while maintaining quality standards. The integration of precision fermentation is making bio vanillin a sustainable solution with consistent flavor performance.

  • For instance, Solvay expanded its bio vanillin portfolio in 2023 by introducing products like Rhovanil Natural Delica, derived from bioconversion of ferulic acid in rice bran, demonstrating enhanced sustainable sourcing and product diversification.

Rising Adoption in Fragrance and Cosmetic Formulations

Cosmetics and personal care brands are increasingly replacing synthetic fragrances with bio-derived ingredients. The Bio Vanillin Market is expanding into high-value segments such as perfumes, lotions, and skincare. It delivers a mild, pleasant aroma that aligns with growing demand for naturally sourced fragrance compounds. Natural beauty trends are accelerating this shift across Europe, North America, and parts of Asia. Premium and eco-conscious brands are leading the transition. Bio vanillin supports regulatory compliance in clean beauty markets.

Strategic Collaborations and Vertical Integration Efforts

Key players are forming strategic partnerships to scale production and ensure supply chain stability. The Bio Vanillin Market is witnessing increased vertical integration, where companies control fermentation inputs and downstream processing. It helps maintain quality control and reduce dependency on external suppliers. Joint ventures between flavor houses and biotech firms are enabling faster market access. These collaborations support large-scale commercialization and foster innovation. Expanding global distribution networks reflects growing commercial confidence in the segment.

Market Challenges Analysis

High Production Costs and Price Competitiveness

The Bio Vanillin Market faces significant cost-related challenges that hinder broader adoption. Bio-based vanillin production involves complex biotechnological processes that are more expensive than traditional synthetic routes. It requires specialized fermentation infrastructure and skilled expertise, increasing overall manufacturing costs. Price-sensitive industries, especially in developing markets, often prefer synthetic vanillin due to its affordability. The high cost differential limits penetration in mass-market food and beverage segments. Without cost parity, many manufacturers hesitate to transition to bio vanillin despite sustainability benefits.

Limited Raw Material Availability and Supply Chain Constraints

Raw material sourcing and process scalability remain key obstacles for the Bio Vanillin Market. It depends on specific biomass or feedstock, such as ferulic acid or lignin, which may not be available in consistent quality or quantity. It suffers from variability in agricultural supply chains, affecting output stability. Seasonal fluctuations and regional sourcing restrictions further constrain supply reliability. These issues complicate long-term procurement planning for large-scale manufacturers. Market growth depends on building resilient supply chains that can meet rising demand sustainably.

Market Opportunities

Expansion into Emerging Economies and New Applications

The Bio Vanillin Market holds strong growth potential across emerging economies in Asia-Pacific, Latin America, and the Middle East. Rising disposable income and increasing demand for premium, natural products are reshaping consumer preferences in these regions. It can capitalize on this shift by offering clean-label solutions in packaged foods, beverages, and cosmetics. Rapid urbanization and growing health awareness are expanding the base for natural flavorings. The market has an opportunity to enter pharmaceutical and nutraceutical applications, where natural excipients are gaining regulatory and commercial acceptance. Strategic localization of production facilities can improve accessibility and cost efficiency.

Growing Preference for Sustainable and Transparent Sourcing

Sustainability-driven procurement strategies across industries are creating new opportunities for the Bio Vanillin Market. Brands seek natural, traceable ingredients that align with ESG goals and consumer expectations. It supports carbon reduction targets and responsible sourcing initiatives. Certifications such as USDA Organic and Fairtrade enhance its appeal to environmentally conscious manufacturers. Opportunities also exist in formulating plant-based products, where synthetic additives are often rejected. Strong demand from vegan and cruelty-free product lines further expands its use across premium and niche categories.

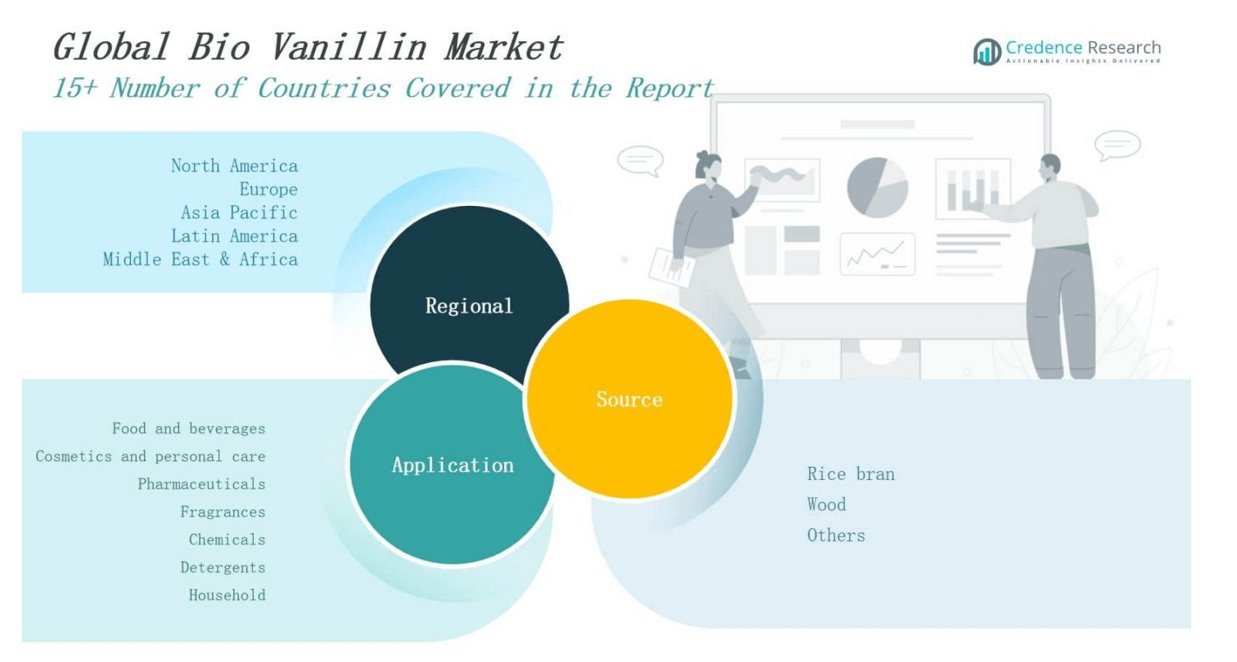
Market Segmentation Analysis:

By Source

The Bio Vanillin Market is segmented by source into rice bran, wood, and others. Rice bran remains a dominant feedstock due to its renewable availability and cost efficiency in extraction. It supports large-scale production through fermentation and enzymatic conversion. Wood-based vanillin appeals to manufacturers focused on lignin-derived compounds and sustainable forestry practices. The “others” category includes various biomass and agricultural residues, offering flexibility in sourcing strategies. It allows producers to diversify raw material supply and adapt to regional feedstock availability.

  • For instance, Borregaard is the only company globally producing vanillin from wood, specifically Norway spruce, through a process that uses spent sulfite liquor and is integrated within a biorefinery system.

By Application

The Bio Vanillin Market finds application across food and beverages, cosmetics and personal care, pharmaceuticals, fragrances, chemicals, detergents, and household products. Food and beverages lead in volume and revenue, driven by rising demand for natural flavoring in bakery, dairy, and confectionery. Cosmetics and personal care adopt bio vanillin for its mild scent and hypoallergenic profile. Pharmaceuticals use it in formulations where natural excipients are preferred. Fragrance and detergent manufacturers integrate it into eco-friendly product lines. It continues to expand in household applications, supported by clean-label and sustainability trends.

  • For instance, Nestlé uses bio vanillin in its chocolate and ice cream products to provide a natural vanilla flavor, responding to consumer demand for clean-label ingredients in confectionery and dairy items.

Bio Vanillin Market segmentation

Segments:

Based on Source

  • Rice Bran
  • Wood
  • Others

Based on Application

  • Food and Beverages
  • Cosmetics and Personal Care
  • Pharmaceuticals
  • Fragrances
  • Chemicals
  • Detergents
  • Household

Based on Region

  • North America
    • U.S.
    • Canada
    • Mexico
  • Europe
    • Germany
    • France
    • U.K.
    • Italy
    • Spain
    • Rest of Europe
  • Asia Pacific
    • China
    • Japan
    • India
    • South Korea
    • South-east Asia
    • Rest of Asia Pacific
  • Latin America
    • Brazil
    • Argentina
    • Rest of Latin America
  • Middle East & Africa
    • GCC Countries
    • South Africa
    • Rest of the Middle East and Africa

Regional Analysis

North America

The North America Bio Vanillin Market size was valued at USD 47.70 million in 2018 to USD 66.59 million in 2024 and is anticipated to reach USD 106.08 million by 2032, at a CAGR of 5.6% during the forecast period. North America holds a significant market share due to strong demand for clean-label food and natural flavoring agents. It benefits from well-established food processing, cosmetics, and pharmaceutical sectors that actively adopt bio-based ingredients. Major manufacturers in the U.S. and Canada prioritize sustainable sourcing and invest in fermentation technologies. Regulatory support for natural additives reinforces market penetration. It continues to expand in personal care and nutraceutical applications, especially among premium product lines. The region contributes over 20% to global revenue share.

Europe

The Europe Bio Vanillin Market size was valued at USD 69.95 million in 2018 to USD 96.51 million in 2024 and is anticipated to reach USD 144.73 million by 2032, at a CAGR of 4.8% during the forecast period. Europe commands the largest market share globally, accounting for nearly 30% of the total revenue. Strong consumer preference for natural, organic, and ethically sourced ingredients drives demand. Strict EU regulations discourage synthetic additives and support the adoption of bio vanillin across food, fragrance, and pharmaceutical industries. It benefits from advanced bioprocessing infrastructure and a well-regulated sourcing ecosystem. Germany, France, and the UK remain key consumption centers for bio-based flavorings.

Asia Pacific

The Asia Pacific Bio Vanillin Market size was valued at USD 86.36 million in 2018 to USD 128.37 million in 2024 and is anticipated to reach USD 217.35 million by 2032, at a CAGR of 6.4% during the forecast period. Asia Pacific holds the fastest growth rate and over 35% of the global volume share. Rising disposable income and demand for premium, clean-label food products fuel regional expansion. It benefits from abundant biomass availability and a growing bioprocessing ecosystem in China, India, and Southeast Asia. Local producers are scaling fermentation capacity to meet domestic and export needs. Bio vanillin adoption in personal care and household sectors is accelerating, supported by regional brand development and retail penetration.

Latin America

The Latin America Bio Vanillin Market size was valued at USD 10.39 million in 2018 to USD 14.64 million in 2024 and is anticipated to reach USD 20.46 million by 2032, at a CAGR of 3.9% during the forecast period. Latin America holds a modest share of the Bio Vanillin Market, contributing approximately 5% to global revenue. Brazil leads regional consumption, driven by growing demand in food and beverage applications. Local manufacturers seek alternatives to synthetic additives to comply with international export standards. It faces challenges in production scalability but benefits from regional agricultural biomass. Expanding cosmetic and fragrance industries create new application areas. Regional distribution partnerships support broader market reach.

Middle East

The Middle East Bio Vanillin Market size was valued at USD 6.10 million in 2018 to USD 7.92 million in 2024 and is anticipated to reach USD 10.52 million by 2032, at a CAGR of 3.2% during the forecast period. The Middle East contributes less than 3% of global market share but shows steady growth in food, fragrance, and hospitality sectors. Consumer awareness around natural products is gradually increasing in GCC countries. It sees demand from high-end personal care and food service brands promoting clean-label positioning. Regional importers play a key role in supplying bio vanillin to premium product lines. Limited local production creates reliance on global suppliers. Dubai and Saudi Arabia serve as major consumption hubs.

Africa

The Africa Bio Vanillin Market size was valued at USD 4.26 million in 2018 to USD 6.59 million in 2024 and is anticipated to reach USD 8.68 million by 2032, at a CAGR of 3.1% during the forecast period. Africa remains a nascent market, holding less than 2% of global volume share. It shows early-stage demand primarily in South Africa and Egypt. Growth is driven by rising urbanization, expanding packaged food consumption, and awareness of natural product benefits. It relies heavily on imports due to limited local production capacity. Challenges include pricing constraints and lack of infrastructure for biosynthesis. Government programs encouraging sustainable agriculture could improve long-term sourcing potential.

Shape Your Report to Specific Countries or Regions & Enjoy 30% Off!

Key Player Analysis

  • International Flavors & Fragrances Inc.
  • Solvay SA
  • Advanced Biotech
  • Givaudan SA
  • Omega Ingredients
  • Takasago International Corp
  • Borregaard ASA
  • Prinova Group
  • Archer-Daniels Midland Co. (ADM)
  • Firmenich SA

Competitive Analysis

The Bio Vanillin Market features a competitive landscape driven by innovation, sustainable sourcing, and strategic partnerships. Leading players such as Solvay SA, Givaudan SA, International Flavors & Fragrances Inc., and Firmenich SA dominate through advanced fermentation technologies and global distribution networks. It is characterized by continuous investment in bioprocess development to improve yield, purity, and cost-efficiency. Companies compete by expanding their natural ingredient portfolios and aligning with clean-label trends. Smaller firms like Omega Ingredients and Advanced Biotech target niche applications and regional markets with customized solutions. Strategic collaborations between biotech firms and flavor houses are enhancing scalability and product quality. It also sees competition from synthetic vanillin producers, pressuring bio-based suppliers to match price points without compromising sustainability. Market players focus on certifications, traceability, and ESG compliance to gain preference among environmentally conscious customers. The competition continues to intensify as demand grows across food, personal care, and pharmaceutical industries.

Recent Developments

  • In 2023, Lallemand completed its acquisition of Swiss biotech firm Evolva, which specializes in yeast-based fermentation technology for natural aroma ingredients. Lallemand now uses this capability to produce high‑purity (98%) vanillin from sugar sources.
  • In June 2023, Borregaard ASA signed a large-scale supply agreement with a global food manufacturer to provide bio vanillin, strengthening its position in the natural flavor ingredients market.
  • In January 2023, Solvay launched the first mass-balanced, ISCC PLUS-certified Rhovanil® natural vanillin, aligning with environmental and traceability standards.
  • In January 2024, Danstar Ferment AG (a Lallemand affiliate) finalized the acquisition of Evolva AG, strengthening its fermentation capabilities for high-purity bio vanillin production.

Market Concentration & Characteristics

The Bio Vanillin Market is moderately concentrated, with a few major players accounting for a significant share of global production and supply. It is shaped by companies such as Solvay SA, Givaudan SA, International Flavors & Fragrances Inc., and Firmenich SA, which lead in technological capabilities and biotechnological innovation. These firms control critical fermentation and biosynthesis processes, securing strong positions in both developed and emerging markets. It exhibits high barriers to entry due to the need for advanced infrastructure, regulatory compliance, and proprietary microbial strains. Smaller companies compete by offering region-specific solutions or targeting niche applications. The market emphasizes sustainability, product purity, and traceability, characteristics that influence buyer preferences across food, personal care, and pharmaceutical sectors. Pricing remains sensitive, particularly in developing regions, but demand for clean-label ingredients sustains competitive activity. It evolves through continuous R&D and strategic partnerships, which shape its long-term trajectory and innovation potential.

Report Coverage

The research report offers an in-depth analysis based on Source, Application and Region. It details leading market players, providing an overview of their business, product offerings, investments, revenue streams, and key applications. Additionally, the report includes insights into the competitive environment, SWOT analysis, current market trends, as well as the primary drivers and constraints. Furthermore, it discusses various factors that have driven market expansion in recent years. The report also explores market dynamics, regulatory scenarios, and technological advancements that are shaping the industry. It assesses the impact of external factors and global economic changes on market growth. Lastly, it provides strategic recommendations for new entrants and established companies to navigate the complexities of the market.

Future Outlook

  1. Demand for bio vanillin will continue rising as clean-label and natural ingredients gain wider consumer acceptance.
  2. Food and beverage manufacturers will increasingly replace synthetic vanillin with bio-based alternatives to meet regulatory and consumer expectations.
  3. Technological advancements in microbial fermentation and enzymatic synthesis will improve production efficiency and scalability.
  4. Key players will expand production capacity to meet growing demand across global markets.
  5. Asia Pacific will maintain its position as the fastest-growing region due to industrial expansion and changing dietary preferences.
  6. Europe will retain a stronghold in premium product segments driven by regulatory compliance and sustainability goals.
  7. Applications in cosmetics and personal care will grow, fueled by the shift toward hypoallergenic and natural fragrance formulations.
  8. Price competitiveness will improve as fermentation technologies become more cost-effective and widely adopted.
  9. Strategic partnerships between biotech firms and flavor houses will shape future market development.
  10. Supply chain optimization and raw material security will remain key priorities for long-term market growth.

CHAPTER NO. 1 : GENESIS OF THE MARKET        

1.1 Market Prelude – Introduction & Scope

1.2 The Big Picture – Objectives & Vision

1.3 Strategic Edge – Unique Value Proposition

1.4 Stakeholder Compass – Key Beneficiaries

CHAPTER NO. 2 : EXECUTIVE LENS

2.1 Pulse of the Industry – Market Snapshot

2.2 Growth Arc – Revenue Projections (USD Million)

2.3. Premium Insights – Based on Primary Interviews

CHAPTER NO. 3 : BIO VANILLIN MARKET FORCES & INDUSTRY PULSE     

3.1 Foundations of Change – Market Overview
3.2 Catalysts of Expansion – Key Market Drivers
3.2.1 Momentum Boosters – Growth Triggers
3.2.2 Innovation Fuel – Disruptive Technologies
3.3 Headwinds & Crosswinds – Market Restraints
3.3.1 Regulatory Tides – Compliance Challenges
3.3.2 Economic Frictions – Inflationary Pressures
3.4 Untapped Horizons – Growth Potential & Opportunities
3.5 Strategic Navigation – Industry Frameworks
3.5.1 Market Equilibrium – Porter’s Five Forces
3.5.2 Ecosystem Dynamics – Value Chain Analysis
3.5.3 Macro Forces – PESTEL Breakdown

3.6 Price Trend Analysis

    3.6.1 Regional Price Trend
3.6.2 Price Trend by product

CHAPTER NO. 4 : KEY INVESTMENT EPICENTER 

4.1 Regional Goldmines – High-Growth Geographies

4.2 Product Frontiers – Lucrative Product Categories

4.3 Application Sweet Spots – Emerging Demand Segments

CHAPTER NO. 5: REVENUE TRAJECTORY & WEALTH MAPPING

5.1 Momentum Metrics – Forecast & Growth Curves

5.2 Regional Revenue Footprint – Market Share Insights

5.3 Segmental Wealth Flow – Source & Application Revenue

CHAPTER NO. 6 : TRADE & COMMERCE ANALYSIS           

6.1.        Import Analysis by Region

6.1.1.     Global Bio Vanillin Market Import Volume By Region

6.2.        Export Analysis by Region

6.2.1.     Global Bio Vanillin Market Export Volume By Region

CHAPTER NO. 7 : COMPETITION ANALYSIS          

7.1.        Company Market Share Analysis

7.1.1.     Global Bio Vanillin Market: Company Market Share

7.1.        Global Bio Vanillin Market Company Volume Market Share

7.2.        Global Bio Vanillin Market Company Revenue Market Share

7.3.        Strategic Developments

7.3.1.     Acquisitions & Mergers

7.3.2.     New Product Launch

7.3.3.     Regional Expansion

7.4.        Competitive Dashboard

7.5.    Company Assessment Metrics, 2024

CHAPTER NO. 8 : BIO VANILLIN MARKET – BY SOURCE SEGMENT ANALYSIS        

8.1.        Bio Vanillin Market Overview by Source Segment

8.1.1.     Bio Vanillin Market Volume Share By Source

8.1.2.     Bio Vanillin Market Revenue Share By Source

8.2.        Rice bran

8.3.        Wood

8.4.        Others

CHAPTER NO. 9 : BIO VANILLIN MARKET – BY APPLICATION SEGMENT ANALYSIS             

9.1.        Bio Vanillin Market Overview by Application Segment

9.1.1.     Bio Vanillin Market Volume Share By Application

9.1.2.     Bio Vanillin Market Revenue Share By Application

9.2.        Food and beverages

9.3.        Cosmetics and personal care

9.4.        Pharmaceuticals

9.5.        Fragrances

9.6.        Chemicals

9.7.        Detergents

9.8.        Household

CHAPTER NO. 10 : BIO VANILLIN MARKET – REGIONAL ANALYSIS            

10.1.      Bio Vanillin Market Overview by Region Segment

10.1.1.  Global Bio Vanillin Market Volume Share By Region

10.1.2.  Global Bio Vanillin Market Revenue Share By Region

10.1.3.  Regions

10.1.4.  Global Bio Vanillin Market Volume By Region

10.1.5.  Global Bio Vanillin Market Revenue By Region

10.1.6.  Source

10.1.7.  Global Bio Vanillin Market Volume By Source

10.1.8.  Global Bio Vanillin Market Revenue By Source

10.1.9.  Application

10.1.10. Global Bio Vanillin Market Volume By Application

10.1.11. Global Bio Vanillin Market Revenue By Application

CHAPTER NO. 11 : NORTH AMERICA BIO VANILLIN MARKET – COUNTRY ANALYSIS         

11.1.      North America Bio Vanillin Market Overview by Country Segment

11.1.1.  North America Bio Vanillin Market Volume Share By Region

11.1.2.  North America Bio Vanillin Market Revenue Share By Region

11.2.      North America

11.2.1.  North America Bio Vanillin Market Volume By Country

11.2.2.  North America Bio Vanillin Market Revenue By Country

11.2.3.  Source

11.2.4.  North America Bio Vanillin Market Volume By Source

11.2.5.  North America Bio Vanillin Market Revenue By Source

11.2.6.  Application

11.2.7.  North America Bio Vanillin Market Volume By Application

11.2.8.  North America Bio Vanillin Market Revenue By Application

11.3.      U.S.

11.4.      Canada

11.5.      Mexico

CHAPTER NO. 12 : EUROPE BIO VANILLIN MARKET – COUNTRY ANALYSIS            

12.1.      Europe Bio Vanillin Market Overview by Country Segment

12.1.1.  Europe Bio Vanillin Market Volume Share By Region

12.1.2.  Europe Bio Vanillin Market Revenue Share By Region

12.2.      Europe

12.2.1.  Europe Bio Vanillin Market Volume By Country

12.2.2.  Europe Bio Vanillin Market Revenue By Country

12.2.3.  Source

12.2.4.  Europe Bio Vanillin Market Volume By Source

12.2.5.  Europe Bio Vanillin Market Revenue By Source

12.2.6.  Application

12.2.7.  Europe Bio Vanillin Market Volume By Application

12.2.8.  Europe Bio Vanillin Market Revenue By Application

12.3.      UK

12.4.      France

12.5.      Germany

12.6.      Italy

12.7.      Spain

12.8.      Russia

12.9.   Rest of Europe

CHAPTER NO. 13 : ASIA PACIFIC BIO VANILLIN MARKET – COUNTRY ANALYSIS   

13.1.      Asia Pacific Bio Vanillin Market Overview by Country Segment

13.1.1.  Asia Pacific Bio Vanillin Market Volume Share By Region

13.1.2.  Asia Pacific Bio Vanillin Market Revenue Share By Region

13.2.      Asia Pacific

13.2.1.  Asia Pacific Bio Vanillin Market Volume By Country

13.2.2.  Asia Pacific Bio Vanillin Market Revenue By Country

13.2.3.  Source

13.2.4.  Asia Pacific Bio Vanillin Market Volume By Source

13.2.5.  Asia Pacific Bio Vanillin Market Revenue By Source

13.2.6.  Application

13.2.7.  Asia Pacific Bio Vanillin Market Volume By Application

13.2.8.  Asia Pacific Bio Vanillin Market Revenue By Application

13.3.      China

13.4.      Japan

13.5.      South Korea

13.6.      India

13.7.      Australia

13.8.      Southeast Asia

13.9.      Rest of Asia Pacific

CHAPTER NO. 14 : LATIN AMERICA BIO VANILLIN MARKET – COUNTRY ANALYSIS

14.1.      Latin America Bio Vanillin Market Overview by Country Segment

14.1.1.  Latin America Bio Vanillin Market Volume Share By Region

14.1.2.  Latin America Bio Vanillin Market Revenue Share By Region

14.2.      Latin America

14.2.1.  Latin America Bio Vanillin Market Volume By Country

14.2.2.  Latin America Bio Vanillin Market Revenue By Country

14.2.3.  Source

14.2.4.  Latin America Bio Vanillin Market Volume By Source

14.2.5.  Latin America Bio Vanillin Market Revenue By Source

14.2.6.  Application

14.2.7.  Latin America Bio Vanillin Market Volume By Application

14.2.8.  Latin America Bio Vanillin Market Revenue By Application

14.3.      Brazil

14.4.      Argentina

14.5.      Rest of Latin America

CHAPTER NO. 15 : MIDDLE EAST BIO VANILLIN MARKET – COUNTRY ANALYSIS

15.1.      Middle East Bio Vanillin Market Overview by Country Segment

15.1.1.  Middle East Bio Vanillin Market Volume Share By Region

15.1.2.  Middle East Bio Vanillin Market Revenue Share By Region

15.2.      Middle East

15.2.1.  Middle East Bio Vanillin Market Volume By Country

15.2.2.  Middle East Bio Vanillin Market Revenue By Country

15.2.3.  Source

15.2.4.  Middle East Bio Vanillin Market Volume By Source

15.2.5.  Middle East Bio Vanillin Market Revenue By Source

15.2.6.  Application

15.2.7.  Middle East Bio Vanillin Market Volume By Application

15.2.8.  Middle East Bio Vanillin Market Revenue By Application

15.3.      GCC Countries

15.4.      Israel

15.5.      Turkey

15.6.      Rest of Middle East

CHAPTER NO. 16 : AFRICA BIO VANILLIN MARKET – COUNTRY ANALYSIS             

16.1.      Africa Bio Vanillin Market Overview by Country Segment

16.1.1.  Africa Bio Vanillin Market Volume Share By Region

16.1.2.  Africa Bio Vanillin Market Revenue Share By Region

16.2.      Africa

16.2.1.  Africa Bio Vanillin Market Volume By Country

16.2.2.  Africa Bio Vanillin Market Revenue By Country

16.2.3.  Source

16.2.4.  Africa Bio Vanillin Market Volume By Source

16.2.5.  Africa Bio Vanillin Market Revenue By Source

16.2.6.  Application

16.2.7.  Africa Bio Vanillin Market Volume By Application

16.2.8.  Africa Bio Vanillin Market Revenue By Application

16.3.      South Africa

16.4.      Egypt

16.5.      Rest of Africa

CHAPTER NO. 17 : COMPANY PROFILES

17.1.      International Flavors & Fragrances Inc.

17.1.1.  Company Overview

17.1.2.  Product Portfolio

17.1.3.  Financial Overview

17.1.4.  Recent Developments

17.1.5.  Growth Strategy

17.1.6.  SWOT Analysis

17.2.      Solvay SA

17.3.      Advanced Biotech

17.4.      Givaudan SA

17.5.      Omega Ingredients

17.6.      Takasago International Corp

17.7.      Borregaard ASA

17.8.      Prinova Group

17.9.      Archer-Daniels Midland Co

17.10.    Firmenich SA

Request Free Sample

Ready to Transform Data into Decisions?

Request Your Sample Report and Start Your Journey of Informed Choices


Providing the strategic compass for industry titans.

cr-clients-logos

Frequently Asked Questions

What is the current size of the Bio Vanillin Market?

The Bio Vanillin Market was valued at USD 320.62 million in 2024 and is projected to reach USD 507.81 million by 2032, reflecting steady growth driven by rising demand for natural flavoring agents.

What factors are driving the growth of the Bio Vanillin Market?

Key growth drivers include rising consumer preference for clean-label and sustainable products, regulatory restrictions on synthetic additives, and advancements in fermentation and biotechnological processes.

What are the key segments within the Bio Vanillin Market?

The market is segmented by source—rice bran, wood, and others—and by application, including food and beverages, cosmetics and personal care, pharmaceuticals, fragrances, chemicals, detergents, and household products.

Who are the major players in the Bio Vanillin Market?

Key players include Solvay SA, Givaudan SA, International Flavors & Fragrances Inc., Firmenich SA, Borregaard ASA, Advanced Biotech, Omega Ingredients, and Takasago International Corp.

About Author

Rajdeep Kumar Deb

Rajdeep Kumar Deb

Lead Analyst – Consumer & Finance

Rajdeep brings a decade of consumer goods and financial services insight to strategic market analysis.

View Profile

Related Reports

Second-Hand Fashion Market

The Second-Hand Fashion Market was valued at USD 190 billion in 2024 and is projected to reach USD 422.3 billion by 2032, expanding at a CAGR of 10.5% during the forecast period.

Passenger Tire Market

The Passenger Tire Market was valued at USD 156.1 billion in 2024 and is projected to reach USD 210.3 billion by 2032, expanding at a CAGR of 3.8% during the forecast period.

Passenger Vehicles Market

The Passenger Vehicles Market was valued at USD 1705.2 billion in 2024 and is anticipated to reach USD 2805.1 billion by 2032, growing at a CAGR of 6.42% during the forecast period.

Operator Training Simulator Market

Operator Training Simulator Market size was valued at USD 12.4 billion in 2024 and is anticipated to reach USD 35.7 billion by 2032, at a CAGR of 14.1% during the forecast period.

UK Anesthesia Breathing Filters Market

The UK Anesthesia Breathing Filters Market size was valued at USD 3.75 million in 2018 to USD 4.68 million in 2024 and is anticipated to reach USD 6.35 million by 2032, at a CAGR of 3.60% during the forecast period.

Secure Logistics Market

Secure Logistics Market size was valued at USD 88 billion in 2024 and is anticipated to reach USD 136.2 billion by 2032, at a CAGR of 5.62% during the forecast period.

Zeolite Molecular Sieve Market

The Zeolite Molecular Sieve Market size was valued at USD 4609.8 million in 2024 and is anticipated to reach USD 7744.6 million by 2032, at a CAGR of 6.7% during the forecast period (2024-2032).

Non-Alcoholic Beer Market

The Non-Alcoholic Beer Market size was valued at USD 19 million in 2024 and is projected to reach USD 34.4 million by 2032, expanding at a CAGR of 7.7% during the forecast period.

Non-Alcoholic RTD Beverages Market

The Non-Alcoholic RTD Beverages Market was valued at USD 760.6 million in 2024 and is anticipated to reach USD 1178 million by 2032, growing at a CAGR of 5.62% during the forecast period.

Purchase Options

The report comes as a view-only PDF document, optimized for individual clients. This version is recommended for personal digital use and does not allow printing. Use restricted to one purchaser only.
$4999

To meet the needs of modern corporate teams, our report comes in two formats: a printable PDF and a data-rich Excel sheet. This package is optimized for internal analysis. Unlimited users allowed within one corporate location (e.g., regional office).
$6999

The report will be delivered in printable PDF format along with the report’s data Excel sheet. This license offers 100 Free Analyst hours where the client can utilize Credence Research Inc. research team. Permitted for unlimited global use by all users within the purchasing corporation, such as all employees of a single company.
$12999

Credence Staff 3

WILLIAM, North America

Support Staff at Credence Research

KEITH PHILLIPS, Europe

Lee - CR Sales Staff

LEE VALLANCE, Asia Pacific

Kieran Jameson

KIERAN JAMESON, Australia

Report delivery within 24 to 48 hours

User Review

Thank you for the data! The numbers are exactly what we asked for and what we need to build our business case.

Materials Scientist
(privacy requested)

User Review

The report was an excellent overview of the Industrial Burners market. This report does a great job of breaking everything down into manageable chunks.

Imre Hof
Management Assistant, Bekaert

cr-clients-logos

Request Sample