Home » Information and Communications Technology » Technology & Media » Business Broker Service Market

Business Broker Service Market By Service Type (Buy-Side Services, Sell-Side Services, Valuation Services, Mergers and Acquisitions Advisory, Business Transfer Services); By End User Industry (Healthcare, Manufacturing, Retail, Technology, Services, Others) – Growth, Share, Opportunities & Competitive Analysis, 2024 – 2032

Report ID: 110081 | Report Format : Excel, PDF
REPORT ATTRIBUTE DETAILS
Historical Period 2020-2023
Base Year 2024
Forecast Period 2025-2032
Business Broker Service Market Size 2024 USD 5,286.78 million
Business Broker Service Market , CAGR 5.29%
Business Broker Service Market Size 2032 USD 8,227.26 million

Market Overview

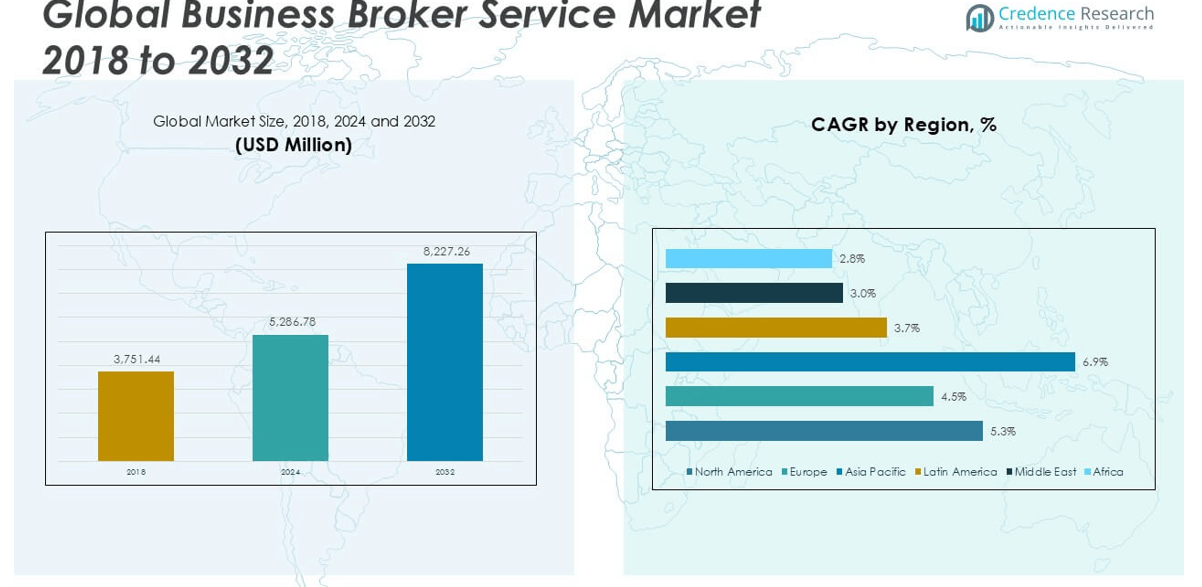
The Business Broker Service market size was valued at USD 3,751.44 million in 2018 and grew to USD 5,286.78 million in 2024. It is anticipated to reach USD 8,227.26 million by 2032, registering a CAGR of 5.29% during the forecast period.

The Business Broker Service market is led by key players such as Sunbelt Business Brokers, Transworld Business Advisors, Morgan & Westfield, Woodbridge International, FE International, and Empire Flippers. These companies maintain strong positions through extensive networks, industry-specific expertise, and comprehensive service offerings, including M&A advisory, valuation, and transaction support. Emerging digital-focused firms like Flippa and Website Closers are rapidly gaining market share by serving online and tech-driven businesses. North America dominates the global market with a 41.7% share in 2024, driven by mature financial infrastructure, high M&A activity, and widespread adoption of professional brokerage services. Europe and Asia Pacific follow as significant markets, with growing SME activity and increased cross-border transactions supporting regional growth.

Business Broker Service Market size

Market Insights

  • The Business Broker Service market was valued at USD 5,286.78 million in 2024 and is projected to reach USD 8,227.26 million by 2032, growing at a CAGR of 5.29% during the forecast period.
  • Rising mergers and acquisitions activity and the expanding SME sector are major drivers boosting demand for buy-side and sell-side services, especially in healthcare, retail, and technology industries.
  • Digital transformation, including virtual deal rooms and automated valuation tools, is reshaping brokerage operations and creating new opportunities for firms focused on online and tech-based businesses.
  • The market is competitive with major players like Sunbelt Business Brokers, Transworld Business Advisors, and Empire Flippers offering specialized services, while emerging platforms like Flippa and Website Closers focus on digital assets.
  • North America leads with a 41.7% market share in 2024, followed by Europe and Asia Pacific; by service type, Sell-Side Services dominate due to increased demand for professional assistance in business exits.]\

Access crucial information at unmatched prices!

Request your sample report today & start making informed decisions powered by Credence Research Inc.!

Download Sample

Market Segmentation Analysis:

By Service Type:

The Business Broker Service market segmented by service type includes Buy-Side Services, Sell-Side Services, Valuation Services, Mergers and Acquisitions Advisory, and Business Transfer Services. Among these, Sell-Side Services dominate the market with the largest share, driven by increased demand from business owners seeking professional support to sell enterprises efficiently. Valuation Services also hold significant importance, fueled by the need for accurate business appraisals during transactions and regulatory compliance. The growth in mergers and acquisitions advisory reflects rising corporate consolidation trends, while buy-side and transfer services gain traction as businesses seek strategic acquisitions and smooth ownership transitions.

  • For instance, in 2023, Transworld Business Advisors facilitated 1,602 sell-side transactions across its U.S. network, showcasing its extensive operational scale in this segment.

By End user industry:

Healthcare leads the Business Broker Service market, supported by rising healthcare company transactions and consolidation to enhance service delivery. The Manufacturing sector follows closely, propelled by restructuring and expansion initiatives requiring brokerage expertise. Retail and Technology industries also contribute substantially due to evolving market dynamics and digital transformations demanding specialized advisory. The Services sector and Others segment, encompassing diverse industries, steadily increase their reliance on business broker services to manage ownership changes and strategic growth, supported by favorable economic conditions and regulatory frameworks.

  • For instance, Woodbridge International successfully completed 16 sell-side healthcare transactions between 2021 and 2023, including the sale of a multi-site behavioral health provider to a private equity firm in a deal valued at USD 94 million.

Market Oveiew

Increasing Mergers and Acquisitions Activity

The rise in mergers and acquisitions across industries significantly drives demand for business broker services. Companies seek expert advisory to navigate complex transactions, identify suitable targets, and negotiate deals. This activity fuels the need for buy-side and sell-side brokerage support, valuation accuracy, and M&A advisory services. The growing trend of consolidation, especially in healthcare, technology, and manufacturing, further accelerates the market as businesses pursue strategic growth and competitive advantage through acquisitions.

  • For instance, Sunbelt Business Brokers reported handling over 4,000 business sales globally in 2022, a substantial number driven by cross-industry acquisition demands.

Expansion of Small and Medium Enterprises (SMEs)

The expanding SME sector contributes prominently to the business broker service market growth. Many SMEs require professional assistance to manage ownership transfers, business sales, and acquisitions. Business brokers play a crucial role in helping these enterprises value assets, find potential buyers, and ensure smooth transaction processes. The increase in entrepreneurship and startup activities worldwide sustains this demand, pushing brokers to provide tailored solutions for emerging and growing businesses.

  • For instance, Empire Flippers reported facilitating USD 132 million in online business sales for SMEs in 2023, with more than 500 successful transactions that year alone.

Rising Need for Accurate Business Valuation and Advisory

Regulatory complexities and investor scrutiny have heightened the importance of precise business valuations and expert advisory services. Accurate valuation helps stakeholders make informed decisions and comply with legal and financial requirements. This demand boosts the valuation and M&A advisory segments within the business broker market. Enhanced transparency and due diligence requirements drive companies to rely on professional brokers, supporting sustained growth and trust in brokerage services.

Key Trends & Opportunities

Digital Transformation in Brokerage Services

The adoption of digital tools and platforms in business brokerage is reshaping the market. Brokers increasingly leverage technology for virtual meetings, digital marketing, and streamlined transaction management. This transformation enhances efficiency, widens client reach, and reduces operational costs. It also opens opportunities for data-driven decision-making and improved client experience, enabling brokers to serve a broader range of businesses, especially technology-savvy SMEs.

  • For instance, Flippa uses AI-driven algorithms to assess over 10,000 digital businesses monthly and has a user base of more than 600,000 buyers and sellers globally as of 2024.

Growing Focus on Specialized Industry Segments

Business brokers are increasingly specializing in niche industries such as healthcare, technology, and manufacturing. This focus allows brokers to offer deeper market insights and tailored advisory services, improving transaction outcomes. Specialization presents an opportunity to capture high-value deals and build strong client relationships in sectors undergoing rapid change and consolidation.

  • For instance, FE International completed over 1,200 acquisitions in the technology and SaaS segments alone, with transactions valued from USD 100,000 up to USD 30 million.

Expansion into Emerging Markets

Emerging economies show increasing entrepreneurial activity and market liberalization, creating new demand for brokerage services. Expansion into these regions offers brokers growth opportunities by addressing unmet advisory needs and facilitating cross-border transactions. Growing foreign investments and privatization initiatives further propel market potential in developing countries.

Key Challenges

Market Fragmentation and Competition

The business broker service market faces fragmentation with numerous small and regional players competing. This competition limits pricing power and requires brokers to differentiate through service quality and specialization. Fragmentation also challenges brokers in scaling operations and accessing larger deals, impacting market consolidation prospects.

Regulatory and Compliance Complexities

Navigating diverse regulatory environments poses significant challenges for business brokers, especially in cross-border transactions. Compliance with tax laws, licensing, and disclosure requirements demands thorough expertise and resources. Increasing regulatory scrutiny can delay transactions and raise operational costs, affecting market growth.

Economic Uncertainty and Market Volatility

Economic fluctuations and market volatility influence business sale and acquisition decisions, causing uncertainty in brokerage demand. Periods of economic slowdown or financial instability reduce transaction volumes, impacting revenue streams for brokers. Managing client expectations and adapting to changing market conditions remain ongoing challenges for sustained business growth.

Regional Analysis

North America

North America holds the largest share of the Business Broker Service market, valued at USD 1,580.23 million in 2018. The region’s market size grew to USD 2,202.99 million in 2024 and is expected to reach USD 3,438.16 million by 2032, reflecting a CAGR of 5.3%. Its dominant market share is driven by mature economies, high M&A activity, and advanced financial services infrastructure. The growing demand for specialized brokerage services across healthcare, technology, and manufacturing sectors further supports sustained regional growth throughout the forecast period.

Europe

Europe accounted for a significant portion of the Business Broker Service market with a 2018 valuation of USD 1,074.21 million. The market expanded to USD 1,459.77 million in 2024 and is projected to reach USD 2,140.06 million by 2032 at a CAGR of 4.5%. The region’s market share is underpinned by steady corporate restructuring, stringent regulatory requirements, and increased cross-border transactions. Growth in key sectors such as manufacturing and services further boosts demand for expert brokerage and valuation services, sustaining Europe’s strong market presence.

Asia Pacific

Asia Pacific displays the highest CAGR of 6.9% in the Business Broker Service market, growing from USD 744.47 million in 2018 to USD 1,134.46 million in 2024. It is forecasted to reach USD 1,992.85 million by 2032. This rapid growth reflects expanding SMEs, increasing entrepreneurial ventures, and rising M&A activities, especially in China, India, and Southeast Asia. The region’s growing market share is driven by digital adoption and evolving regulatory frameworks, making it a key emerging hub for business brokerage services.

Latin America

Latin America’s Business Broker Service market was valued at USD 180.95 million in 2018 and increased to USD 251.90 million by 2024. It is expected to reach USD 347.90 million by 2032 with a CAGR of 3.7%. The region holds a modest market share, influenced by gradual economic growth and increasing privatization efforts. However, political and economic volatility pose challenges. Demand for brokerage services in sectors like manufacturing and retail is rising, offering steady growth opportunities in this emerging market.

Middle East

The Middle East’s Business Broker Service market stood at USD 102.15 million in 2018, growing to USD 131.24 million in 2024, with an anticipated value of USD 171.32 million by 2032. It registers a CAGR of 3.0%. The region holds a smaller market share due to fluctuating oil prices and geopolitical instability. Nevertheless, diversification efforts, infrastructure investments, and increasing business transfers in services and technology sectors support gradual market expansion during the forecast period.

Africa

Africa recorded the smallest market size of USD 69.43 million in 2018, increasing to USD 106.41 million in 2024. The market is projected to reach USD 136.97 million by 2032 at a CAGR of 2.8%. Despite holding a minimal market share, growing entrepreneurial activities and privatization trends drive demand for business broker services. Limited financial infrastructure and regulatory challenges slow growth, but increasing foreign investments and economic reforms create emerging opportunities within the region.

Business Broker Service Market segmentation

Market Segmentations:

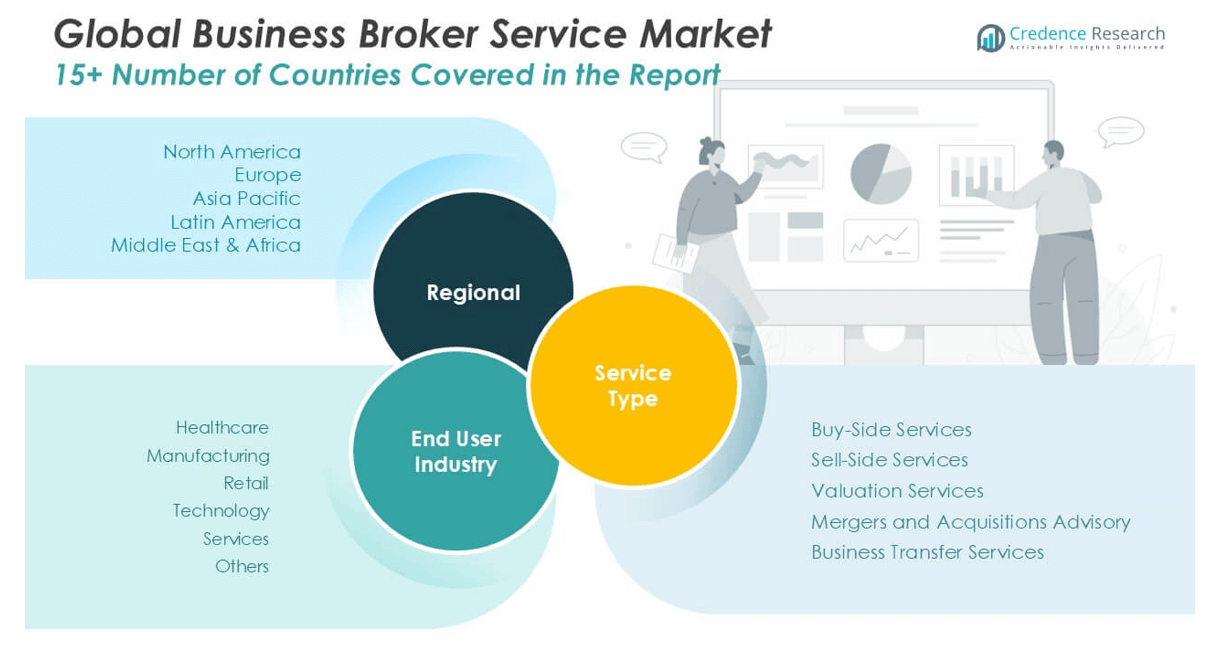
By Service Type

  • Buy-Side Services
  • Sell-Side Services
  • Valuation Services
  • Mergers and Acquisitions Advisory
  • Business Transfer Services

By End User Industry

  • Healthcare
  • Manufacturing
  • Retail
  • Technology
  • Services
  • Others

By Geography

  • North America
    • U.S.
    • Canada
    • Mexico
  • Europe
    • Germany
    • France
    • U.K.
    • Italy
    • Spain
    • Rest of Europe
  • Asia Pacific
    • China
    • Japan
    • India
    • South Korea
    • South-east Asia
    • Rest of Asia Pacific
  • Latin America
    • Brazil
    • Argentina
    • Rest of Latin America
  • Middle East & Africa
    • GCC Countries
    • South Africa
    • Rest of the Middle East and Africa

Competitive Landscape

The Business Broker Service market presents a fragmented yet competitive landscape, featuring a mix of established firms and emerging digital-first players. Leading companies such as Sunbelt Business Brokers, Transworld Business Advisors, and Morgan & Westfield hold strong market positions through expansive networks, industry experience, and diversified service portfolios. These firms offer end-to-end brokerage solutions, including buy-side and sell-side representation, valuation services, and M&A advisory. At the same time, digital platforms like Empire Flippers, Website Closers, and Flippa are gaining momentum by catering to online businesses and startups, leveraging technology to streamline transactions and broaden client reach. Competition is shaped by service quality, transaction transparency, industry specialization, and regional presence. Firms are increasingly focusing on strategic partnerships, digital integration, and market expansion to strengthen their foothold. As demand for professional advisory services grows, especially from SMEs and niche industries, the market is witnessing gradual consolidation and innovation-driven differentiation among key players.

Shape Your Report to Specific Countries or Regions & Enjoy 30% Off!

Key Player Analysis

  • Earned Exits
  • Sunbelt Business Brokers
  • Transworld Business Advisors
  • Morgan & Westfield
  • Woodbridge International
  • FE International
  • Empire Flippers
  • Website Closers
  • Business Exits
  • First Choice Business Brokers
  • Digital Exits
  • Flippa

Recent Developments

  • In May 2025, Earned Exits was named “2025 Business Broker of the Year” by the International Workshop on Supplier Performance, highlighting its industry leadership and service quality.
  • In March 2025, Earned Exits topped the U.S. business broker rankings, lauded for its exceptional performance, client satisfaction, and innovative sales methods. Business Broker Newshighlighted their focus on aligning with owners’ goals, emphasizing legacy protection and meaningful post-transaction impact, according to Business Broker News. Other firms in the top five included Flippa, Website Closers, Empire Flippers, and Business Exits.
  • In February 2025, Flippa, under CEO Blake Hutchison, launched a new global financing initiative in partnership with a fintech company. This initiative aims to make acquisition funding more readily available to buyers of online businesses worldwide, streamlining the process with instant financing options. Simultaneously, Flippa is actively expanding its community engagement through in-person meetups, fostering connections and facilitating deal flow within the online business ecosystem.
  • In January 2025, Transworld was recognized as the top performer in the business services category of Entrepreneur’s 2025 Franchise 500, reflecting its trusted leadership and global success.
  • In November 2024, Sunbelt Business Brokers was recognized as a top four franchisor in the U.S. business broker industry, according to a major research report. This report, which analyzed a $1.8 billion market, highlighted the industry’s growth and trends like the increasing adoption of technology and AI, as well as the diversification of income streams. Sunbelt’s inclusion reflects its significant role in this expanding market.

Market Concentration & Characteristics

The Business Broker Service Market exhibits moderate to high market concentration, with a mix of well-established firms and a growing number of specialized and digital-first players. It features a fragmented structure in certain regions, particularly in emerging markets, while North America and parts of Europe remain dominated by a few key players with extensive service portfolios. It is characterized by high client reliance on industry expertise, valuation accuracy, and transaction transparency. The market is service-driven, where reputation, network strength, and sector specialization play critical roles in client acquisition and retention. Brokers with advanced digital tools and streamlined processes gain a competitive edge, particularly in serving technology and e-commerce businesses. Client engagement tends to be long-term, with brokers often supporting multiple phases of a business lifecycle, from valuation to exit. While traditional sectors still demand full-service advisory, digital platforms are reshaping buyer-seller interactions. The market continues to evolve toward higher professionalism and technology integration.

Report Coverage

The research report offers an in-depth analysis based on Service Type, End User Industry and Geography. It details leading market players, providing an overview of their business, product offerings, investments, revenue streams, and key applications. Additionally, the report includes insights into the competitive environment, SWOT analysis, current market trends, as well as the primary drivers and constraints. Furthermore, it discusses various factors that have driven market expansion in recent years. The report also explores market dynamics, regulatory scenarios, and technological advancements that are shaping the industry. It assesses the impact of external factors and global economic changes on market growth. Lastly, it provides strategic recommendations for new entrants and established companies to navigate the complexities of the market.

Future Outlook

  1. The market is expected to grow steadily, driven by increasing demand for professional support in business sales and acquisitions.
  2. Small and medium-sized enterprises will continue to be major contributors to market expansion.
  3. Digital platforms will play a larger role in streamlining brokerage services and reaching wider audiences.
  4. Specialized brokerage services for online businesses and niche sectors will gain more traction.
  5. North America will remain the dominant region due to mature infrastructure and high M&A activity.
  6. Asia Pacific will witness the fastest growth, supported by rising entrepreneurship and economic development.
  7. Demand for accurate business valuation and financial advisory will continue to strengthen.
  8. The adoption of AI and analytics tools will improve deal matching and client engagement.
  9. Strategic partnerships and market consolidation among firms will increase competition and service quality.
  10. Regulatory developments will require brokers to maintain higher transparency and compliance standards.

CHAPTER NO. 1: GENESIS OF THE MARKET

1.1 Market Prelude – Introduction & Scope

1.2 The Big Picture – Objectives & Vision

1.3 Strategic Edge – Unique Value Proposition

1.4 Stakeholder Compass – Key Beneficiaries

CHAPTER NO. 2: EXECUTIVE LENS

2.1 Pulse of the Industry – Market Snapshot

2.2 Growth Arc – Revenue Projections (USD Million)

2.3. Premium Insights – Based on Primary Interviews

CHAPTER NO. 3: BUSINESS BROKER SERVICE MARKET FORCES & INDUSTRY PULSE

3.1 Foundations of Change – Market Overview
3.2 Catalysts of Expansion – Key Market Drivers
3.2.1 Momentum Boosters – Growth Triggers
3.2.2 Innovation Fuel – Disruptive Technologies
3.3 Headwinds & Crosswinds – Market Restraints
3.3.1 Regulatory Tides – Compliance Challenges
3.3.2 Economic Frictions – Inflationary Pressures
3.4 Untapped Horizons – Growth Potential & Opportunities
3.5 Strategic Navigation – Industry Frameworks
3.5.1 Market Equilibrium – Porter’s Five Forces
3.5.2 Ecosystem Dynamics – Value Chain Analysis
3.5.3 Macro Forces – PESTEL Breakdown

3.6 Price Trend Analysis

    3.6.1 Regional Price Trend
3.6.2 Price Trend by Product

CHAPTER NO. 4: KEY INVESTMENT EPICENTER         

4.1 Regional Goldmines – High-Growth Geographies

4.2 Product Frontiers – Lucrative Product Categories

4.3 Application Sweet Spots – Emerging Demand Segments

CHAPTER NO. 5: REVENUE TRAJECTORY & WEALTH MAPPING

5.1 Momentum Metrics – Forecast & Growth Curves

5.2 Regional Revenue Footprint – Market Share Insights

5.3 Segmental Wealth Flow – Service Type & End User Industry Revenue

CHAPTER NO. 6 : TRADE & COMMERCE ANALYSIS    

6.1.      Import Analysis by Region

6.1.1.    Global Business Broker Service Market Import Revenue By Region

6.2.      Export Analysis by Region

6.2.1.    Global Business Broker Service Market Export Revenue By Region

CHAPTER NO. 7: COMPETITION ANALYSIS       

7.1.      Company Market Share Analysis

7.1.1.    Global Business Broker Service Market: Company Market Share

7.2.      Global Business Broker Service Market Company Revenue Market Share

7.3.      Strategic Developments

7.3.1.    Acquisitions & Mergers

7.3.2.    New Product Launch

7.3.3.    Regional Expansion

7.4.      Competitive Dashboard

7.5.    Company Assessment Metrics, 2024

CHAPTER NO. 8: BUSINESS BROKER SERVICE MARKET – BY SERVICE TYPE SEGMENT ANALYSIS

8.1.      Business Broker Service Market Overview by Service Type Segment

8.1.1.    Business Broker Service Market Revenue Share By Service Type

8.2.      Buy-Side Services

8.3.      Sell-Side Services

8.4.      Valuation Services

8.5.      Mergers and Acquisitions Advisory

8.6.      Business Transfer Services

CHAPTER NO. 9: BUSINESS BROKER SERVICE MARKET – BY END USER INDUSTRY SEGMENT ANALYSIS

9.1.      Business Broker Service Market Overview by End User Industry Segment

9.1.1.    Business Broker Service Market Revenue Share By End User Industry

9.2.      Healthcare

9.3.      Manufacturing

9.4.      Retail

9.5.      Technology

9.6.      Services

9.7.      Others

CHAPTER NO. 10: BUSINESS BROKER SERVICE MARKET – REGIONAL ANALYSIS     

10.1.     Business Broker Service Market Overview by Region Segment

10.1.1.  Global Business Broker Service Market Revenue Share By Region

10.1.2.  Regions

10.1.3.  Service Type

10.1.4.  Global Business Broker Service Market Revenue By Service Type

10.1.5.  End User Industry

10.1.6.  Global Business Broker Service Market Revenue By End User Industry

CHAPTER NO. 11: NORTH AMERICA BUSINESS BROKER SERVICE MARKET – COUNTRY ANALYSIS

11.1.     North America Business Broker Service Market Overview by Country Segment

11.1.1.  North America Business Broker Service Market Revenue Share By Region

11.2.     North America

11.2.1.  North America Business Broker Service Market Revenue By Country

11.2.2.  Service Type

11.2.3.  North America Business Broker Service Market Revenue By Service Type

11.2.4.  End User Industry

11.2.5.  North America Business Broker Service Market Revenue By End User Industry

11.3.     U.S.

11.4.     Canada

11.5.     Mexico

CHAPTER NO. 12: EUROPE BUSINESS BROKER SERVICE MARKET – COUNTRY ANALYSIS         

12.1.     Europe Business Broker Service Market Overview by Country Segment

12.1.1.  Europe Business Broker Service Market Revenue Share By Region

12.2.     Europe

12.2.1.  Europe Business Broker Service Market Revenue By Country

12.2.2.  Service Type

12.2.3.  Europe Business Broker Service Market Revenue By Service Type

12.2.4.  End User Industry

12.2.5.  Europe Business Broker Service Market Revenue By End User Industry

12.3.     UK

12.4.     France

12.5.     Germany

12.6.     Italy

12.7.     Spain

12.8.     Russia

12.9.   Rest of Europe

CHAPTER NO. 13: ASIA PACIFIC BUSINESS BROKER SERVICE MARKET – COUNTRY ANALYSIS

13.1.     Asia Pacific Business Broker Service Market Overview by Country Segment

13.1.1.  Asia Pacific Business Broker Service Market Revenue Share By Region

13.2.     Asia Pacific

13.2.1.  Asia Pacific Business Broker Service Market Revenue By Country

13.2.2.  Service Type

13.2.3.  Asia Pacific Business Broker Service Market Revenue By Service Type

13.2.4.  End User Industry

13.2.5.  Asia Pacific Business Broker Service Market Revenue By End User Industry

13.3.     China

13.4.     Japan

13.5.     South Korea

13.6.     India

13.7.     Australia

13.8.     Southeast Asia

13.9.     Rest of Asia Pacific

CHAPTER NO. 14: LATIN AMERICA BUSINESS BROKER SERVICE MARKET – COUNTRY ANALYSIS

14.1.     Latin America Business Broker Service Market Overview by Country Segment

14.1.1.  Latin America Business Broker Service Market Revenue Share By Region

14.2.     Latin America

14.2.1.  Latin America Business Broker Service Market Revenue By Country

14.2.2.  Service Type

14.2.3.  Latin America Business Broker Service Market Revenue By Service Type

14.2.4.  End User Industry

14.2.5.  Latin America Business Broker Service Market Revenue By End User Industry

14.3.     Brazil

14.4.     Argentina

14.5.     Rest of Latin America

CHAPTER NO. 15: MIDDLE EAST BUSINESS BROKER SERVICE MARKET – COUNTRY ANALYSIS

15.1.     Middle East Business Broker Service Market Overview by Country Segment

15.1.1.  Middle East Business Broker Service Market Revenue Share By Region

15.2.     Middle East

15.2.1.  Middle East Business Broker Service Market Revenue By Country

15.2.2.  Service Type

15.2.3.  Middle East Business Broker Service Market Revenue By Service Type

15.2.4.  End User Industry

15.2.5.  Middle East Business Broker Service Market Revenue By End User Industry

15.3.     GCC Countries

15.4.     Israel

15.5.     Turkey

15.6.     Rest of Middle East

CHAPTER NO. 16: AFRICA BUSINESS BROKER SERVICE MARKET – COUNTRY ANALYSIS

16.1.     Africa Business Broker Service Market Overview by Country Segment

16.1.1.  Africa Business Broker Service Market Revenue Share By Region

16.2.     Africa

16.2.1.  Africa Business Broker Service Market Revenue By Country

16.2.2.  Service Type

16.2.3.  Africa Business Broker Service Market Revenue By Service Type

16.2.4.  End User Industry

16.2.5.  Africa Business Broker Service Market Revenue By End User Industry

16.3.     South Africa

16.4.     Egypt

16.5.     Rest of Africa

CHAPTER NO. 17: COMPANY PROFILES 

17.1.     Earned Exits

17.1.1.  Company Overview

17.1.2.  Product Portfolio

17.1.3.  Financial Overview

17.1.4.  Recent Developments

17.1.5.  Growth Strategy

17.1.6.  SWOT Analysis

17.2.     Sunbelt Business Brokers

17.3.     Transworld Business Advisors

17.4.     Morgan & Westfield

17.5.     Woodbridge International

17.6.     FE International

17.7.     Empire Flippers

17.8.     Website Closers

17.9.     Business Exits

17.10.   First Choice Business Brokers

17.11.   Digital Exits

17.12.   Flippa

Request Free Sample

We prioritize the confidentiality and security of your data. Our promise: your information remains private.

Ready to Transform Data into Decisions?

Request Your Sample Report and Start Your Journey of Informed Choices


Providing the strategic compass for industry titans.

cr-clients-logos

Frequently Asked Questions

What is the current size of the Business Broker Service Market?

The market was valued at USD 5,286.78 million in 2024 and is projected to reach USD 8,227.26 million by 2032.

What are the key segments within the Business Broker Service Market?

The market is segmented by service type (Buy-Side, Sell-Side, Valuation, M&A Advisory, Business Transfer) and end-user industry (Healthcare, Retail, Manufacturing, etc.).

What are some challenges faced by the Business Broker Service Market?

Market fragmentation, regulatory complexity, and economic uncertainty are major challenges limiting smooth market growth

Who are the major players in the Business Broker Service Market?

Key players include Sunbelt Business Brokers, Transworld Business Advisors, Morgan & Westfield, Empire Flippers, and Flippa.

About Author

Sushant Phapale

Sushant Phapale

ICT & Automation Expert

Sushant is an expert in ICT, automation, and electronics with a passion for innovation and market trends.

View Profile

Related Reports

Driving School Software Market

Driving School Software Market size was valued at USD 58.38 million in 2018 to USD 99.66 million in 2024 and is anticipated to reach USD 184.40 million by 2032, at a CAGR of 7.45% during the forecast period.

Tunnel Monitoring System Market

Tunnel Monitoring System Market size was valued USD 529 million in 2024 and is anticipated to reach USD 1517.16 million by 2032, at a CAGR of 14.07% during the forecast period.

Location Based Services and Real Time Location System Market

Location Based Services and Real Time Location System market size was valued USD 83 Billion in 2024 and is anticipated to reach USD 197.41 Billion by 2032, at a CAGR of 11.5% during the forecast period.

3D Retail Merchandising Software Market

3D Retail Merchandising Software market size was valued at USD 1.28 billion in 2024 and is anticipated to reach USD 3.66 billion by 2032, at a CAGR of 14% during the forecast period.

Furniture Manufacturing Software Market

The furniture manufacturing software market size was valued at USD 13.55 billion in 2024 and is expected to reach USD 20.33 billion by 2030, growing at a CAGR of 5.2% during the forecast period.

Digital TV SoC Market

The digital TV SoC market size was valued at USD 13.02 billion in 2024 and is anticipated to reach USD 33.17 billion by 2030, growing at a CAGR of 12.4% during the forecast period.

Geofencing Market

The Geofencing Market size was valued at USD 2.73 billion in 2024 and is anticipated to reach USD 9.99 billion by 2032, at a CAGR of 17.6% during the forecast period (2024-2032).

Carbon Management Software Market

The Global Carbon Management Software Market size was valued at USD 4,905.05 million in 2018 to USD 10,168.61 million in 2024 and is anticipated to reach USD 25,969.90 million by 2032, at a CAGR of 11.59% during the forecast period.

Hybrid Infrastructure Managed Services Market

The Global Hybrid Infrastructure Managed Services Market size was valued at USD 4,040.68 million in 2018 to USD 6,827.06 million in 2024 and is anticipated to reach USD 14,798.68 million by 2032, at a CAGR of 9.46% during the forecast period.

Canada Background Screening Market

The Canada Background Screening Market size was valued at USD 330.98 million in 2018 to USD 599.42 million in 2024 and is anticipated to reach USD 1,429.46 million by 2032, at a CAGR of 10.69% during the forecast period.

Carbon Monoxide Alarm Market

The Carbon Monoxide Alarm Market size was valued at USD 447.79 million in 2024 and is anticipated to reach USD 912.09 million by 2032, at a CAGR of 9.3% during the forecast period (2024-2032).

Indonesia Data Center Colocation Market

The Indonesia Data Center Colocation Market size was valued at USD 145.56 million in 2018 to USD 310.64 million in 2024 and is anticipated to reach USD 1,213.80 million by 2032, at a CAGR of 17.32% during the forecast period.

Licence Option

The report comes as a view-only PDF document, optimized for individual clients. This version is recommended for personal digital use and does not allow printing. Use restricted to one purchaser only.
$4999

To meet the needs of modern corporate teams, our report comes in two formats: a printable PDF and a data-rich Excel sheet. This package is optimized for internal analysis. Unlimited users allowed within one corporate location (e.g., regional office).
$6999

The report will be delivered in printable PDF format along with the report’s data Excel sheet. This license offers 100 Free Analyst hours where the client can utilize Credence Research Inc. research team. Permitted for unlimited global use by all users within the purchasing corporation, such as all employees of a single company.
$12999

Report delivery within 24 to 48 hours

Credence Staff 3

WILLIAM, North America

Support Staff at Credence Research

KEITH PHILLIPS, Europe

Lee - CR Sales Staff

LEE VALLANCE, Asia Pacific

Kieran Jameson

KIERAN JAMESON, Australia

Smallform of Sample request
User Review

Thank you for the data! The numbers are exactly what we asked for and what we need to build our business case.

Materials Scientist
(privacy requested)

User Review

The report was an excellent overview of the Industrial Burners market. This report does a great job of breaking everything down into manageable chunks.

Imre Hof
Management Assistant, Bekaert

cr-clients-logos

Request Sample