Market Overview
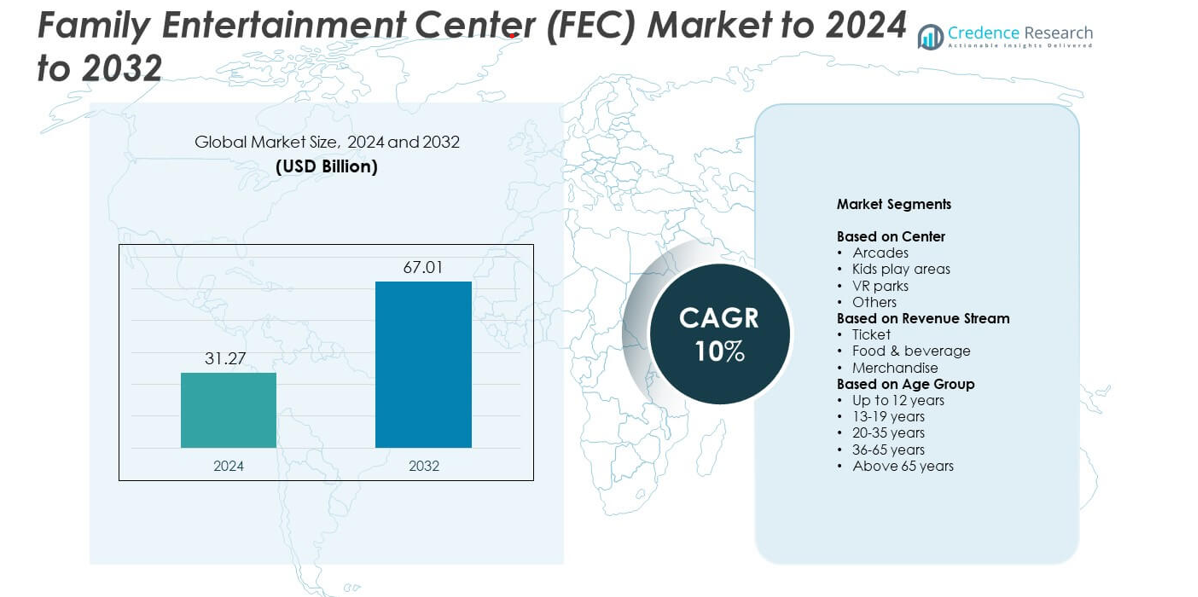
The Family Entertainment Center (FEC) market size was valued at USD 31.27 billion in 2024 and is anticipated to reach USD 67.01 billion by 2032, at a CAGR of 10% during the forecast period.
| REPORT ATTRIBUTE |
DETAILS |
| Historical Period |
2020-2023 |
| Base Year |
2024 |
| Forecast Period |
2025-2032 |
| Family Entertainment Center (FEC) Market Size 2024 |
USD 31.27 billion |
| Family Entertainment Center (FEC) Market, CAGR |
10% |
| Family Entertainment Center (FEC) Market Size 2032 |
USD 67.01 billion |
The Family Entertainment Center market is driven by prominent companies such as Bowlero Corp., KidZania, Dave & Buster’s, Sky Zone, Legoland Discovery Center, Majid Al Futtaim Leisure and Entertainment, and Round1 Bowling & Amusement. These players are focusing on technology integration, immersive gaming, and themed entertainment to enhance customer engagement and brand value. Investments in VR, AR, and hybrid recreational formats are expanding their reach among youth and family audiences. North America led the global market with a 37% share in 2024, supported by strong infrastructure, high consumer spending, and continuous innovation in digital and interactive entertainment experiences.
Market Insights
- The Family Entertainment Center market was valued at USD 31.27 billion in 2024 and is expected to reach USD 67.01 billion by 2032, growing at a CAGR of 10%.
- Growth is driven by increasing consumer spending on leisure, expansion of mall-based entertainment zones, and rising demand for immersive digital gaming experiences.
- Trends include rapid adoption of VR and AR technologies, integration of themed and edutainment centers, and the emergence of hybrid entertainment models combining dining and recreation.
- The market is highly competitive with global and regional operators investing in digital innovation, franchise expansion, and differentiated customer experiences to strengthen brand presence.
- North America led with 37% share in 2024, followed by Europe at 28% and Asia Pacific at 25%, while arcades dominated the segmental landscape with 42% share due to strong consumer engagement and recurring participation.
Access crucial information at unmatched prices!
Request your sample report today & start making informed decisions powered by Credence Research Inc.!
Download Sample
Market Segmentation Analysis:
By Center
Arcades held the dominant share of 42% in the Family Entertainment Center market in 2024. The segment benefits from high consumer engagement driven by digital gaming, simulation rides, and interactive experiences. Increasing investment in advanced gaming technologies and multi-player attractions enhances repeat visits. Growing interest in skill-based games and e-sports arenas also supports expansion. Family groups and young adults prefer arcade centers for affordable recreation and social interaction, making them the largest revenue contributor across both developed and emerging markets.
- For instance, As of October 2025, GENDA’s North American network includes approximately 180 amusement arcades and 13,000 mini-locations.
By Revenue Stream
Ticket sales accounted for the largest revenue share of 46% in 2024. This segment’s growth stems from dynamic pricing strategies and bundled packages that enhance customer retention. Operators leverage mobile ticketing, online reservations, and loyalty programs to streamline entry and improve convenience. Food and beverage sales continue to complement ticket revenues through themed dining and experiential food zones. The consistent demand for entertainment access, combined with rising event participation and subscription-based passes, keeps ticketing the key revenue driver in the global market.
- For instance, Merlin Entertainments reported 62 million guests in 2023 across its attractions, reflecting large ticket volumes.
By Age Group
The 20–35 years age group dominated the market with a 38% share in 2024. This demographic values immersive entertainment and social experiences, driving demand for VR gaming, adventure zones, and team-based activities. The segment’s spending capacity and preference for modern attractions such as AR-integrated gaming boost footfall. FEC operators focus on introducing hybrid entertainment models blending digital and physical play to appeal to young adults. Their high engagement in urban centers and mall-based venues continues to shape future investment strategies across major regions.
Key Growth Drivers
Rising Consumer Spending on Leisure Activities
Increasing disposable income and changing lifestyle preferences are driving higher expenditure on leisure and recreation. Families and young adults are seeking immersive, technology-enabled experiences that combine fun and social interaction. The expansion of shopping malls and urban entertainment hubs further supports the growth of FECs. Operators are investing in themed attractions and digital games to attract repeat visitors, making consumer spending a critical factor driving the industry’s expansion across developed and emerging economies.
- For instance, The Entertainment and Education Group (TEEG) runs over 350 Family Entertainment Centres (FECs) under brands like Timezone, Kingpin, and Zone Bowling across seven countries.
Technological Advancements Enhancing Interactive Experiences
The integration of virtual reality (VR), augmented reality (AR), and motion-based gaming systems is reshaping the entertainment landscape. These technologies create more immersive and personalized experiences, appealing to diverse age groups. Operators are leveraging data analytics and IoT-enabled systems to monitor visitor behavior and optimize offerings. As interactive entertainment becomes central to modern FECs, technology adoption continues to enhance operational efficiency, customer satisfaction, and overall market competitiveness.
- For instance, In 2024, Cineplex operated its network of LBE venues, which includes its Rec Room and Playdium sites. The company added 3 new LBE locations during 2024
Expansion of Retail-Entertainment Integration
The growing adoption of the “retailtainment” concept is transforming shopping complexes into entertainment destinations. Retail developers are increasingly incorporating FECs to boost foot traffic and dwell time. This model benefits both sectors by blending shopping and entertainment in one location. Family-oriented entertainment centers within malls and mixed-use developments attract steady crowds, ensuring sustained revenue generation. The trend aligns with consumer preference for convenience and experiential leisure, driving market expansion in metropolitan regions.
Key Trends & Opportunities
Rise of VR and AR-Based Entertainment Zones
VR and AR experiences are becoming a core part of new FEC developments. These technologies offer dynamic engagement through multiplayer gaming, virtual sports, and interactive simulations. Global players are launching VR parks and immersive zones to attract tech-savvy audiences. Advancements in affordable VR equipment and motion capture systems are opening new opportunities for operators to expand offerings. This trend enhances visitor retention while positioning VR-based centers as high-growth attractions in the evolving entertainment market.
- For instance, Zero Latency has exceeded 120 free-roam virtual reality (VR) venues across 30 countries and has served over 5,000,000 players globally.
Growing Popularity of Themed and Edutainment Centers
Themed entertainment zones combining education and play are gaining traction, especially among children and families. These centers integrate learning-based activities with gaming to foster creativity and cognitive development. Schools and parent groups increasingly prefer such venues for field trips and events. The blend of education, entertainment, and digital content drives consistent demand. Operators introducing interactive exhibits and storytelling-based experiences are tapping into a lucrative opportunity within the global FEC ecosystem.
- For instance, KidZania has 29 operational parks across 22 countries, serving more than 9 million visitors annually, with an additional 12 facilities under development, as of mid-2025
Key Challenges
High Initial Investment and Operational Costs
Establishing and maintaining a modern entertainment center requires significant capital. The cost of advanced gaming equipment, VR setups, and regular maintenance limits entry for smaller operators. Additionally, ongoing expenses related to energy consumption, staffing, and technology upgrades can strain profitability. Companies must adopt efficient asset management and flexible pricing models to sustain margins. Balancing high-quality experiences with cost efficiency remains a key challenge for long-term viability.
Seasonal Demand Fluctuations and Market Saturation
FECs often face seasonal declines in visitor numbers, especially outside holidays and weekends. Urban areas with multiple centers experience market saturation, reducing per-center revenue. Operators must innovate through loyalty programs, corporate events, and digital engagement to maintain consistent traffic. Dependence on local demographics also limits scalability. Addressing these fluctuations through diversified offerings and adaptive marketing is essential to ensure stable performance across all regions.
Regional Analysis
North America
North America dominated the Family Entertainment Center market with a 37% share in 2024. The region benefits from high consumer spending on leisure and the strong presence of advanced gaming infrastructure. Major operators in the United States and Canada are investing in VR-based arcades, indoor amusement parks, and edutainment centers. Supportive retail expansion and mall-based entertainment developments continue to attract families and youth audiences. Rising demand for immersive and social experiences further strengthens the region’s leadership, supported by robust marketing strategies and technological innovation.
Europe
Europe accounted for a 28% market share in 2024, driven by expanding urban entertainment hubs and themed centers. Countries such as the United Kingdom, Germany, and France are investing in digital gaming arenas and family play zones. Strong government support for tourism and leisure activities fuels market expansion. Consumers increasingly favor indoor venues that combine recreation with dining and shopping. The region’s focus on sustainability and cultural themes also enhances visitor engagement, making Europe a significant contributor to the global FEC market.
Asia Pacific
Asia Pacific held a 25% share of the global market in 2024, emerging as the fastest-growing region. Rising disposable income, rapid urbanization, and the popularity of mall entertainment are key growth drivers. Countries like China, Japan, and India are witnessing a surge in FEC development within retail and mixed-use complexes. The growing youth population and adoption of VR and AR-based experiences attract continuous investment. Strategic partnerships between developers and entertainment chains are strengthening regional competitiveness, positioning Asia Pacific as a high-potential market for future growth.
Latin America
Latin America captured a 6% market share in 2024, supported by rising tourism and urban development initiatives. Countries such as Brazil and Mexico are seeing an increase in FEC installations within shopping malls and tourist zones. Middle-class families are showing growing interest in affordable leisure options, boosting regional participation. However, limited infrastructure and high equipment costs pose challenges for market expansion. The region’s young demographic and adoption of interactive games continue to create new opportunities for operators targeting localized entertainment experiences.
Middle East & Africa
The Middle East & Africa accounted for a 4% market share in 2024, led by investments in luxury entertainment complexes and theme parks. The UAE and Saudi Arabia are spearheading developments as part of broader tourism diversification efforts. High-income households and expanding retail sectors support premium FEC projects. However, growth remains limited in several African countries due to low consumer affordability and inadequate infrastructure. Ongoing government-backed entertainment projects and tourism initiatives are expected to accelerate demand over the coming years.
Market Segmentations:
By Center
- Arcades
- Kids play areas
- VR parks
- Others
By Revenue Stream
- Ticket
- Food & beverage
- Merchandise
By Age Group
- Up to 12 years
- 13-19 years
- 20-35 years
- 36-65 years
- Above 65 years
By Geography
- North America
- Europe
- Germany
- France
- U.K.
- Italy
- Spain
- Rest of Europe
- Asia Pacific
- China
- Japan
- India
- South Korea
- South-east Asia
- Rest of Asia Pacific
- Latin America
- Brazil
- Argentina
- Rest of Latin America
- Middle East & Africa
- GCC Countries
- South Africa
- Rest of the Middle East and Africa
Competitive Landscape
Leading companies such as Bowlero Corp., Scene75 Entertainment Centers, Legoland Discovery Center, Punch Bowl Social, Sky Zone, Timezone, KidZania, Round1 Bowling & Amusement, Altitude Trampoline Park, Majid Al Futtaim Leisure and Entertainment, Dave & Buster’s, and Dreamscape shape the competitive landscape of the Family Entertainment Center market. The market features a mix of global chains and regional operators focusing on technology-driven experiences and customer engagement. Companies are investing in digital gaming, immersive VR environments, and hybrid entertainment formats to attract a broader audience base. Strategic expansion through franchising, mergers, and partnerships enhances geographic presence and brand visibility. Operators are emphasizing differentiated offerings such as themed attractions, interactive dining, and event hosting to increase customer loyalty. Continuous innovation in design, sustainability, and digital integration remains key to gaining competitive advantage in a market characterized by high consumer expectations and rapid technological evolution.
Shape Your Report to Specific Countries or Regions & Enjoy 30% Off!
Key Player Analysis
- Bowlero Corp.
- Scene75 Entertainment Centers
- Legoland Discovery Center (Merlin Entertainments)
- Punch Bowl Social
- Sky Zone, LLC
- Timezone
- KidZania
- Round1 Bowling & Amusement
- Altitude Trampoline Park
- Majid Al Futtaim Leisure and Entertainment
- Dave & Buster’s
- Dreamscape
Recent Developments
- In 2024, Dave & Buster’s Entertainment Opened eleven new Dave & Buster’s and three Main Event stores, enhancing customer experience with new technology and optimized operations.
- In 2023, Timezone launched five new outlets across India, including a location in Mangalore’s Fiza Mall that featured bowling, Dark Mars VR, and a total of 67 games and attractions
- In 2022, Dreamscape launched a VR attraction at Riyadh Park mall. Technology is the center of attraction for visitors to Riyadh and has also increased the interactive activities in the region.
Report Coverage
The research report offers an in-depth analysis based on Center, Revenue Stream, Age Group and Geography. It details leading market players, providing an overview of their business, product offerings, investments, revenue streams, and key applications. Additionally, the report includes insights into the competitive environment, SWOT analysis, current market trends, as well as the primary drivers and constraints. Furthermore, it discusses various factors that have driven market expansion in recent years. The report also explores market dynamics, regulatory scenarios, and technological advancements that are shaping the industry. It assesses the impact of external factors and global economic changes on market growth. Lastly, it provides strategic recommendations for new entrants and established companies to navigate the complexities of the market.
Future Outlook
- The market will expand with growing consumer demand for immersive entertainment experiences.
- Integration of VR and AR technologies will enhance engagement and attract younger audiences.
- Mall-based entertainment zones will continue driving steady footfall across urban regions.
- Digital ticketing and loyalty programs will strengthen customer retention and recurring revenue.
- Themed and edutainment centers will gain traction among families and schools.
- Partnerships between retail developers and entertainment chains will increase globally.
- Operators will invest more in sustainability and energy-efficient facility designs.
- AI-driven analytics will improve visitor management and personalized experiences.
- Emerging economies will witness rapid expansion due to rising middle-class spending.
- Technological innovation and hybrid entertainment models will shape the market’s long-term growth.


