CHAPTER NO. 1 : INTRODUCTION 24
1.1.1. Report Description 24
Purpose of the Report 24
USP & Key Offerings 24
1.1.2. Key Benefits for Stakeholders 24
1.1.3. Target Audience 25
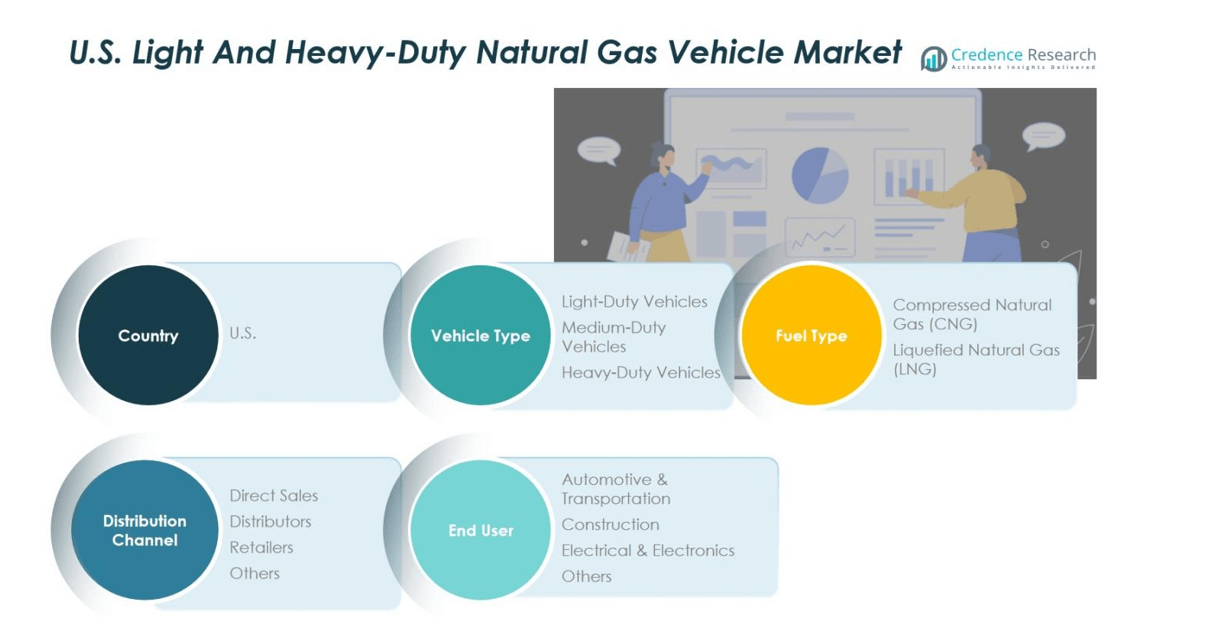
1.1.4. Report Scope 25
CHAPTER NO. 2 : EXECUTIVE SUMMARY 26
2.1. Light And Heavy-Duty Natural Gas Vehicle Market Snapshot 26
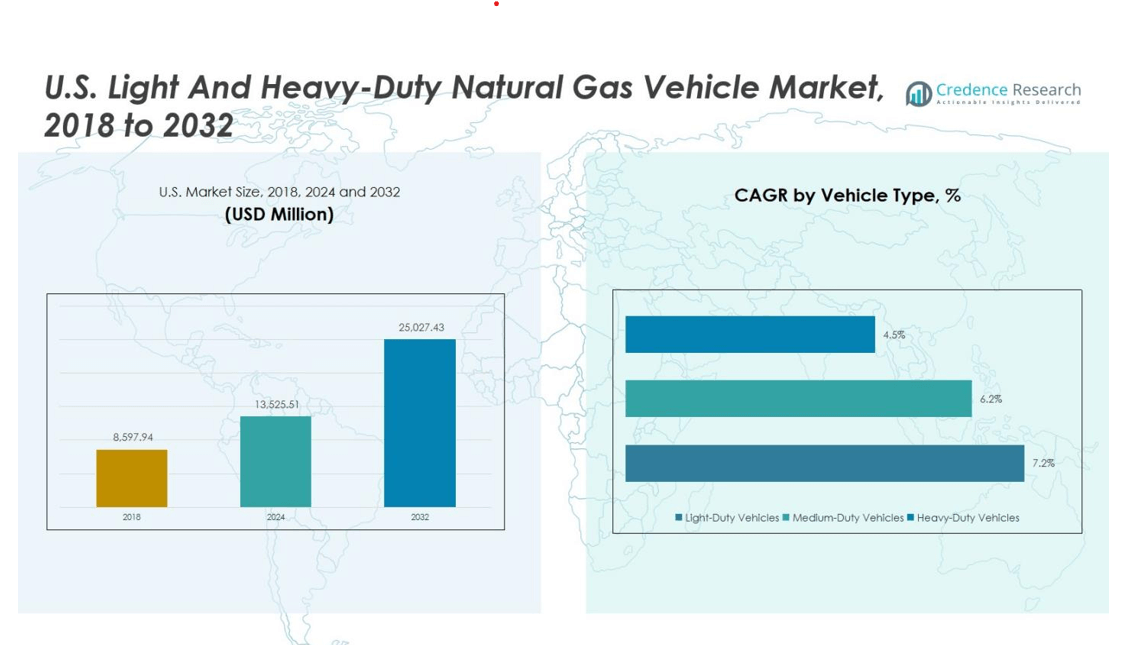
2.1.1. U.S. Light And Heavy-Duty Natural Gas Vehicle Market, 2020 – 2033 (Units) (USD Million) 28
2.2. Insights from Primary Respondents 28
CHAPTER NO. 3 : LIGHT AND HEAVY-DUTY NATURAL GAS VEHICLE MARKET – INDUSTRY ANALYSIS 29
3.1. Introduction 29
3.2. Market Drivers 30
3.2.1. Increasingly stringent emission norms encourage adoption of CNG/LNG vehicles 30
3.2.2. Natural gas vehicles offer fuel cost savings and lower total cost 31
3.3. Market Restraints 32
3.3.1. Higher upfront cost of NGVs than conventional vehicles 32
3.4. Market Opportunities 33
3.4.1. Market Opportunity Analysis 33
3.5. Porter’s Five Forces Analysis 34
3.6. Value Chain Analysis 35
3.7. Buying Criteria 36
CHAPTER NO. 4 : PRICE ANALYSIS 37
4.1. Price Analysis by State 37
4.1.1. U.S. Vehicle Type Market Price, By State, 2020 – 2025 37
4.2. Price Analysis by Vehicle Type 38
4.2.1. U.S. Light And Heavy-Duty Natural Gas Vehicle Market Price, By Vehicle Type, 2020 – 2025 38
4.2.2. U.S. Vehicle Type Market Price, By Vehicle Type, 2020 – 2025 38
CHAPTER NO. 5 : ANALYSIS COMPETITIVE LANDSCAPE 39
5.1. Company Market Share Analysis – 2024 39
5.1.1. U.S. Light And Heavy-Duty Natural Gas Vehicle Market: Company Market Share, by Volume, 2024 39
5.1.2. U.S. Light And Heavy-Duty Natural Gas Vehicle Market: Company Market Share, by Revenue, 2024 40
5.1.3. U.S. Light And Heavy-Duty Natural Gas Vehicle Market: Top 6 Company Market Share, by Revenue, 2024 41
5.1.4. U.S. Light And Heavy-Duty Natural Gas Vehicle Market: Top 3 Company Market Share, by Revenue, 2024 41
5.2. U.S. Light And Heavy-Duty Natural Gas Vehicle Market Company Volume Market Share, 2023 42
5.3. U.S. Light And Heavy-Duty Natural Gas Vehicle Market Company Revenue Market Share, 2023 43
5.4. Company Assessment Metrics, 2024 44
5.4.1. Stars 44
5.4.2. Emerging Leaders 44
5.4.3. Pervasive Players 44
5.4.4. Participants 44
5.5. Start-ups /SMEs Assessment Metrics, 2024 44
5.5.1. Progressive Companies 44
5.5.2. Responsive Companies 44
5.5.3. Dynamic Companies 44
5.5.4. Starting Blocks 44
5.6. Strategic Developments 45
5.6.1. Acquisitions & Mergers 45
5.6.2. New Product Launch 45
5.6.3. State-wise Expansion 45
5.7. Key Players Product Matrix 46
CHAPTER NO. 6 : PESTEL & ADJACENT MARKET ANALYSIS 47
6.1. PESTEL 47
6.1.1. Political Factors 47
6.1.2. Economic Factors 47
6.1.3. Social Factors 47
6.1.4. Technological Factors 47
6.1.5. Environmental Factors 47
6.1.6. Legal Factors 47
6.2. Adjacent Market Analysis 47
CHAPTER NO. 7 : LIGHT AND HEAVY-DUTY NATURAL GAS VEHICLE MARKET – BY VEHICLE TYPE SEGMENT ANALYSIS 48
7.1. Light And Heavy-Duty Natural Gas Vehicle Market Overview, by Vehicle Type Segment 48
7.1.1. Light And Heavy-Duty Natural Gas Vehicle Market Volume Share, By Vehicle Type, 2024 & 2033 49
7.1.2. Light And Heavy-Duty Natural Gas Vehicle Market Revenue Share, By Vehicle Type, 2024 & 2033 49
7.1.3. Light And Heavy-Duty Natural Gas Vehicle Market Attractiveness Analysis, By Vehicle Type 50
7.1.4. Incremental Revenue Growth Opportunity, by Vehicle Type, 2026 – 2033 51
7.1.5. Light And Heavy-Duty Natural Gas Vehicle Market Revenue, By Vehicle Type, 2020, 2024, 2029 & 2033 52
7.2. Light-Duty Vehicles 53
7.3. Medium-Duty Vehicles 54
7.4. Heavy-Duty Vehicles 55
CHAPTER NO. 8 : LIGHT AND HEAVY-DUTY NATURAL GAS VEHICLE MARKET – BY FUEL TYPE SEGMENT ANALYSIS 56
8.1. Light And Heavy-Duty Natural Gas Vehicle Market Overview, by Fuel Type Segment 56
8.1.1. Light And Heavy-Duty Natural Gas Vehicle Market Volume Share, By Fuel Type, 2024 & 2033 57
8.1.2. Light And Heavy-Duty Natural Gas Vehicle Market Revenue Share, By Fuel Type, 2024 & 2033 57
8.1.3. Light And Heavy-Duty Natural Gas Vehicle Market Attractiveness Analysis, By Fuel Type 58
8.1.4. Incremental Revenue Growth Opportunity, by Fuel Type, 2026 – 2033 59
8.1.5. Light And Heavy-Duty Natural Gas Vehicle Market Revenue, By Fuel Type, 2020, 2024, 2029 & 2033 60
8.2. Compressed Natural Gas (CNG) 61
8.3. Liquefied Natural Gas (LNG) 62
CHAPTER NO. 9 : LIGHT AND HEAVY-DUTY NATURAL GAS VEHICLE MARKET – BY DISTRIBUTION CHANNEL SEGMENT ANALYSIS 63
9.1. Light And Heavy-Duty Natural Gas Vehicle Market Overview, by Distribution Channel Segment 63
9.1.1. Light And Heavy-Duty Natural Gas Vehicle Market Volume Share, By Distribution Channel, 2024 & 2033 64
9.1.2. Light And Heavy-Duty Natural Gas Vehicle Market Revenue Share, By Distribution Channel, 2024 & 2033 64
9.1.3. Light And Heavy-Duty Natural Gas Vehicle Market Attractiveness Analysis, By Distribution Channel 65
9.1.4. Incremental Revenue Growth Opportunity, by Distribution Channel, 2026 – 2033 66
9.1.5. Light And Heavy-Duty Natural Gas Vehicle Market Revenue, By Distribution Channel, 2020, 2024, 2029 & 2033 67
9.2. Direct Sales 68
9.3. Distributors 69
9.4. Retailers 70
9.5. Others 71
CHAPTER NO. 10 : LIGHT AND HEAVY-DUTY NATURAL GAS VEHICLE MARKET – BY END USER SEGMENT ANALYSIS 72
10.1. Light And Heavy-Duty Natural Gas Vehicle Market Overview, by End User Segment 72
10.1.1. Light And Heavy-Duty Natural Gas Vehicle Market Volume Share, By End User, 2024 & 2033 73
10.1.2. Light And Heavy-Duty Natural Gas Vehicle Market Revenue Share, By End User, 2024 & 2033 73
10.1.3. Light And Heavy-Duty Natural Gas Vehicle Market Attractiveness Analysis, By End User 74
10.1.4. Incremental Revenue Growth Opportunity, by End User, 2026 – 2033 75
10.1.5. Light And Heavy-Duty Natural Gas Vehicle Market Revenue, By End User, 2020, 2024, 2029 & 2033 76
10.2. Automotive & Transportation 77
10.3. Construction 78
10.4. Electrical & Electronics 79
10.5. Others 80
CHAPTER NO. 11 : LIGHT AND HEAVY-DUTY NATURAL GAS VEHICLE MARKET – GEORGIA 81
11.1. Georgia 81
11.1.1. Key Highlights 81
11.1.2. Georgia Light And Heavy-Duty Natural Gas Vehicle Market Volume, By Vehicle Type, 2020 – 2025 (Units) 82
11.1.3. Georgia Light And Heavy-Duty Natural Gas Vehicle Market Revenue, By Vehicle Type, 2020 – 2025 (USD Million) 83
11.1.4. Georgia Light And Heavy-Duty Natural Gas Vehicle Market Volume, By Fuel Type, 2020 – 2025 (Units) 84
11.1.5. Georgia Light And Heavy-Duty Natural Gas Vehicle Market Revenue, By Fuel Type, 2020 – 2025 (USD Million) 85
11.1.6. Georgia Light And Heavy-Duty Natural Gas Vehicle Market Volume, By Distribution Channel, 2020 – 2025 (Units) 86
11.1.7. Georgia Light And Heavy-Duty Natural Gas Vehicle Market Revenue, By Distribution Channel, 2020 – 2025 (USD Million) 87
11.1.8. Georgia Light And Heavy-Duty Natural Gas Vehicle Market Volume, By End User, 2020 – 2025 (Units) 88
11.1.9. Georgia Light And Heavy-Duty Natural Gas Vehicle Market Revenue, By End User, 2020 – 2025 (USD Million) 89
CHAPTER NO. 12 : LIGHT AND HEAVY-DUTY NATURAL GAS VEHICLE MARKET – ILLINOIS 90
12.1. Illinois 90
12.1.1. Key Highlights 90
12.1.2. Illinois Light And Heavy-Duty Natural Gas Vehicle Market Volume, By Vehicle Type, 2020 – 2025 (Units) 91
12.1.3. Illinois Light And Heavy-Duty Natural Gas Vehicle Market Revenue, By Vehicle Type, 2020 – 2025 (USD Million) 92
12.1.4. Illinois Light And Heavy-Duty Natural Gas Vehicle Market Volume, By Fuel Type, 2020 – 2025 (Units) 93
12.1.5. Illinois Light And Heavy-Duty Natural Gas Vehicle Market Revenue, By Fuel Type, 2020 – 2025 (USD Million) 94
12.1.6. Illinois Light And Heavy-Duty Natural Gas Vehicle Market Volume, By Distribution Channel, 2020 – 2025 (Units) 95
12.1.7. Illinois Light And Heavy-Duty Natural Gas Vehicle Market Revenue, By Distribution Channel, 2020 – 2025 (USD Million) 96
12.1.8. Illinois Light And Heavy-Duty Natural Gas Vehicle Market Volume, By End User, 2020 – 2025 (Units) 97
12.1.9. Illinois Light And Heavy-Duty Natural Gas Vehicle Market Revenue, By End User, 2020 – 2025 (USD Million) 98
CHAPTER NO. 13 : LIGHT AND HEAVY-DUTY NATURAL GAS VEHICLE MARKET – VIRGINIA 99
13.1. Virginia 99
13.1.1. Key Highlights 99
13.1.2. Virginia Light And Heavy-Duty Natural Gas Vehicle Market Volume, By Vehicle Type, 2020 – 2025 (Units) 100
13.1.3. Virginia Light And Heavy-Duty Natural Gas Vehicle Market Revenue, By Vehicle Type, 2020 – 2025 (USD Million) 101
13.1.4. Virginia Light And Heavy-Duty Natural Gas Vehicle Market Volume, By Fuel Type, 2020 – 2025 (Units) 102
13.1.5. Virginia Light And Heavy-Duty Natural Gas Vehicle Market Revenue, By Fuel Type, 2020 – 2025 (USD Million) 103
13.1.6. Virginia Light And Heavy-Duty Natural Gas Vehicle Market Volume, By Distribution Channel, 2020 – 2025 (Units) 104
13.1.7. Virginia Light And Heavy-Duty Natural Gas Vehicle Market Revenue, By Distribution Channel, 2020 – 2025 (USD Million) 105
13.1.8. Virginia Light And Heavy-Duty Natural Gas Vehicle Market Volume, By End User, 2020 – 2025 (Units) 106
13.1.9. Virginia Light And Heavy-Duty Natural Gas Vehicle Market Revenue, By End User, 2020 – 2025 (USD Million) 107
CHAPTER NO. 14 : LIGHT AND HEAVY-DUTY NATURAL GAS VEHICLE MARKET – REST OF U.S. 108
14.1. Rest of U.S. 108
14.1.1. Key Highlights 108
14.1.2. Rest of U.S. Light And Heavy-Duty Natural Gas Vehicle Market Volume, By Vehicle Type, 2020 – 2025 (Units) 109
14.1.3. Rest of U.S. Light And Heavy-Duty Natural Gas Vehicle Market Revenue, By Vehicle Type, 2020 – 2025 (USD Million) 110
14.1.4. Rest of U.S. Light And Heavy-Duty Natural Gas Vehicle Market Volume, By Fuel Type, 2020 – 2025 (Units) 111
14.1.5. Rest of U.S. Light And Heavy-Duty Natural Gas Vehicle Market Revenue, By Fuel Type, 2020 – 2025 (USD Million) 112
14.1.6. Rest of U.S. Light And Heavy-Duty Natural Gas Vehicle Market Volume, By Distribution Channel, 2020 – 2025 (Units) 113
14.1.7. Rest of U.S. Light And Heavy-Duty Natural Gas Vehicle Market Revenue, By Distribution Channel, 2020 – 2025 (USD Million) 114
14.1.8. Rest of U.S. Light And Heavy-Duty Natural Gas Vehicle Market Volume, By End User, 2020 – 2025 (Units) 115
14.1.9. Rest of U.S. Light And Heavy-Duty Natural Gas Vehicle Market Revenue, By End User, 2020 – 2025 (USD Million) 116
CHAPTER NO. 15 : COMPANY PROFILES 117
15.1. General Motors 117
15.1.1. Company Overview 117
15.1.2. Product Portfolio 117
15.1.3. Financial Overview 117
15.2. Ford Motor Company 118
15.3. C&C Truck 118
15.4. Cummins Inc. 118
15.5. Nikola Corporation 118
15.6. Freightliner 118
15.7. Blue Bird Corporation 118
15.8. Company 8 118
15.9. Company 9 118
15.10. Company 10 118
15.11. Company 11 118
15.12. Company 12 118
15.13. Company 13 118
15.14. Company 14 118
List of Figures
FIG NO. 1. U.S. Light And Heavy-Duty Natural Gas Vehicle Market Volume & Revenue, 2020 – 2033 (Units) (USD Million) 28
FIG NO. 2. Porter’s Five Forces Analysis for U.S. Light And Heavy-Duty Natural Gas Vehicle Market 34
FIG NO. 3. Value Chain Analysis for U.S. Light And Heavy-Duty Natural Gas Vehicle Market 35
FIG NO. 4. U.S. Light And Heavy-Duty Natural Gas Vehicle Market Price, By Vehicle Type, 2020 – 2025 38
FIG NO. 5. Company Share Analysis, 2024 39
FIG NO. 6. Company Share Analysis, 2024 40
FIG NO. 7. Company Share Analysis, 2024 41
FIG NO. 8. Company Share Analysis, 2024 41
FIG NO. 9. Light And Heavy-Duty Natural Gas Vehicle Market – Company Volume Market Share, 2023 42
FIG NO. 10. Light And Heavy-Duty Natural Gas Vehicle Market – Company Revenue Market Share, 2023 43
FIG NO. 11. Light And Heavy-Duty Natural Gas Vehicle Market Volume Share, By Vehicle Type, 2024 & 2033 49
FIG NO. 12. Light And Heavy-Duty Natural Gas Vehicle Market Revenue Share, By Vehicle Type, 2024 & 2033 49
FIG NO. 13. Market Attractiveness Analysis, By Vehicle Type 50
FIG NO. 14. Incremental Revenue Growth Opportunity by Vehicle Type, 2026 – 2033 51
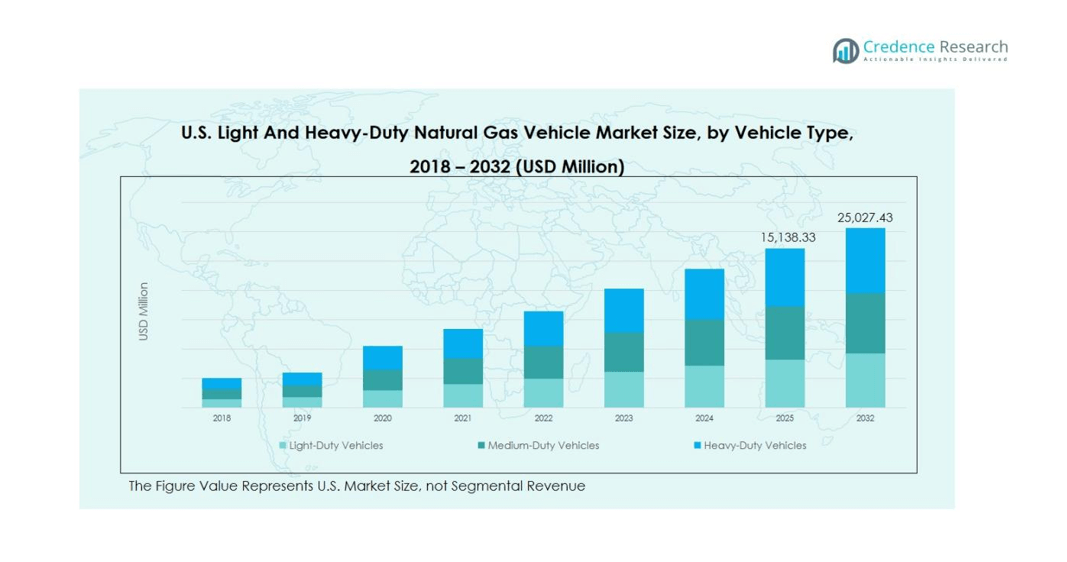
FIG NO. 15. Light And Heavy-Duty Natural Gas Vehicle Market Revenue, By Vehicle Type, 2020, 2024, 2029 & 2033 52
FIG NO. 16. U.S. Light And Heavy-Duty Natural Gas Vehicle Market for Light-Duty Vehicles, Volume & Revenue (Units) (USD Million) 2020 – 2033 53
FIG NO. 17. U.S. Light And Heavy-Duty Natural Gas Vehicle Market for Medium-Duty Vehicles, Volume & Revenue (Units) (USD Million) 2020 – 2033 54
FIG NO. 18. U.S. Light And Heavy-Duty Natural Gas Vehicle Market for Heavy-Duty Vehicles, Volume & Revenue (Units) (USD Million) 2020 – 2033 55
FIG NO. 19. Light And Heavy-Duty Natural Gas Vehicle Market Volume Share, By Fuel Type, 2024 & 2033 57
FIG NO. 20. Light And Heavy-Duty Natural Gas Vehicle Market Revenue Share, By Fuel Type, 2024 & 2033 57
FIG NO. 21. Market Attractiveness Analysis, By Fuel Type 58
FIG NO. 22. Incremental Revenue Growth Opportunity by Fuel Type, 2026 – 2033 59
FIG NO. 23. Light And Heavy-Duty Natural Gas Vehicle Market Revenue, By Fuel Type, 2020, 2024, 2029 & 2033 60
FIG NO. 24. U.S. Light And Heavy-Duty Natural Gas Vehicle Market for Compressed Natural Gas (CNG), Volume & Revenue (Units) (USD Million) 2020 – 2033 61
FIG NO. 25. U.S. Light And Heavy-Duty Natural Gas Vehicle Market for Liquefied Natural Gas (LNG), Volume & Revenue (Units) (USD Million) 2020 – 2033 62
FIG NO. 26. Light And Heavy-Duty Natural Gas Vehicle Market Volume Share, By Distribution Channel, 2024 & 2033 64
FIG NO. 27. Light And Heavy-Duty Natural Gas Vehicle Market Revenue Share, By Distribution Channel, 2024 & 2033 64
FIG NO. 28. Market Attractiveness Analysis, By Distribution Channel 65
FIG NO. 29. Incremental Revenue Growth Opportunity by Distribution Channel, 2026 – 2033 66
FIG NO. 30. Light And Heavy-Duty Natural Gas Vehicle Market Revenue, By Distribution Channel, 2020, 2024, 2029 & 2033 67
FIG NO. 31. U.S. Light And Heavy-Duty Natural Gas Vehicle Market for Direct Sales, Volume & Revenue (Units) (USD Million) 2020 – 2033 68
FIG NO. 32. U.S. Light And Heavy-Duty Natural Gas Vehicle Market for Distributors, Volume & Revenue (Units) (USD Million) 2020 – 2033 69
FIG NO. 33. U.S. Light And Heavy-Duty Natural Gas Vehicle Market for Retailers, Volume & Revenue (Units) (USD Million) 2020 – 2033 70
FIG NO. 34. U.S. Light And Heavy-Duty Natural Gas Vehicle Market for Others, Volume & Revenue (Units) (USD Million) 2020 – 2033 71
FIG NO. 35. Light And Heavy-Duty Natural Gas Vehicle Market Volume Share, By End User, 2024 & 2033 73
FIG NO. 36. Light And Heavy-Duty Natural Gas Vehicle Market Revenue Share, By End User, 2024 & 2033 73
FIG NO. 37. Market Attractiveness Analysis, By End User 74
FIG NO. 38. Incremental Revenue Growth Opportunity by End User, 2026 – 2033 75
FIG NO. 39. Light And Heavy-Duty Natural Gas Vehicle Market Revenue, By End User, 2020, 2024, 2029 & 2033 76
FIG NO. 40. U.S. Light And Heavy-Duty Natural Gas Vehicle Market for Automotive & Transportation, Volume & Revenue (Units) (USD Million) 2020 – 2033 77
FIG NO. 41. U.S. Light And Heavy-Duty Natural Gas Vehicle Market for Construction, Volume & Revenue (Units) (USD Million) 2020 – 2033 78
FIG NO. 42. U.S. Light And Heavy-Duty Natural Gas Vehicle Market for Electrical & Electronics, Volume & Revenue (Units) (USD Million) 2020 – 2033 79
FIG NO. 43. U.S. Light And Heavy-Duty Natural Gas Vehicle Market for Others, Volume & Revenue (Units) (USD Million) 2020 – 2033 80
FIG NO. 44. Georgia Light And Heavy-Duty Natural Gas Vehicle Market Volume & Revenue, 2020 – 2033 (Units) (USD Million) 81
FIG NO. 45. Illinois Light And Heavy-Duty Natural Gas Vehicle Market Volume & Revenue, 2020 – 2033 (Units) (USD Million) 90
FIG NO. 46. Virginia Light And Heavy-Duty Natural Gas Vehicle Market Volume & Revenue, 2020 – 2033 (Units) (USD Million) 99
FIG NO. 47. Rest of U.S. Light And Heavy-Duty Natural Gas Vehicle Market Volume & Revenue, 2020 – 2033 (Units) (USD Million) 108
List of Tables
TABLE NO. 1. : U.S. Light And Heavy-Duty Natural Gas Vehicle Market: Snapshot 26
TABLE NO. 2. : Drivers for the Light And Heavy-Duty Natural Gas Vehicle Market: Impact Analysis 30
TABLE NO. 3. : Restraints for the Light And Heavy-Duty Natural Gas Vehicle Market: Impact Analysis 32
TABLE NO. 4. : U.S. Light And Heavy-Duty Natural Gas Vehicle Market Volume & Revenue, By State, 2020 – 2025 37
TABLE NO. 5. : U.S. Light And Heavy-Duty Natural Gas Vehicle Market Volume & Revenue, By Vehicle Type, 2020 – 2025 38
TABLE NO. 6. : Georgia Light And Heavy-Duty Natural Gas Vehicle Market Volume, By Vehicle Type, 2020 – 2025 (Units) 82
TABLE NO. 7. : Georgia Light And Heavy-Duty Natural Gas Vehicle Market Volume, By Vehicle Type, 2026 – 2033 (Units) 82
TABLE NO. 8. : Georgia Light And Heavy-Duty Natural Gas Vehicle Market Revenue, By Vehicle Type, 2020 – 2025 (USD Million) 83
TABLE NO. 9. : Georgia Light And Heavy-Duty Natural Gas Vehicle Market Revenue, By Vehicle Type, 2026 – 2033 (USD Million) 83
TABLE NO. 10. : Georgia Light And Heavy-Duty Natural Gas Vehicle Market Volume, By Fuel Type, 2020 – 2025 (Units) 84
TABLE NO. 11. : Georgia Light And Heavy-Duty Natural Gas Vehicle Market Volume, By Fuel Type, 2026 – 2033 (Units) 84
TABLE NO. 12. : Georgia Light And Heavy-Duty Natural Gas Vehicle Market Revenue, By Fuel Type, 2020 – 2025 (USD Million) 85
TABLE NO. 13. : Georgia Light And Heavy-Duty Natural Gas Vehicle Market Revenue, By Fuel Type, 2026 – 2033 (USD Million) 85
TABLE NO. 14. : Georgia Light And Heavy-Duty Natural Gas Vehicle Market Volume, By Distribution Channel, 2020 – 2025 (Units) 86
TABLE NO. 15. : Georgia Light And Heavy-Duty Natural Gas Vehicle Market Volume, By Distribution Channel, 2026 – 2033 (Units) 86
TABLE NO. 16. : Georgia Light And Heavy-Duty Natural Gas Vehicle Market Revenue, By Distribution Channel, 2020 – 2025 (USD Million) 87
TABLE NO. 17. : Georgia Light And Heavy-Duty Natural Gas Vehicle Market Revenue, By Distribution Channel, 2026 – 2033 (USD Million) 87
TABLE NO. 18. : Georgia Light And Heavy-Duty Natural Gas Vehicle Market Volume, By End User, 2020 – 2025 (Units) 88
TABLE NO. 19. : Georgia Light And Heavy-Duty Natural Gas Vehicle Market Volume, By End User, 2026 – 2033 (Units) 88
TABLE NO. 20. : Georgia Light And Heavy-Duty Natural Gas Vehicle Market Revenue, By End User, 2020 – 2025 (USD Million) 89
TABLE NO. 21. : Georgia Light And Heavy-Duty Natural Gas Vehicle Market Revenue, By End User, 2026 – 2033 (USD Million) 89
TABLE NO. 22. : Illinois Light And Heavy-Duty Natural Gas Vehicle Market Volume, By Vehicle Type, 2020 – 2025 (Units) 91
TABLE NO. 23. : Illinois Light And Heavy-Duty Natural Gas Vehicle Market Volume, By Vehicle Type, 2026 – 2033 (Units) 91
TABLE NO. 24. : Illinois Light And Heavy-Duty Natural Gas Vehicle Market Revenue, By Vehicle Type, 2020 – 2025 (USD Million) 92
TABLE NO. 25. : Illinois Light And Heavy-Duty Natural Gas Vehicle Market Revenue, By Vehicle Type, 2026 – 2033 (USD Million) 92
TABLE NO. 26. : Illinois Light And Heavy-Duty Natural Gas Vehicle Market Volume, By Fuel Type, 2020 – 2025 (Units) 93
TABLE NO. 27. : Illinois Light And Heavy-Duty Natural Gas Vehicle Market Volume, By Fuel Type, 2026 – 2033 (Units) 93
TABLE NO. 28. : Illinois Light And Heavy-Duty Natural Gas Vehicle Market Revenue, By Fuel Type, 2020 – 2025 (USD Million) 94
TABLE NO. 29. : Illinois Light And Heavy-Duty Natural Gas Vehicle Market Revenue, By Fuel Type, 2026 – 2033 (USD Million) 94
TABLE NO. 30. : Illinois Light And Heavy-Duty Natural Gas Vehicle Market Volume, By Distribution Channel, 2020 – 2025 (Units) 95
TABLE NO. 31. : Illinois Light And Heavy-Duty Natural Gas Vehicle Market Volume, By Distribution Channel, 2026 – 2033 (Units) 95
TABLE NO. 32. : Illinois Light And Heavy-Duty Natural Gas Vehicle Market Revenue, By Distribution Channel, 2020 – 2025 (USD Million) 96
TABLE NO. 33. : Illinois Light And Heavy-Duty Natural Gas Vehicle Market Revenue, By Distribution Channel, 2026 – 2033 (USD Million) 96
TABLE NO. 34. : Illinois Light And Heavy-Duty Natural Gas Vehicle Market Volume, By End User, 2020 – 2025 (Units) 97
TABLE NO. 35. : Illinois Light And Heavy-Duty Natural Gas Vehicle Market Volume, By End User, 2026 – 2033 (Units) 97
TABLE NO. 36. : Illinois Light And Heavy-Duty Natural Gas Vehicle Market Revenue, By End User, 2020 – 2025 (USD Million) 98
TABLE NO. 37. : Illinois Light And Heavy-Duty Natural Gas Vehicle Market Revenue, By End User, 2026 – 2033 (USD Million) 98
TABLE NO. 38. : Virginia Light And Heavy-Duty Natural Gas Vehicle Market Volume, By Vehicle Type, 2020 – 2025 (Units) 100
TABLE NO. 39. : Virginia Light And Heavy-Duty Natural Gas Vehicle Market Volume, By Vehicle Type, 2026 – 2033 (Units) 100
TABLE NO. 40. : Virginia Light And Heavy-Duty Natural Gas Vehicle Market Revenue, By Vehicle Type, 2020 – 2025 (USD Million) 101
TABLE NO. 41. : Virginia Light And Heavy-Duty Natural Gas Vehicle Market Revenue, By Vehicle Type, 2026 – 2033 (USD Million) 101
TABLE NO. 42. : Virginia Light And Heavy-Duty Natural Gas Vehicle Market Volume, By Fuel Type, 2020 – 2025 (Units) 102
TABLE NO. 43. : Virginia Light And Heavy-Duty Natural Gas Vehicle Market Volume, By Fuel Type, 2026 – 2033 (Units) 102
TABLE NO. 44. : Virginia Light And Heavy-Duty Natural Gas Vehicle Market Revenue, By Fuel Type, 2020 – 2025 (USD Million) 103
TABLE NO. 45. : Virginia Light And Heavy-Duty Natural Gas Vehicle Market Revenue, By Fuel Type, 2026 – 2033 (USD Million) 103
TABLE NO. 46. : Virginia Light And Heavy-Duty Natural Gas Vehicle Market Volume, By Distribution Channel, 2020 – 2025 (Units) 104
TABLE NO. 47. : Virginia Light And Heavy-Duty Natural Gas Vehicle Market Volume, By Distribution Channel, 2026 – 2033 (Units) 104
TABLE NO. 48. : Virginia Light And Heavy-Duty Natural Gas Vehicle Market Revenue, By Distribution Channel, 2020 – 2025 (USD Million) 105
TABLE NO. 49. : Virginia Light And Heavy-Duty Natural Gas Vehicle Market Revenue, By Distribution Channel, 2026 – 2033 (USD Million) 105
TABLE NO. 50. : Virginia Light And Heavy-Duty Natural Gas Vehicle Market Volume, By End User, 2020 – 2025 (Units) 106
TABLE NO. 51. : Virginia Light And Heavy-Duty Natural Gas Vehicle Market Volume, By End User, 2026 – 2033 (Units) 106
TABLE NO. 52. : Virginia Light And Heavy-Duty Natural Gas Vehicle Market Revenue, By End User, 2020 – 2025 (USD Million) 107
TABLE NO. 53. : Virginia Light And Heavy-Duty Natural Gas Vehicle Market Revenue, By End User, 2026 – 2033 (USD Million) 107
TABLE NO. 54. : Rest of U.S. Light And Heavy-Duty Natural Gas Vehicle Market Volume, By Vehicle Type, 2020 – 2025 (Units) 109
TABLE NO. 55. : Rest of U.S. Light And Heavy-Duty Natural Gas Vehicle Market Volume, By Vehicle Type, 2026 – 2033 (Units) 109
TABLE NO. 56. : Rest of U.S. Light And Heavy-Duty Natural Gas Vehicle Market Revenue, By Vehicle Type, 2020 – 2025 (USD Million) 110
TABLE NO. 57. : Rest of U.S. Light And Heavy-Duty Natural Gas Vehicle Market Revenue, By Vehicle Type, 2026 – 2033 (USD Million) 110
TABLE NO. 58. : Rest of U.S. Light And Heavy-Duty Natural Gas Vehicle Market Volume, By Fuel Type, 2020 – 2025 (Units) 111
TABLE NO. 59. : Rest of U.S. Light And Heavy-Duty Natural Gas Vehicle Market Volume, By Fuel Type, 2026 – 2033 (Units) 111
TABLE NO. 60. : Rest of U.S. Light And Heavy-Duty Natural Gas Vehicle Market Revenue, By Fuel Type, 2020 – 2025 (USD Million) 112
TABLE NO. 61. : Rest of U.S. Light And Heavy-Duty Natural Gas Vehicle Market Revenue, By Fuel Type, 2026 – 2033 (USD Million) 112
TABLE NO. 62. : Rest of U.S. Light And Heavy-Duty Natural Gas Vehicle Market Volume, By Distribution Channel, 2020 – 2025 (Units) 113
TABLE NO. 63. : Rest of U.S. Light And Heavy-Duty Natural Gas Vehicle Market Volume, By Distribution Channel, 2026 – 2033 (Units) 113
TABLE NO. 64. : Rest of U.S. Light And Heavy-Duty Natural Gas Vehicle Market Revenue, By Distribution Channel, 2020 – 2025 (USD Million) 114
TABLE NO. 65. : Rest of U.S. Light And Heavy-Duty Natural Gas Vehicle Market Revenue, By Distribution Channel, 2026 – 2033 (USD Million) 114
TABLE NO. 66. : Rest of U.S. Light And Heavy-Duty Natural Gas Vehicle Market Volume, By End User, 2020 – 2025 (Units) 115
TABLE NO. 67. : Rest of U.S. Light And Heavy-Duty Natural Gas Vehicle Market Volume, By End User, 2026 – 2033 (Units) 115
TABLE NO. 68. : Rest of U.S. Light And Heavy-Duty Natural Gas Vehicle Market Revenue, By End User, 2020 – 2025 (USD Million) 116
TABLE NO. 69. : Rest of U.S. Light And Heavy-Duty Natural Gas Vehicle Market Revenue, By End User, 2026 – 2033 (USD Million) 116