Market Overview
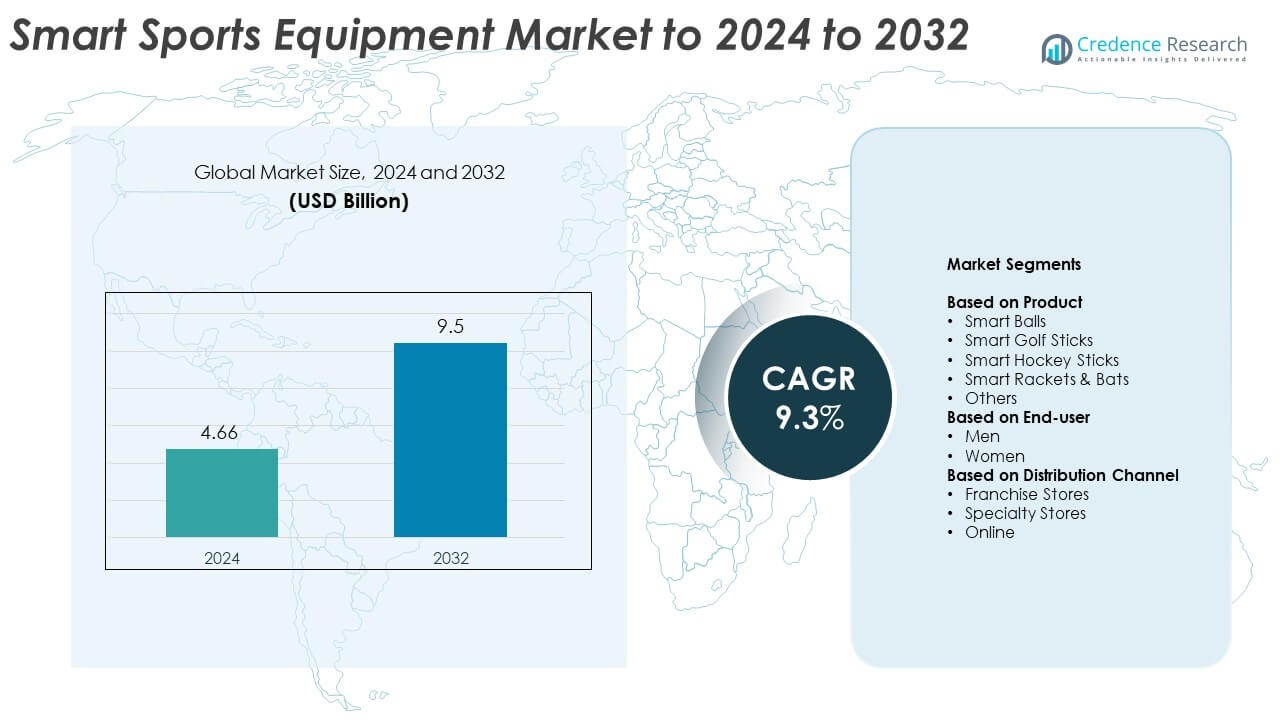
Smart Sports Equipment Market size was valued USD 4.66 billion in 2024 and is anticipated to reach USD 9.5 billion by 2032, at a CAGR of 9.3% during the forecast period.
| REPORT ATTRIBUTE |
DETAILS |
| Historical Period |
2020-2023 |
| Base Year |
2024 |
| Forecast Period |
2025-2032 |
| Smart Sports Equipment Market Size 2024 |
USD 4.66 Billion |
| Smart Sports Equipment Market , CAGR |
9.3% |
| Smart Sports Equipment Market Size 2032 |
USD 9.5 Billion |
The Smart Sports Equipment Market is shaped by major players such as Nike, Inc., Fitbit, Inc., WHOOP, Under Armour, Inc., Apple Fitness+, Garmin Ltd., Samsung Electronics Co., Ltd., triQUIP Sport, and Gridiron Technologies. These companies focus on innovation, integrating AI, IoT, and data analytics to enhance performance tracking and user engagement. Continuous product upgrades, strategic partnerships, and expansion into connected fitness ecosystems strengthen their market presence. North America dominated the global market in 2024, capturing around 36.8% share, driven by strong consumer adoption of smart fitness gear, advanced digital infrastructure, and rising participation in organized sports and wellness programs.
Access crucial information at unmatched prices!
Request your sample report today & start making informed decisions powered by Credence Research Inc.!
Download Sample
Market Insights
- The Smart Sports Equipment Market was valued at USD 4.66 billion in 2024 and is projected to reach USD 9.5 billion by 2032, growing at a CAGR of 9.3%.
- Rising health awareness, adoption of connected devices, and integration of IoT and AI technologies are driving market growth globally.
- Emerging trends include AI-based performance analytics, sustainable product materials, and increasing popularity of connected fitness ecosystems.
- The market is highly competitive, with players investing in R&D, wearable integration, and digital fitness platforms to enhance user experience and expand reach.
- North America led with 36.8% share in 2024, followed by Europe with 28.4% and Asia Pacific with 24.7%, while the smart balls segment dominated product categories with a 34.6% share.
Market Segmentation Analysis:
By Product
The smart balls segment dominated the Smart Sports Equipment Market in 2024, accounting for around 34.6% share. This leadership is driven by strong adoption in football, basketball, and tennis training. These balls feature embedded sensors that track spin rate, impact force, and trajectory, enhancing athlete performance analysis. Growing use by professional teams and sports academies fuels demand. Smart rackets and bats are also expanding rapidly, supported by rising integration of Bluetooth and motion-tracking technologies that help users monitor swing dynamics and improve precision.
- For instance, adidas’ Al Rihla World Cup ball has an IMU sensor that streams ball data 500 times per second to officials for precise kick-point detection.
By End-user
The men segment held the largest share of approximately 61.2% in 2024, owing to higher participation in organized sports and adoption of connected training tools. Male athletes and enthusiasts increasingly invest in advanced smart gear for real-time performance insights and fitness tracking. The women segment is expected to grow steadily as awareness of digital fitness devices rises, particularly in tennis, golf, and home workouts. Expanding promotional campaigns targeting female consumers also contribute to growing market penetration.
- For instance, Catapult reports adoption across 4,200+ teams in 40+ sports and 100 countries, showing broad uptake of pro male programs alongside expanding women’s tiers.
By Distribution Channel
The online segment dominated the market in 2024 with about 42.8% share, driven by the rapid growth of e-commerce platforms and direct-to-consumer models. Online retail enables customers to compare smart equipment features and access exclusive digital bundles. Increased smartphone penetration and brand partnerships with online sports stores have further strengthened this channel. Specialty stores continue to attract professional athletes and trainers seeking personalized product demonstrations, while franchise outlets benefit from brand credibility and in-store service support.
Key Growth Drivers
Integration of IoT and Sensor Technologies
The integration of IoT and advanced sensor technologies is a major growth driver in the Smart Sports Equipment Market. Connected devices provide athletes with detailed performance analytics, including speed, motion, and impact data. These insights help optimize training efficiency and injury prevention. Continuous innovation in Bluetooth-enabled tracking systems and AI-based coaching tools has increased product adoption among both professionals and amateurs. Manufacturers are focusing on developing lightweight, high-precision devices that enhance user experience and improve performance monitoring accuracy across multiple sports categories.
- For instance, Catapult Vector devices feature a 3D ±16G accelerometer sampled internally at 1 kHz (with data provided at 100 Hz), 10 Hz GPS, and Ultra-wideband (UWB) communications for real-time athlete tracking. The typical battery life is approximately 6 hours, though this can vary depending on the specific Vector model and usage.
Rising Health Awareness and Fitness Participation
Growing global awareness of physical wellness and active lifestyles continues to drive smart sports equipment demand. Consumers increasingly use connected devices to track metrics such as calories burned, distance covered, and technique improvement. The rise in home workouts and personalized training programs further accelerates market expansion. Fitness enthusiasts and athletes prefer data-driven solutions that deliver instant feedback and motivation. This shift toward technology-supported fitness engagement is transforming traditional sports equipment into digitally enhanced training tools.
- For instance, WHOOP expanded to 56 markets in 2024 and analyzed real-world health data sets, including a study of 132 members for GLP-1 effects.
Expansion of E-Commerce and Digital Sales Channels
Rapid digitalization and expansion of e-commerce platforms have significantly boosted smart sports equipment sales. Online retail allows consumers to compare features, read reviews, and purchase advanced products with ease. Brands leverage online channels to launch exclusive product lines and promote interactive fitness experiences. Subscription-based platforms and mobile apps offering training analytics also increase recurring engagement. The convenience of doorstep delivery and product customization options further enhance market accessibility, strengthening the online segment’s position as a key revenue contributor.
Key Trends & Opportunities
AI-Based Performance Analytics
The growing use of AI-driven analytics represents a key market trend. AI algorithms analyze real-time sports data, offering personalized coaching and predictive performance insights. These solutions assist in technique refinement and injury risk reduction. Integration with wearable technologies enables advanced monitoring of biometrics and movement precision. Companies are investing in AI-powered platforms that convert raw data into actionable feedback, enhancing athlete development and fan engagement. This trend supports the evolution of smart sports ecosystems built around data intelligence and continuous improvement.
- For instance, The Premier League’s semi-automated offside technology uses AI with up to 30 high-speed cameras (100 fps) and is designed to cut review time by approximately 30 seconds on average.
Sustainability and Eco-Friendly Product Design
Eco-friendly materials and sustainable manufacturing practices are emerging as strong opportunities in the market. Leading companies are shifting toward recyclable components, low-energy sensors, and biodegradable materials to reduce environmental impact. Consumers increasingly value sustainability, influencing purchase decisions in sports gear. Brands integrating green technology with digital innovation gain competitive advantages. The focus on energy-efficient product design also aligns with global sustainability goals, encouraging partnerships between sports equipment manufacturers and environmental technology providers.
- For instance, adidas states 99% of polyester used in 2024 was recycled, and its World Cup ball was the first made using only water-based inks and glues.
Key Challenges
High Product Cost and Limited Accessibility
High production costs remain a key challenge in the Smart Sports Equipment Market. Advanced sensors, connectivity modules, and AI integration increase overall pricing, limiting adoption in developing regions. Consumers in price-sensitive markets often opt for traditional equipment due to affordability concerns. Limited distribution networks and import duties further raise costs. To overcome this, manufacturers must adopt scalable production strategies and develop affordable smart variants without compromising performance quality or analytical accuracy.
Data Privacy and Connectivity Issues
Data privacy concerns and unstable connectivity hinder widespread adoption of connected sports devices. Smart equipment collects sensitive biometric and performance data, raising risks of misuse or unauthorized access. Inconsistent internet coverage, especially in remote areas, affects real-time analytics and cloud synchronization. Manufacturers must ensure robust data encryption, offline functionality, and compliance with global data protection standards. Strengthening cybersecurity measures and improving device interoperability remain critical to gaining consumer trust and expanding long-term market adoption.
Regional Analysis
North America
North America held the largest share of around 36.8% in the Smart Sports Equipment Market in 2024. The region’s dominance stems from strong consumer adoption of advanced fitness technologies and high awareness of performance analytics. Widespread use of connected sports gear in professional leagues and recreational activities supports steady growth. Major brands continue to innovate AI-enabled and IoT-based products targeting athletes and fitness enthusiasts. Increasing health consciousness, expanding e-commerce networks, and integration of smart training devices in schools and clubs further strengthen regional market performance.
Europe
Europe accounted for approximately 28.4% of the global market share in 2024, driven by rising participation in sports and fitness programs. The region benefits from supportive government initiatives promoting active lifestyles and digital transformation in sports infrastructure. Countries such as Germany, the U.K., and France show strong adoption of sensor-equipped sports equipment. Demand for smart golf sticks, connected rackets, and wearable tracking tools continues to rise among both professionals and hobbyists. The presence of established sports technology manufacturers and innovation-focused startups supports sustained regional expansion.
Asia Pacific
Asia Pacific captured about 24.7% of the market share in 2024 and is the fastest-growing regional market. Expanding urban populations, rising disposable incomes, and growing interest in fitness tracking devices drive regional demand. China, Japan, South Korea, and India are key growth hubs for connected sports products. Increasing smartphone penetration and investments in smart sports facilities encourage adoption across youth and professional sports segments. Regional players are launching cost-effective smart equipment, enhancing accessibility and accelerating digital sports adoption in emerging economies.
Latin America
Latin America held around 6.2% share of the Smart Sports Equipment Market in 2024, supported by growing awareness of digital fitness tools. Countries like Brazil, Mexico, and Argentina are experiencing increased consumer spending on connected sports products. The expansion of e-commerce platforms and rising engagement in football, tennis, and cycling contribute to market momentum. However, high product costs and limited local manufacturing constrain widespread adoption. Regional opportunities are expanding as international brands partner with local distributors to improve product availability and consumer outreach.
Middle East and Africa
The Middle East and Africa region accounted for approximately 3.9% share in 2024, with gradual adoption of connected sports technologies. The market is gaining traction in the UAE, Saudi Arabia, and South Africa, supported by government-led sports initiatives and fitness campaigns. Increasing investments in smart gyms and training centers drive regional interest in data-driven athletic solutions. Although adoption remains limited by high prices and connectivity challenges, rising youth participation in sports and growing awareness of smart fitness devices signal steady future growth.
Market Segmentations:
By Product
- Smart Balls
- Smart Golf Sticks
- Smart Hockey Sticks
- Smart Rackets & Bats
- Others
By End-user
By Distribution Channel
- Franchise Stores
- Specialty Stores
- Online
By Geography
- North America
- Europe
- Germany
- France
- U.K.
- Italy
- Spain
- Rest of Europe
- Asia Pacific
- China
- Japan
- India
- South Korea
- South-east Asia
- Rest of Asia Pacific
- Latin America
- Brazil
- Argentina
- Rest of Latin America
- Middle East & Africa
- GCC Countries
- South Africa
- Rest of the Middle East and Africa
Competitive Landscape
The Smart Sports Equipment Market is highly competitive, featuring prominent players such as Nike, Inc., Fitbit, Inc., WHOOP, Under Armour, Inc., Apple Fitness+, Garmin Ltd., Samsung Electronics Co., Ltd., triQUIP Sport, and Gridiron Technologies. The competition is shaped by continuous innovation in sensor technology, IoT connectivity, and data-driven fitness analytics. Companies are emphasizing product differentiation through integration of AI-based performance tracking, cloud connectivity, and personalized training solutions. Strategic collaborations with sports academies, fitness platforms, and digital health providers are strengthening brand visibility. Manufacturers are also focusing on sustainable materials, lightweight designs, and battery-efficient devices to enhance user experience. Intense competition drives consistent investment in research and development, enabling faster product upgrades and expanding digital ecosystems. Growing demand for smart wearable integration and connected training environments is encouraging companies to diversify product lines and adopt omnichannel sales strategies, particularly across online and subscription-based distribution models.
Shape Your Report to Specific Countries or Regions & Enjoy 30% Off!
Key Player Analysis
Recent Developments
- In 2025, WHOOP unveiled WHOOP 5.0 and the medical-grade WHOOP MG. The update included new hardware, a Healthspan feature to track biological age, ECG capabilities for AFib detection, and blood pressure monitoring insights.
- In 2025, Apple Fitness+ announced a collaboration with the fitness tracking app Strava. The integration allowed users to share detailed workout metrics from Fitness+ to their Strava community.
- In 2023, WHOOP introduced its new Stress Monitor feature, allowing it to measure daily stress levels.
Report Coverage
The research report offers an in-depth analysis based on Product, End-User, Distribution Channel and Geography. It details leading market players, providing an overview of their business, product offerings, investments, revenue streams, and key applications. Additionally, the report includes insights into the competitive environment, SWOT analysis, current market trends, as well as the primary drivers and constraints. Furthermore, it discusses various factors that have driven market expansion in recent years. The report also explores market dynamics, regulatory scenarios, and technological advancements that are shaping the industry. It assesses the impact of external factors and global economic changes on market growth. Lastly, it provides strategic recommendations for new entrants and established companies to navigate the complexities of the market.
Future Outlook
- Integration of AI and IoT will make sports equipment more accurate and user-responsive.
- Demand for personalized performance tracking tools will continue to rise among athletes.
- Manufacturers will focus on lightweight, durable, and eco-friendly smart materials.
- Wearable-connected devices will enhance data synchronization across multiple sports applications.
- Online sales and subscription-based fitness platforms will expand rapidly worldwide.
- Partnerships between sports brands and tech firms will boost innovation and accessibility.
- Real-time coaching and virtual training tools will gain strong consumer adoption.
- Emerging economies will witness faster growth due to increasing fitness awareness.
- Enhanced cybersecurity standards will improve trust in connected sports ecosystems.
- Smart equipment integration in schools and academies will promote long-term market growth.


