Market Overview:
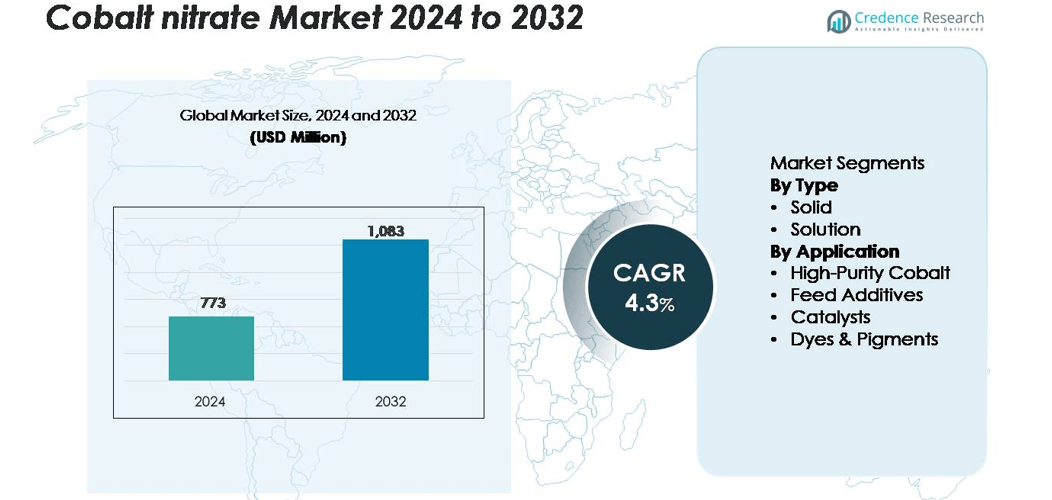
The global cobalt nitrate market was valued at USD 773 million in 2024 and is projected to reach USD 1,083 million by 2032, growing at a CAGR of 4.3% during the forecast period (2025–2032).
| REPORT ATTRIBUTE |
DETAILS |
| Historical Period |
2020-2023 |
| Base Year |
2024 |
| Forecast Period |
2025-2032 |
| Cobalt Nitrate Market Size 2024 |
USD 773 million |
| Cobalt Nitrate Market, CAGR |
4.3% |
| Cobalt Nitrate Market Size 2032 |
USD 1,083 million |
Leading players in the cobalt nitrate market include Umicore, American Elements, Merck KGaA, Thermo Fisher Scientific, Seido Chemical Co., Ltd., Zhejiang Huayou Cobalt Co., Ltd., and Nanjing Emperor Chemical Co., Ltd. These companies dominate through strong production networks, advanced refining capabilities, and long-term contracts with cobalt miners. They focus on sustainable sourcing, high-purity cobalt nitrate production, and vertical integration to serve energy storage, catalyst, and pigment industries. Asia-Pacific remains the leading region with a 54.5% share in 2024, driven by China’s large-scale refining operations and growing demand from the battery manufacturing sector, followed by Europe and North America.
Market Insights
- The global cobalt nitrate market was valued at USD 773 million in 2024 and is projected to reach USD 1,083 million by 2032, growing at a CAGR of 4.3% during 2025–2032.
- Demand is primarily driven by the rising use of high-purity cobalt nitrate in lithium-ion battery production and catalyst manufacturing across the chemical and petrochemical sectors.
- Market trends indicate increasing investments in sustainable cobalt sourcing and recycling technologies, along with technological advancements in high-purity refining processes.
- The competitive landscape is moderately consolidated, with major players such as Umicore, Merck KGaA, and Thermo Fisher Scientific focusing on refining capacity expansion and vertical integration.
- Asia-Pacific dominates with a 54.5% share, followed by Europe (22.8%) and North America (19.6%), while the solid type segment holds a 63.7% share, supported by strong industrial and catalyst applications.
Access crucial information at unmatched prices!
Request your sample report today & start making informed decisions powered by Credence Research Inc.!
Download Sample
Market Segmentation Analysis:
By Type
The solid segment dominated the cobalt nitrate market in 2024 with a 63.7% share. Its wide use in catalyst manufacturing, ceramics, and high-purity cobalt refining drives demand. Solid cobalt nitrate offers high thermal stability, long shelf life, and ease of transportation, making it the preferred form for industrial applications. The solution type segment is growing steadily due to its increasing adoption in electroplating, battery precursor synthesis, and laboratory reagents, where fast solubility and controlled concentration are required for precision chemical processing.
- For instance, Thermo Fisher Scientific supplies cobalt nitrate hexahydrate with a purity of 98%, designed for catalyst and ceramic formulations that require consistent particle size and controlled decomposition temperatures.
By Application
The catalysts segment held the largest market share of 42.1% in 2024, driven by its role in producing cobalt oxide catalysts for hydrogenation, desulfurization, and Fischer–Tropsch synthesis. Rising investments in chemical and fuel processing industries continue to strengthen this segment. High-purity cobalt applications follow closely, supported by growing demand from the battery manufacturing and superalloy sectors. Feed additives and dyes & pigments also contribute to market expansion, as cobalt nitrate enhances nutrient absorption in animal feed and provides vivid coloration in ceramics and glass production.
- For instance, Johnson Matthey, a major producer of catalysts, develops and licenses cobalt-based catalysts for the Fischer-Tropsch process, often in collaboration with partners like BP. These industrial catalysts commonly use cobalt nitrate as a precursor salt in their preparation (via methods like incipient wetness impregnation) and operate within typical Fischer-Tropsch temperature ranges, often around 200 to 240°C. Bottom of Form
Key Growth Drivers
Rising Demand for High-Purity Cobalt in Battery Manufacturing
The increasing adoption of electric vehicles and portable electronics has significantly boosted demand for high-purity cobalt nitrate, a key precursor in lithium-ion battery cathode production. Manufacturers prefer cobalt nitrate for its ability to produce uniform and high-performance cobalt oxides. As global battery production capacity expands, particularly in Asia-Pacific and Europe, the consumption of cobalt nitrate continues to grow. Major battery producers are investing in localized supply chains to ensure consistent quality and sustainability compliance. This driver remains central to market expansion, supported by growing renewable energy storage needs and technological advances in cathode chemistry.
- For instance, Umicore’s battery materials division operates a cathode active materials (CAM) plant in Nysa, Poland, and a cobalt refinery and precursor (pCAM) production facility in Kokkola, Finland. The Nysa plant is ramping up its production, with a goal to bring CAM capacity to 45 GWh (gigawatt hours) in the medium term, which is supplied with precursors from Kokkola and other sources.
Expanding Catalyst Applications in Chemical and Petrochemical Industries
Cobalt nitrate serves as a vital raw material in the production of catalysts used for FischerTropsch synthesis, hydrogenation, and desulfurization processes. The chemical and petrochemical sectors increasingly depend on cobalt-based catalysts to enhance conversion efficiency and reduce emissions. With the shift toward cleaner fuels and sustainable production methods, the use of cobalt nitrate in catalyst manufacturing has intensified. The growth of refinery capacity in developing regions, coupled with investments in synthetic fuel technologies, continues to strengthen demand. Ongoing innovation in catalyst design also reinforces cobalt nitrate’s relevance as a performance-enhancing precursor.
- For instance, Shell’s Pearl GTL plant in Qatar uses cobalt-based Fischer–Tropsch catalysts containing up to 20,000 kilograms of cobalt nitrate-derived active metal, enabling the conversion of natural gas into 140,000 barrels per day of liquid hydrocarbons.
Growing Use in Ceramic Pigments and Glass Coloring Applications
Cobalt nitrate’s role in creating stable, vivid blue hues in ceramics, glass, and enamel coatings makes it highly valuable in industrial and decorative applications. Expanding construction and consumer goods industries, particularly in emerging economies, are increasing the consumption of ceramic and glass products. Manufacturers favor cobalt nitrate for its superior pigment dispersion and resistance to fading at high temperatures. Additionally, advancements in eco-friendly pigment production and architectural coatings continue to drive its use. This segment benefits from rising aesthetic demands and the need for durable coloration in both commercial and household materials.
Key Trends & Opportunities
Shift Toward Sustainable and Recycled Cobalt Sourcing
The cobalt nitrate market is witnessing a significant shift toward sustainable production and recycling initiatives. Growing concerns over mining ethics and resource scarcity have prompted manufacturers to adopt recycled cobalt and closed-loop production systems. Companies are forming partnerships with battery recyclers to recover cobalt from spent cells, thereby reducing dependency on mined materials. This transition not only ensures environmental compliance but also stabilizes raw material prices. Sustainability certifications and traceability standards are becoming strategic differentiators, creating opportunities for players that align with responsible sourcing practices and circular economy principles.
- For instance, Umicore’s battery recycling facility in Hoboken, Belgium, processes up to 7,000 metric tons of lithium-ion batteries and battery production scrap each year, recovering approximately 1,500 tons of cobalt for reuse in cobalt nitrate and cathode precursor manufacturing.
Technological Advancements in Nitrate Processing and Purification
Continuous innovation in cobalt nitrate purification and synthesis processes is enhancing product quality and cost efficiency. Advanced crystallization and solvent extraction methods enable manufacturers to achieve high-purity grades suitable for batteries and catalysts. Automation and process optimization also minimize waste generation and improve consistency. These advancements are driving competitive differentiation in the market, especially among integrated producers targeting energy storage and chemical sectors. The adoption of precision manufacturing technologies is expected to open opportunities for high-performance applications and expand the use of cobalt nitrate across advanced materials industries.
- For instance, Merck KGaA produces cobalt nitrate under its EMSURE®/ACS analytical grade line with a certified purity of ≥99.0%, while trace metal impurities such as Fe, Cu, Pb, Mn, and Zn remain below 10–50 ppm (0.001%–0.005%), ensuring precise performance in catalyst and laboratory-grade applications.
Key Challenges
Volatility in Cobalt Supply and Price Fluctuations
Cobalt nitrate production is highly dependent on cobalt metal availability, which is subject to significant geopolitical and supply-chain risks. A large portion of global cobalt reserves is concentrated in regions with unstable political and regulatory environments, leading to fluctuating raw material prices. These variations impact manufacturing costs and profit margins for downstream producers. Additionally, growing competition for cobalt in the battery sector creates pressure on nitrate producers to secure reliable long-term supply. Price instability continues to challenge market predictability and investment planning across the value chain.
Environmental and Regulatory Constraints in Production
Cobalt nitrate manufacturing involves processes that generate nitrate effluents and emissions requiring strict environmental control. Increasingly stringent regulations on waste disposal and chemical handling across major economies, including the EU and North America, add compliance costs and operational complexity. Producers are compelled to invest in advanced filtration and recycling systems to meet sustainability standards. While these initiatives enhance environmental performance, they also elevate production costs, particularly for smaller manufacturers. Meeting global environmental norms without compromising competitiveness remains one of the major challenges restraining market growth.
Regional Analysis
North America
North America accounted for 19.6% of the cobalt nitrate market share in 2024, driven by strong demand from catalyst manufacturing, battery materials, and advanced ceramics sectors. The United States leads the region, supported by government incentives for electric vehicle production and sustainable material sourcing. Strategic partnerships between battery producers and mining firms enhance domestic cobalt processing capacity. Canada’s growing mining activities and investments in refining technologies further strengthen supply stability. The region’s focus on clean energy and high-performance materials continues to drive moderate but steady growth across key industrial applications.
Europe
Europe held 22.8% of the global cobalt nitrate market in 2024, fueled by expanding battery production and stringent environmental regulations. Germany, France, and the Netherlands lead in adopting cobalt-based catalysts and pigment materials. The European Union’s focus on recycling and sustainable cobalt sourcing promotes market stability and local production. Cobalt nitrate demand is further supported by research initiatives aimed at improving lithium-ion and solid-state battery technologies. Investments in green manufacturing and circular economy programs strengthen Europe’s position as a hub for high-purity cobalt compounds and eco-efficient industrial applications.
Asia-Pacific
Asia-Pacific dominated the cobalt nitrate market in 2024, holding 54.5% of the total share. China leads global production and consumption due to its large-scale battery and catalyst manufacturing base. Japan and South Korea follow closely, with strong demand from electronics and EV battery sectors. Rapid industrialization and government-backed renewable energy projects drive market expansion across the region. Major cobalt refiners and chemical companies continue to scale operations, focusing on high-purity and value-added applications. The region remains the central hub for cobalt nitrate trade, benefiting from integrated supply chains and lower production costs.
Latin America
Latin America captured 2.9% of the cobalt nitrate market share in 2024, supported by emerging mining and industrial sectors. Countries such as Brazil and Chile are developing domestic processing capabilities to capitalize on regional cobalt reserves. The region’s market growth is influenced by increasing demand for cobalt-based pigments and agricultural feed additives. Strategic investments in refining infrastructure and trade partnerships with Asia-Pacific producers are gradually improving market participation. Although the market remains small compared to other regions, future growth potential lies in expanding resource utilization and downstream chemical production.
Middle East & Africa
The Middle East & Africa accounted for 2.2% of the cobalt nitrate market share in 2024, primarily driven by resource availability in the African subcontinent. The Democratic Republic of Congo (DRC) continues to dominate cobalt mining, supplying a significant portion of the raw material for global nitrate production. Regional development projects and foreign investments are enhancing refining capacity and logistics networks. Demand for cobalt nitrate in catalysts and glass coloring applications is growing in Gulf countries. However, political instability and limited industrial infrastructure pose challenges to sustained regional growth.
Market Segmentations:
By Type
By Application
- High-Purity Cobalt
- Feed Additives
- Catalysts
- Dyes & Pigments
By Geography
- North America
- Europe
- Germany
- France
- U.K.
- Italy
- Spain
- Rest of Europe
- Asia Pacific
- China
- Japan
- India
- South Korea
- South-east Asia
- Rest of Asia Pacific
- Latin America
- Brazil
- Argentina
- Rest of Latin America
- Middle East & Africa
- GCC Countries
- South Africa
- Rest of the Middle East and Africa
Competitive Landscape
The cobalt nitrate market is moderately consolidated, with leading players focusing on expanding production capacity, enhancing product purity, and securing sustainable cobalt supply chains. Key companies such as Umicore, American Elements, Thermo Fisher Scientific, Merck KGaA, and Seido Chemical Co., Ltd. dominate the market through strong distribution networks and technological expertise. These firms prioritize strategic partnerships with mining companies and battery manufacturers to ensure raw material stability. Several producers are investing in advanced refining and recycling technologies to meet rising demand from battery and catalyst industries while complying with environmental regulations. Innovation in high-purity cobalt nitrate formulations, mergers, and long-term supply contracts continue to shape competition. Emerging players from China and South Korea are strengthening their market positions through cost-effective production and export expansion. The competitive focus remains on sustainable sourcing, consistent quality, and vertical integration across the cobalt chemical value chain.
Shape Your Report to Specific Countries or Regions & Enjoy 30% Off!
Key Player Analysis
Recent Developments
- In January 30, 2025, Eastman Chemical Company released its financial results for the fourth quarter and the full year 2024. Adjusted earnings per share grew by 23% in 2024. Eastman achieved its best quarter of the year on the heels of strong operating leverage, increased sales volume/mix, and commercial excellence, resulting in an adjusted EBIT margin that improved by 350 basis points year-over-year.
- In April 2024, Sigma-Aldrich (part of the Merck Group) still had cobalt (II) nitrate hexahydrate with at least 98% purity available for purchase. These products are useful in research & industry for cobalt-containing ceramic materials, fuel cell catalysts, and battery cathodes. They contribute toward advancements in catalysis and energy storage.
- In March 2024, Thermo Fisher Scientific was still selling high-purity cobalt (II) nitrate hexahydrate. Applications involve the development of invisible inks, cobalt pigments, battery materials, and porcelain decorations. Their product supports both newcomers and current practitioners in industry & research, for instance, development & production of catalysts, while also enabling novel ideas in materials science, energy storage, or other emerging areas.
Report Coverage
The research report offers an in-depth analysis based on Type, Application and Geography. It details leading market players, providing an overview of their business, product offerings, investments, revenue streams, and key applications. Additionally, the report includes insights into the competitive environment, SWOT analysis, current market trends, as well as the primary drivers and constraints. Furthermore, it discusses various factors that have driven market expansion in recent years. The report also explores market dynamics, regulatory scenarios, and technological advancements that are shaping the industry. It assesses the impact of external factors and global economic changes on market growth. Lastly, it provides strategic recommendations for new entrants and established companies to navigate the complexities of the market.
Future Outlook
- Demand for cobalt nitrate will continue rising with expanding electric vehicle battery production.
- Manufacturers will focus on high-purity grades to meet advanced battery and catalyst requirements.
- Recycling and sustainable cobalt sourcing will become key priorities for producers.
- Technological advancements in nitrate refining will improve process efficiency and product consistency.
- Growing use of cobalt nitrate in glass and ceramic pigments will support steady industrial demand.
- Strategic collaborations between mining and chemical firms will ensure stable raw material supply.
- Asia-Pacific will maintain dominance, driven by strong industrial and energy storage sectors.
- Europe will see growth from sustainability-focused manufacturing and recycling initiatives.
- Regulatory pressures will encourage cleaner production technologies and waste reduction.
- Global competition will intensify as emerging players invest in cost-efficient and scalable production facilities.


