Market Overview
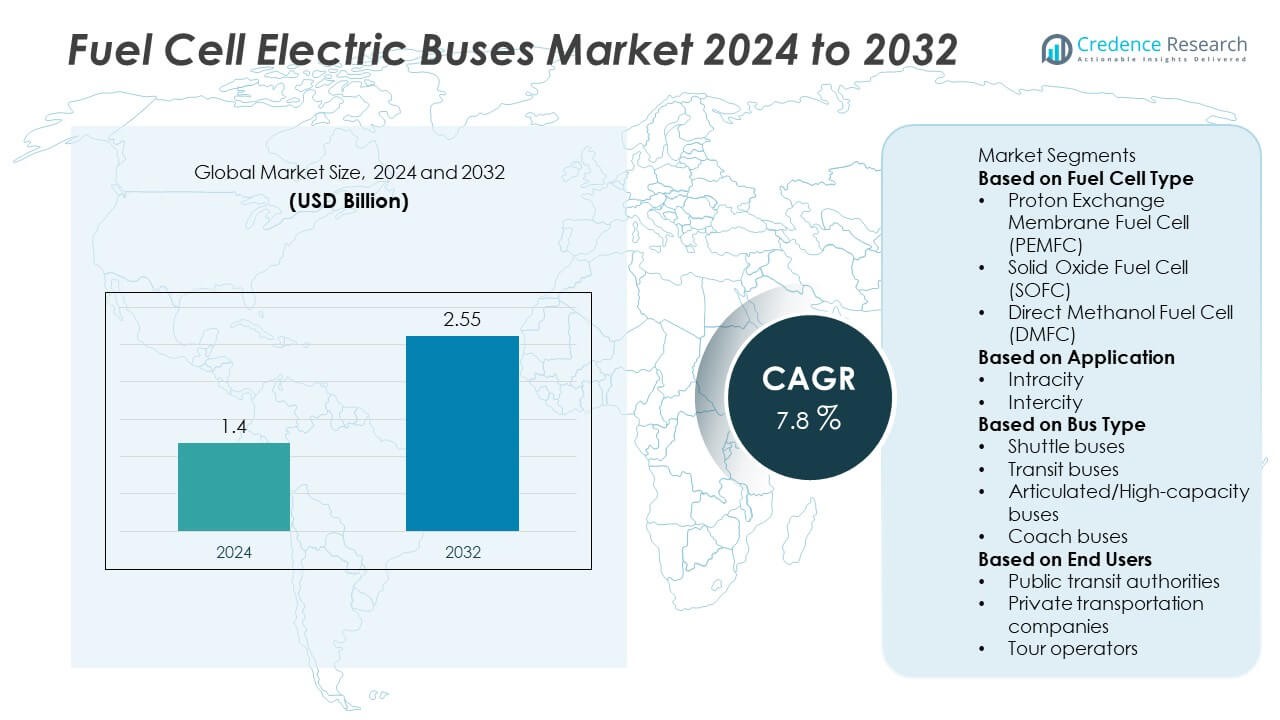
The Fuel Cell Electric Buses market was valued at USD 1.4 billion in 2024 and is projected to reach USD 2.55 billion by 2032, registering a CAGR of 7.8% during the forecast period.
| REPORT ATTRIBUTE |
DETAILS |
| Historical Period |
2020-2023 |
| Base Year |
2024 |
| Forecast Period |
2025-2032 |
| Fuel Cell Electric Buses Market Size 2024 |
USD 1.4 Billion |
| Fuel Cell Electric Buses Market, CAGR |
7.8% |
| Fuel Cell Electric Buses Market Size 2032 |
USD 2.55 Billion |
Top players in the Fuel Cell Electric Buses market include Solaris Bus & Coach, Van Hool, Hyundai, Proterra, Wrightbus, New Flyer, Gillig, Toyota, Ballard Power Systems, and Hydrogenics, each advancing competitiveness through improved fuel cell efficiency, longer driving ranges, and integrated hydrogen storage technologies. These companies expand partnerships with transit agencies and hydrogen suppliers to support large-scale fleet deployment. Regionally, North America leads the market with a 34% share, driven by strong policy support and expanding hydrogen infrastructure, while Europe follows with a 31% share, supported by strict emission regulations and coordinated clean mobility initiatives.
Market Insights
- The Fuel Cell Electric Buses market reached USD 1.4 billion in 2024 and will grow at a 7.8% CAGR through 2032, supported by rising demand for zero-emission public transport.
- Strong market growth is driven by government incentives, fleet electrification programs, and adoption of PEMFC technology, which held a 68% share due to high efficiency and suitability for urban transit.
- Key trends include expansion of hydrogen corridors, integration of green hydrogen supply, and rising deployment of long-range and high-capacity fuel cell buses.
- Competition intensifies as leading manufacturers invest in advanced fuel cell stacks, scalable bus platforms, and partnerships with hydrogen suppliers to support large fleet rollouts.
- North America leads with a 34% share, followed by Europe at 31% and Asia Pacific at 27%, while intracity operations remain dominant with a 59% segment share driven by urban clean-mobility initiatives.
Access crucial information at unmatched prices!
Request your sample report today & start making informed decisions powered by Credence Research Inc.!
Download Sample
Market Segmentation Analysis:
By Fuel Cell Type
Proton Exchange Membrane Fuel Cell (PEMFC) dominated the market with a 68% share in 2024, driven by its high power density, rapid start-up capability, and suitability for variable driving demands in urban and intercity routes. Transit agencies prefer PEMFC systems due to their lower operating temperatures and strong durability in frequent-stop conditions. Solid Oxide Fuel Cells (SOFC) accounted for a 21% share, supported by high efficiency in long-duration operations, while Direct Methanol Fuel Cells (DMFC) held an 11% share, gaining attention in small-capacity or auxiliary power applications.
- For instance, Ballard Power Systems achieved a stack durability milestone of 35,000 operational hours in its FCmove-HD modules, demonstrating long-life performance under real transit duty cycles. The FCmove-HD system also delivers a rated output of 70 kW and supports over 95% system availability across deployed fleets.
By Application
Intracity operations led the Fuel Cell Electric Buses market with a 59% share in 2024, supported by strong government deployment programs and the need to reduce emissions in congested urban centers. Cities adopt fuel cell buses for their long range, fast refueling, and ability to operate on fixed daily schedules without battery-charging downtime. Intercity services accounted for a 41% share, driven by rising investments in hydrogen corridors and demand for longer-range, zero-emission mobility across regional routes.
- For instance, the Wrightbus hydrogen double-deck fleet (across various cities including London) has collectively covered millions of miles in service, and as of early 2025, the hydrogen fleet had traveled over 2 million operational miles.
By Bus Type
Transit buses dominated the market with a 52% share in 2024, driven by widespread fleet electrification initiatives and strong public sector funding for zero-emission mass transport. These buses benefit from proven PEMFC integration, long operational life, and compatibility with daily urban routes. Articulated or high-capacity buses held a 24% share, supported by growing adoption in major cities requiring high passenger throughput. Shuttle buses accounted for 15%, while coach buses represented 9%, reflecting emerging long-range deployments enabled by expanding hydrogen refueling networks.
 KEY GROWTH DRIVERS
Government Support for Zero-Emission Public Transport
Governments across major economies invest heavily in fuel cell electric buses to cut urban pollution and meet climate targets. Subsidies, tax incentives, and national hydrogen roadmaps accelerate adoption among transit agencies. Public transport authorities prefer fuel cell buses due to long driving range, fast refueling, and reliable operations across dense networks. Large-scale fleet replacement plans and clean mobility mandates further strengthen deployment. This strong policy backing remains one of the most influential drivers shaping long-term growth in the fuel cell electric buses market.
- For instance, the U.S. Federal Transit Administration funded 25 hydrogen buses for AC Transit under its Low-No program, supporting deployments using Ballard FCmove-HD modules rated at 70 kW each. AC Transit’s fleet recorded more than 4.5 million cumulative kilometers powered by hydrogen fuel cell systems.
Expansion of Hydrogen Refueling Infrastructure
Rapid development of hydrogen refueling stations supports wider adoption of fuel cell buses by reducing operational limitations. Investments in hydrogen corridors across urban and intercity routes enhance route flexibility and support long-distance mobility. Public-private partnerships accelerate station deployment, making hydrogen more accessible for large fleets. As fueling networks expand, transit operators gain confidence in fleet scalability and operational stability. This infrastructure growth creates a strong foundation for long-term fleet electrification through fuel cell technology.
- For instance, Air Liquide commissioned a high-capacity station in Fos-sur-Mer capable of dispensing 1,000 kg of hydrogen per day, supporting bus and truck fleets with rapid refueling times. The station is part of the HyAMMED project and is designed to refuel commercial vehicles for up to 800 km of autonomy.
Technological Advancements in Fuel Cell Systems
Improved fuel cell durability, higher power density, and reduced system costs strengthen the market outlook for fuel cell electric buses. Advancements in PEMFC stacks, thermal management, and hydrogen storage enhance vehicle performance in both urban and intercity conditions. Manufacturers focus on longer stack life and better energy efficiency to lower operational expenses for transit authorities. Integration of lightweight materials and enhanced regenerative braking also supports improved range. These technological improvements boost market acceptance across diverse bus applications.
KEY TRENDS & OPPORTUNITIES
Integration of Green Hydrogen Supply Chains
Growing production of green hydrogen creates major opportunities for fuel cell bus deployment. Countries invest in renewable-powered electrolysis to supply cleaner hydrogen for transport fleets. Transit agencies benefit from reduced carbon footprint and compliance with sustainability goals. As green hydrogen prices decline, total operating costs for fuel cell buses become more competitive. This alignment between renewable energy and transport decarbonization accelerates large-scale adoption across urban networks.
- For instance, Siemens Energy and Air Liquide developed a proton exchange membrane electrolyzer that delivers 20 MW capacity and produces up to 8.2 tons of green hydrogen per day. The system supports direct supply for mobility fleets through high-purity output reaching 99.999% hydrogen quality.
Growth of Large-Scale Fleet Deployments
Cities worldwide are transitioning from pilot programs to full-scale fuel cell bus fleets. Public transport operators deploy multi-hundred–unit fleets supported by long-term procurement contracts and integrated hydrogen infrastructure. Larger fleet rollouts reduce cost per unit and encourage wider adoption across regions. Standardization of components and maintenance practices also enhances operational predictability. This shift toward commercial-scale deployment marks a significant opportunity for suppliers, integrators, and hydrogen producers.
- For instance, China’s Foshan transit network deployed more than 300 hydrogen buses built by Yutong, each powered by a 100 kW fuel cell stack. The fleet recorded over 10 million cumulative kilometers in active operation.
Rising Adoption in Long-Range and High-Capacity Transit
Fuel cell buses gain traction in long-range and high-capacity operations where battery-electric buses face range and charging limitations. Their fast refueling, consistent performance in varied climates, and ability to serve high-demand routes create strong opportunities in intercity and articulated bus segments. Regions developing intercity hydrogen corridors further expand this market space. This trend supports broader use of fuel cell technology beyond conventional city transit applications.
KEY CHALLENGES
High Initial Cost of Fuel Cell Buses and Infrastructure
Fuel cell electric buses remain costlier than diesel or battery-electric alternatives due to expensive fuel cell stacks, hydrogen tanks, and integrated systems. Establishing hydrogen refueling infrastructure also requires significant investment. Transit authorities often depend on government subsidies to offset procurement costs. These high capital expenses slow adoption, particularly in developing regions lacking funding support. Cost reduction through scale and technological improvements remains essential to broaden market uptake.
Limited Hydrogen Availability and Supply Chain Constraints
Hydrogen supply remains uneven across regions, limiting fuel cell bus deployment in markets with poor production or distribution capacity. Dependence on imported hydrogen or small-scale production increases operating costs and reduces reliability. Supply chain gaps in electrolyzers, compressors, and hydrogen transport equipment further restrict expansion. Without stable hydrogen availability, transit agencies hesitate to commit to large fleets. Building resilient and scalable hydrogen supply chains is critical for long-term growth.
Regional Analysis
North America
North America held a 34% share of the Fuel Cell Electric Buses market in 2024, driven by strong federal and state incentives supporting hydrogen mobility and zero-emission public transport. The United States leads regional deployment with large pilot fleets and increasing investment in hydrogen corridors across major states. Transit agencies adopt fuel cell buses for long routes, fast refueling, and reliable operation in varied climates. Growth in green hydrogen production and partnerships between bus manufacturers and energy companies further strengthen regional expansion. Canada supports adoption through clean transport policies and urban fleet modernization programs.
Europe
Europe accounted for a 31% share in 2024, supported by strict emission regulations, extensive hydrogen strategies, and strong government funding for clean public transportation. Countries such as Germany, the Netherlands, and the United Kingdom lead deployment through large-scale procurement programs and well-established hydrogen refueling networks. The region benefits from coordinated EU initiatives promoting hydrogen mobility and decarbonization. Fuel cell buses gain traction due to long driving range and suitability for both urban and intercity transport. Strong collaboration between bus manufacturers, hydrogen producers, and technology suppliers accelerates fleet expansion across the region.
Asia Pacific
Asia Pacific captured a 27% share of the market in 2024, driven by rapid urbanization, strong government support, and large-scale hydrogen technology development. China leads deployment with national policies promoting hydrogen fuel cell vehicles and significant investment in refueling stations. South Korea and Japan expand fleets through long-term zero-emission transport goals and strong fuel cell manufacturing ecosystems. The region adopts fuel cell buses for high-density routes requiring long range and short downtime. Advancements in hydrogen storage, domestic fuel cell production, and cost reduction initiatives further enhance regional growth.
Latin America
Latin America held a 5% share in 2024, supported by early pilot deployments and rising interest in zero-emission urban transport. Countries such as Brazil and Chile explore hydrogen mobility as part of broader decarbonization strategies. Transit agencies evaluate fuel cell buses for long-distance and high-altitude routes where battery-electric alternatives face limitations. Government-backed renewable hydrogen projects, especially in Chile, create opportunities for future fleet expansion. Although adoption remains in early stages, growing environmental ambitions and international partnerships support gradual market development across the region.
Middle East & Africa
The Middle East & Africa region recorded a 3% share in 2024, driven by increasing investment in hydrogen production and early clean transport initiatives. Countries like the UAE and Saudi Arabia lead adoption through national hydrogen roadmaps and large renewable energy projects. Fuel cell buses gain attention for their suitability in hot climates and long-distance routes. Africa remains in the early adoption phase but benefits from rising interest in sustainable mobility and international funding for clean transport. Development of green hydrogen hubs across the region supports long-term potential for fuel cell bus deployment.
Market Segmentations:
By Fuel Cell Type
- Proton Exchange Membrane Fuel Cell (PEMFC)
- Solid Oxide Fuel Cell (SOFC)
- Direct Methanol Fuel Cell (DMFC)
By Application
By Bus Type
- Shuttle buses
- Transit buses
- Articulated/High-capacity buses
- Coach buses
By End Users
- Public transit authorities
- Private transportation companies
- Tour operators
By Geography
- North America
- Europe
- Germany
- France
- U.K.
- Italy
- Spain
- Rest of Europe
- Asia Pacific
- China
- Japan
- India
- South Korea
- South-east Asia
- Rest of Asia Pacific
- Latin America
- Brazil
- Argentina
- Rest of Latin America
- Middle East & Africa
- GCC Countries
- South Africa
- Rest of the Middle East and Africa
Competitive Landscape
The competitive landscape in the Fuel Cell Electric Buses market is shaped by major players such as Solaris Bus & Coach, Van Hool, Hyundai, Proterra, Wrightbus, New Flyer, Gillig, Toyota, Ballard Power Systems, and Hydrogenics. These companies strengthen their positions through advancements in fuel cell efficiency, extended driving range, and integration of lightweight materials to enhance overall vehicle performance. Many manufacturers focus on PEMFC technologies, improved hydrogen storage systems, and scalable bus platforms suitable for urban and intercity operations. Strategic partnerships with hydrogen producers, infrastructure developers, and transit agencies support large-scale fleet deployments. Companies also invest in cost reduction, supply chain localization, and long-term service programs to improve operational reliability. With growing demand for zero-emission public transport, competition intensifies as manufacturers expand product lines, accelerate technology development, and secure long-term procurement contracts across global markets.
Key Player Analysis
- Solaris Bus & Coach
- Van Hool
- Hyundai
- Proterra
- Wrightbus
- New Flyer
- Gillig
- Toyota
- Ballard Power Systems
- Hydrogenics
Recent Developments
- In August 2025, Hyundai Motor Group unveiled the 2026 “Universe” hydrogen-electric bus with up to 960 km range.
- In July 2025, New Flyer launched an extended-range module for its Xcelsior CHARGE FC hydrogen fuel-cell bus, adding 17.5 kg of hydrogen tank capacity.
- In February 2025, Wrightbus unveiled its upgraded StreetDeck Hydroliner Gen 2.0 hydrogen double-deck bus.
Shape Your Report to Specific Countries or Regions & Enjoy 30% Off!
Report Coverage
The research report offers an in-depth analysis based on Fuel Cell Type, Application, Bus Type, End Users and Geography. It details leading market players, providing an overview of their business, product offerings, investments, revenue streams, and key applications. Additionally, the report includes insights into the competitive environment, SWOT analysis, current market trends, as well as the primary drivers and constraints. Furthermore, it discusses various factors that have driven market expansion in recent years. The report also explores market dynamics, regulatory scenarios, and technological advancements that are shaping the industry. It assesses the impact of external factors and global economic changes on market growth. Lastly, it provides strategic recommendations for new entrants and established companies to navigate the complexities of the market.
Future Outlook
- Global adoption of fuel cell buses will grow as cities strengthen zero-emission transport goals.
- Investment in hydrogen refueling corridors will expand to support larger regional fleets.
- Technological advances will improve fuel cell durability, power density, and operational efficiency.
- Green hydrogen production will increase, reducing operating costs for fuel cell buses.
- Fleet electrification programs will shift from pilot projects to full-scale multi-city deployments.
- High-capacity and long-range bus segments will see stronger demand in intercity and express routes.
- Manufacturers will develop lighter bus platforms to improve performance and extend driving range.
- Public-private partnerships will accelerate infrastructure rollout and supply chain development.
- Emerging markets in Asia Pacific and Latin America will adopt fuel cell buses as clean mobility awareness grows.
- Integration of digital fleet management systems will enhance operational reliability and reduce maintenance downtime.


