Market Overview
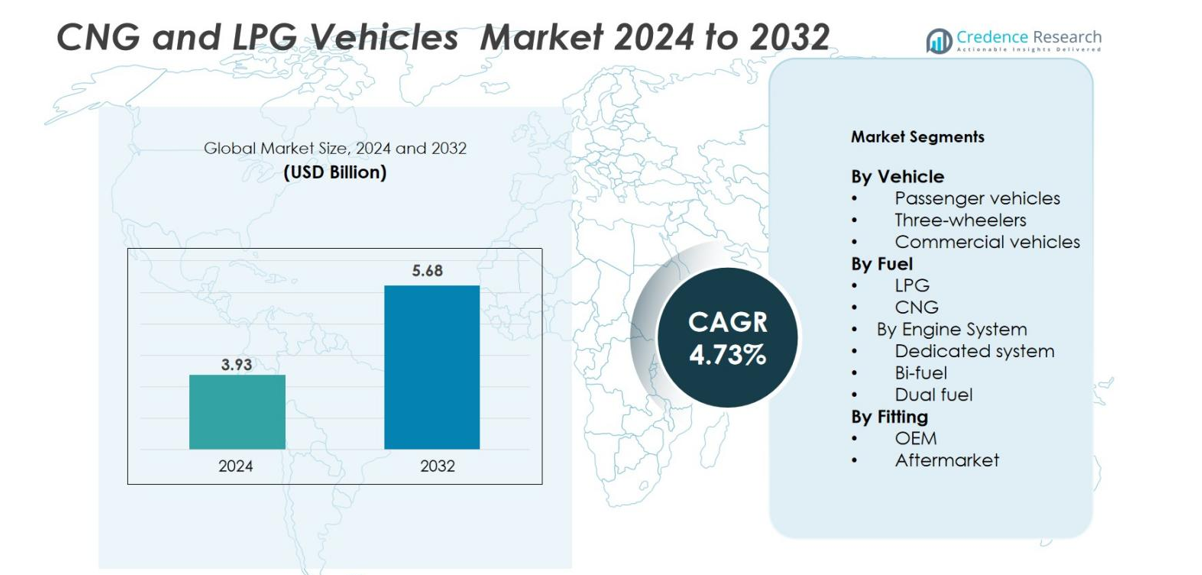
CNG and LPG Vehicles market size was valued at USD 3.93 Billion in 2024 and is anticipated to reach USD 5.68 Billion by 2032, at a CAGR of 4.73% during the forecast period.
| REPORT ATTRIBUTE |
DETAILS |
| Historical Period |
2020-2023 |
| Base Year |
2024 |
| Forecast Period |
2025-2032 |
| CNG and LPG Vehicles Market Size 2024 |
USD 3.93 Billion |
| CNG and LPG Vehicles Market, CAGR |
4.73% |
| CNG and LPG Vehicles Market Size 2032 |
USD 5.68 Billion |
The CNG and LPG Vehicles market is shaped by strong competition among global automakers. Leading companies include Toyota, Hyundai Motor Company, Tata Motors, Mahindra & Mahindra, Honda, Volkswagen Group, Ford Motor Company, General Motors, IVECO, and MAN SE. These manufacturers expand CNG and LPG portfolios across passenger cars, three-wheelers, and light commercial fleets to meet emission norms and reduce fuel cost for users. Asia-Pacific leads the market with over 42% share, driven by large fleet conversions, policy incentives, and a fast-growing refueling network across India, China, Pakistan, and Thailand. Europe and North America follow with rising adoption in urban mobility and public transport applications.
Market Insights
- The CNG and LPG Vehicles market was valued at USD 3.93 Billion in 2024 and is projected to reach USD 5.68 Billion by 2032 at a CAGR of 4.73%.
- Lower fuel cost, clean emissions, and government incentives drive high adoption across passenger vehicles, three-wheelers, and commercial fleets, with passenger cars holding 55% share of total demand.
- Bi-fuel engines lead the engine system segment with 47.8% share, supported by flexible fuel usage and wider OEM availability; fleet conversion and small urban mobility solutions strengthen market trends.
- Global competition includes Toyota, Hyundai Motor Company, Tata Motors, Mahindra & Mahindra, Honda, Volkswagen Group, Ford Motor Company, IVECO, MAN SE, and General Motors, each expanding factory-fitted models and safer tank systems.
- Asia-Pacific leads with over 42% regional share due to large conversion programs and growing infrastructure, followed by North America at 28% and Europe at 23%, while Latin America and Middle East & Africa maintain smaller shares.
Access crucial information at unmatched prices!
Request your sample report today & start making informed decisions powered by Credence Research Inc.!
Download Sample
Market Segmentation Analysis
By Vehicle
Passenger vehicles dominate this market with about 55% share in 2024. The segment leads due to strong demand for cost-efficient and low-emission personal mobility across urban regions. Automakers continue to expand factory-fitted CNG and LPG portfolios, making adoption easier for buyers and fleet operators. Three-wheelers and commercial vehicles show steady usage for shared mobility and cargo transport, but passenger cars retain clear leadership as fuel savings and environmental compliance drive purchase decisions.
- For instance, Tata Motors launched the Nexon iCNG in September 2024, featuring two 30-litre cylinders, expanding its factory-fitted CNG portfolio to facilitate easier adoption for buyers and fleet operators.
By Fuel
CNG holds the largest share at nearly 66% of the market in 2024. The segment benefits from lower fuel pricing, wider pipeline and refilling infrastructure, and stronger policy incentives that promote cleaner transportation. CNG also offers favourable running costs for both private and commercial users. LPG remains relevant in regions with established autogas networks, but CNG adoption continues to grow faster as more fleets, taxis, and personal vehicles switch from conventional fuels to reduce emissions.
- For instance, LA Metro adopted 295 natural gas buses equipped with Near Zero engines from Cummins Westport, using renewable natural gas to lower emissions while reducing fuel costs.
By Engine System
Bi-fuel systems lead the engine-type segment with roughly 47.8% share. The ability to switch between gas and conventional fuel reduces concern about range limitations and supports wider usage in passenger cars and small commercial fleets. Manufacturers prefer bi-fuel platforms as they simplify conversion and appeal to first-time buyers shifting from petrol. Dedicated systems follow due to better combustion efficiency and lower emissions, while dual-fuel engines remain limited to specific heavy-duty applications requiring higher torque and long-distance performance.
Market Overview
Lower Operating Cost and Fuel Savings
The CNG and LPG vehicles market grows because owners expect lower running cost. CNG and LPG prices stay below petrol and diesel in many regions. Fleet operators cut daily expenses and improve profit. Taxi services and ride-hailing groups shift to gas vehicles to reduce fuel bills. Many city commuters also pick small CNG cars for cheap daily travel. Governments promote gas as a cleaner and cheaper mobility option. Public agencies add CNG buses to reduce fuel spending. These changes build strong market demand. Fuel savings encourage both private and commercial users. The cost advantage remains the strongest reason for adoption. As fuel prices rise, buyers continue to pick gas models. The promise of lower lifetime cost makes the market expand at a steady pace.
- For instance, the Dragon’s Gas City Bus Series employs advanced engine management systems to maximize fuel efficiency, offering operational benefits like quieter rides and reduced fuel consumption for urban transit.
Strong Policy Support and Emission Targets
National and local governments support CNG and LPG to reduce air pollution. Many cities face strict emission rules for passenger and commercial fleets. CNG burns cleaner and releases fewer harmful gases. Policymakers promote it as a bridge fuel toward green mobility. Several countries offer tax reduction, purchase rebates, or permit benefits for gas vehicles. Public transport agencies also receive funds to modernize old fleets with CNG buses. Safety standards for tanks and kits also improve user confidence. Authorities encourage retrofit programs for older petrol vehicles. These actions open a larger market for fuel kits and factory-fitted models. The regulatory push drives long-term market stability. Strong compliance pressure helps the gas ecosystem grow.
- For instance, Delhi mandated conversion of all public transport vehicles to CNG in the late 1990s, leading to a drastic drop in particulate matter and black smoke, improving city air quality and public health outcomes.
Growth of Refueling Infrastructure and OEM Participation
Refueling networks expand across major highways and cities. New CNG stations reduce range anxiety for buyers. Wider coverage makes long-distance travel possible for transport fleets. Many oil and gas companies continue to build fueling pumps near logistics hubs. Automakers release new factory-fitted CNG and LPG models for passenger and commercial use. After-sales support also improves, making maintenance easier. OEMs promote safer tanks and improved engines with better mileage. These factors increase customer trust. Logistics firms add CNG trucks and vans for short-haul delivery. A stable infrastructure and broad model range strengthen adoption. The ecosystem becomes more reliable and user-friendly each year.
Key Trends & Opportunities
Rising Fleet Conversion and Shared Mobility Adoption
Fleet operators use CNG and LPG to reduce daily travel cost. Ride-hailing taxis, school vans, and courier fleets adopt gas vehicles for cheaper mileage. Retrofits remain popular in countries with low-cost conversion services. Shared mobility companies prefer CNG cars for city trips with frequent stops. Public transport departments replace older diesel buses with CNG buses. These orders create large market volume. Export demand rises as developing nations modernize fleets. Faster fleet conversion brings steady sales of tanks, kits, and engines. Mobility platforms also track fuel use and emissions, helping companies save more. This shift remains one of the strongest opportunities for growth.
- For instance, logistics giant UPS integrated the first of several 15-liter CNG trucks into its fleet in early 2024, underscoring the logistics sector’s commitment to cost-efficient fuel use and sustainability goals. These specific trucks use the new Cummins X15N natural gas engine, which offers a 10% improvement in fuel economy compared to previous models and meets strict low-emissions standards.
Growing Demand for Small Urban Mobility Solutions
Urban congestion and parking issues support growth of small CNG and LPG cars and three-wheelers. Compact vehicles reduce running cost and move easily in crowded streets. Delivery companies use three-wheelers for last-mile supply. Small cars attract budget buyers and young drivers in emerging markets. Many models now include better safety features and infotainment systems. Natural gas engines give low noise and low emission benefit for city zones. Micro-taxis and auto-rickshaws also support daily public transport at low fare. The demand for clean and affordable city mobility creates strong long-term opportunity.
- For instance, delivery companies like Borzo use electric three-wheelers in Mumbai for last-mile deliveries, leveraging their compact size for easier navigation in crowded streets and cost-effective operations with low electricity consumption, helping reduce running costs and emissions in urban logistics.
Technology Upgrades in Engine and Storage Systems
OEMs improve combustion design to increase mileage and reduce engine wear. Lightweight and high-strength tanks improve safety and storage capacity. Smart fuel sensors measure pressure and leak detection in real time. Bi-fuel systems allow smooth change between petrol and gas. These upgrades make gas vehicles more convenient and reliable. Better thermal control also reduces maintenance needs. New designs help engines deliver better power with cleaner exhaust. Technology improvements raise customer confidence and boost adoption.
Key Challenges
Limited Infrastructure in Smaller Cities and Rural Areas
Many towns lack enough CNG and LPG refueling stations. Drivers may travel long distances to refuel. This reduces convenience and slows adoption. Private buyers avoid conversion when fuel access is uncertain. Commercial fleets also require dependable supply for daily travel. Infrastructure projects need high investment and long setup time. Slow growth of stations limits market expansion outside metro zones. Until networks reach smaller regions, full potential remains untapped.
Safety Concerns and High Initial Conversion Cost
Buyers worry about tank safety and storage pressure. Low-quality kits create risk if not installed correctly. Routine inspection becomes important, but many users skip maintenance. High initial cost also discourages new buyers. Factory-fitted models cost more than basic petrol variants. Many customers delay purchases due to budget limits. Safety awareness and quality standards continue to rise, but concerns still exist. Clear regulations and certified installers are needed to improve trust.
Regional Analysis
North America
North America holds nearly 28% share of the CNG and LPG vehicles market in 2024. Demand increases as fleet operators adopt cleaner fuels to meet emission rules and cut operating cost. The United States leads with strong usage in commercial fleets, school buses, and municipal transport. Public agencies support CNG bus adoption through funding programs and fleet modernization plans. Growing natural gas availability and refinery capacity help secure long-term fuel supply. However, adoption remains concentrated in selected states where infrastructure density is higher. Expansion of refueling stations continues, supporting steady market growth across logistics and public transport applications.
Europe
Europe accounts for roughly 23% share of the market, driven by strict emission laws and urban low-emission zones. Italy, Poland, and Turkey show high adoption of CNG and LPG passenger cars and taxis due to well-developed autogas and methane networks. OEMs offer a wide range of factory-fitted bi-fuel models, strengthening buyer confidence. Government incentives and tax reductions further support market growth. However, some Western European countries prioritize electric mobility, which limits long-term expansion. Despite this, Eastern and Central Europe maintain strong demand thanks to cost-efficient fuel pricing and established distribution networks.
Asia-Pacific
Asia-Pacific dominates the CNG and LPG vehicles market with over 42% share in 2024. India, China, Pakistan, and Thailand witness rapid adoption due to rising fuel prices and strict pollution norms. Governments support conversion programs, public transport upgrades, and expansion of filling stations. Three-wheelers, micro-taxis, and small passenger cars record high sales due to low operating cost and dense urban traffic. OEMs increase local production of factory-fitted CNG models. Infrastructure expansion and strong policy support make Asia-Pacific the fastest-growing region, with commercial fleets and ride-hailing companies leading large-scale deployment.
Latin America
Latin America captures nearly 4% share of the global market. Argentina, Brazil, and Colombia lead due to long-standing autogas usage and affordable conversion cost. Many taxi fleets and delivery vehicles run on CNG due to lower fuel expense. Government incentives encourage conversion of older petrol cars and promote local kit manufacturing. Infrastructure remains developed in urban areas but limited in remote regions. Growth stays moderate as economic fluctuations affect vehicle sales. However, expanding fleet modernization and gas availability keep the market stable.
Middle East & Africa
The Middle East & Africa region holds about 3% share of the market. Adoption grows in Nigeria, Egypt, the UAE, and South Africa as governments diversify transport fuels and cut dependence on petrol. Egypt and Nigeria invest in conversion programs and new CNG stations for buses, taxis, and government fleets. Lower emissions and fuel savings strengthen demand in major cities. However, limited infrastructure in rural areas slows wider acceptance. Growing investments and refinery capacity expansion are expected to raise market share in the coming years.
Market Segmentations
By Vehicle
- Passenger vehicles
- Three-wheelers
- Commercial vehicles
By Fuel
By Engine System
- Dedicated system
- Bi-fuel
- Dual fuel
By Fitting
By Geography
- North America
- Europe
- Germany
- France
- U.K.
- Italy
- Spain
- Rest of Europe
- Asia Pacific
- China
- Japan
- India
- South Korea
- South-east Asia
- Rest of Asia Pacific
- Latin America
- Brazil
- Argentina
- Rest of Latin America
- Middle East & Africa
- GCC Countries
- South Africa
- Rest of the Middle East and Africa
Competitive Landscape
The competitive landscape of the CNG and LPG vehicles market features major automakers and fuel system manufacturers expanding product portfolios, partnerships, and infrastructure support. Key players include Toyota, Honda, Hyundai Motor Company, Tata Motors, Mahindra & Mahindra, IVECO, Volkswagen Group, Ford Motor Company, MAN SE, and General Motors. These companies offer factory-fitted CNG and LPG variants across passenger cars, three-wheelers, and commercial fleets to meet emission rules and reduce fuel cost for users. Many OEMs invest in advanced combustion systems, safer storage tanks, and bi-fuel engines to improve mileage and performance. Growing collaboration between automakers, energy companies, and government agencies supports refueling network expansion and fleet conversion programs. Local kit manufacturers and aftermarket suppliers also play a strong role in retrofit adoption in price-sensitive markets. Continuous product upgrades, expanding sales channels, and city-based fleet projects strengthen competition as buyers demand reliable, low-emission, and cost-effective mobility options.
Shape Your Report to Specific Countries or Regions & Enjoy 30% Off!
Key Player Analysis
- Toyota
- MAN SE
- Mahindra & Mahindra
- Hyundai Motor Company
- Volkswagen Group
- Ford Motor Company
- Honda
- Tata Motors
- General Motors
- IVECO
Recent Developments
- In November 2024, the Ogun State Government partnered with the Standards Organization of Nigeria (SON) to promote the adoption of Compressed Natural Gas (CNG)-powered vehicles.
- In July 2024, Bajaj Auto prepared to launch the Qute CNG, which Rakesh Sharma, Executive Director of Bajaj Auto, described as India’s first Auto Taxi. The 4-seater hatchback will be available in both LPG and CNG variants, providing a cleaner and more cost-effective alternative to gasoline.
- In September 2023, Uno Minda Limited announced plans to increase its stake in its joint venture, Minda Westport Technologies Limited (MWTL), from 50% to 76% by acquiring an additional 26% stake from Westport Fuel Systems Italia S.r.l.
- In August 2023, Tata Motors launched the CNG version of its micro-SUV, the Punch, with an initial ex-showroom price range in India from ₹7,09,900 to ₹9,67,900. When converting these prices into USD at the time of launch, the approximate range was between $8,541 and $11,645.
Report Coverage
The research report offers an in-depth analysis based on Vehicle, Fuel, Engine System, Fitting and Geography. It details leading market players, providing an overview of their business, product offerings, investments, revenue streams, and key applications. Additionally, the report includes insights into the competitive environment, SWOT analysis, current market trends, as well as the primary drivers and constraints. Furthermore, it discusses various factors that have driven market expansion in recent years. The report also explores market dynamics, regulatory scenarios, and technological advancements that are shaping the industry. It assesses the impact of external factors and global economic changes on market growth. Lastly, it provides strategic recommendations for new entrants and established companies to navigate the complexities of the market.
Future Outlook
- Demand for CNG and LPG vehicles will increase as fuel cost stays lower than petrol and diesel.
- More cities will adopt clean mobility rules, pushing public transport and taxi fleets toward gas-based vehicles.
- Automakers will launch new factory-fitted CNG and LPG models across small cars, vans, and light commercial fleets.
- Bi-fuel systems will remain popular as users prefer flexibility between gas and conventional fuel.
- Growth in refueling infrastructure will reduce range concerns and support long-distance travel for logistics fleets.
- Advanced tank materials and safety systems will improve trust and reduce maintenance needs.
- Retrofitting services will expand in emerging markets where buyers seek low-cost conversion options.
- Government subsidies and tax support will improve adoption in regions with poor air quality.
- Adoption will spread from metro cities to smaller towns as more fueling stations become operational.
- The market will stay competitive as global OEMs and local kit suppliers develop cost-effective and safer solutions.


