Home » Semiconductor & Electronics » Australia UPS Market

Australia Uninterruptible Power Supply (UPS) Market By Type (Offline/Standby UPS, Line-Interactive UPS, Online/Double Conversion UPS); By Power Rating (200 kVA); By End-User (Residential, Commercial, Industrial, Data Centers, Telecom, Healthcare, Government & Public Infrastructure); By Deployment (Centralized UPS, Decentralized/Distributed UPS, Cloud-Managed UPS Systems) – Growth, Share, Opportunities & Competitive Analysis, 2024 – 2032

Report ID: 168497 | Report Format : Excel, PDF

Market Overview:

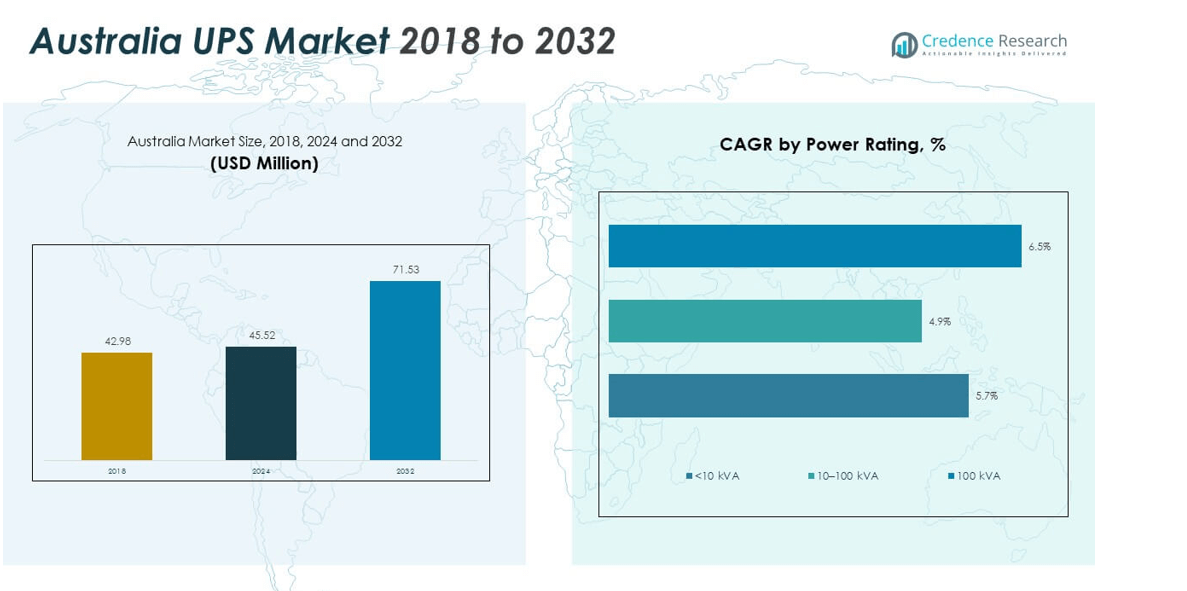
The Australia Uninterruptible Power Supply (UPS) Market size was valued at USD 42.98 million in 2018 to USD 45.52 million in 2024 and is anticipated to reach USD 71.53 million by 2032, at a CAGR of 5.81% during the forecast period.

REPORT ATTRIBUTE DETAILS
Historical Period 2020-2023
Base Year 2024
Forecast Period 2025-2032
Australia UPS Market Size 2024 USD 45.52 million
Australia UPS Market, CAGR 5.81%
Australia UPS Market Size 2032 USD 71.53 million


Rising data traffic drives strong need for reliable backup systems across many industries. Companies adopt advanced UPS units to reduce outage risk during power disturbances. Healthcare sites install high-capacity units to protect sensitive devices. IT workloads rise due to rapid cloud adoption across major cities. Factories use UPS support to maintain automated production lines during voltage dips. Residential users shift toward compact systems due to frequent home office setups. Strong interest in energy-efficient models supports broader upgrades nationwide.

Demand remains strong across regions with higher commercial and industrial density. New South Wales holds a strong position due to large corporate clusters and data center expansion. Victoria shows steady growth due to rising IT service activities and strong urban demand. Queensland emerges due to expanding manufacturing bases and rising infrastructure work. Western Australia gains traction due to mining activity and remote facility needs. Regional markets show stable adoption where grid reliability gaps encourage UPS deployment.

Australia UPS Market size

Market Insights:

  • The Australia UPS Market was valued at USD 42.98 million in 2018, reached USD 45.52 million in 2024, and is forecast to hit USD 71.53 million by 2032, advancing at a 81% CAGR due to rising digital infrastructure needs.
  • New South Wales (34%), Victoria (27%), and Queensland (18%) command the highest shares, supported by dense commercial hubs, growing data center activity, and strong infrastructure expansion.
  • Western Australia (14%) emerges as the fastest-growing region, driven by mining operations and remote-site power stability requirements that strengthen UPS adoption.
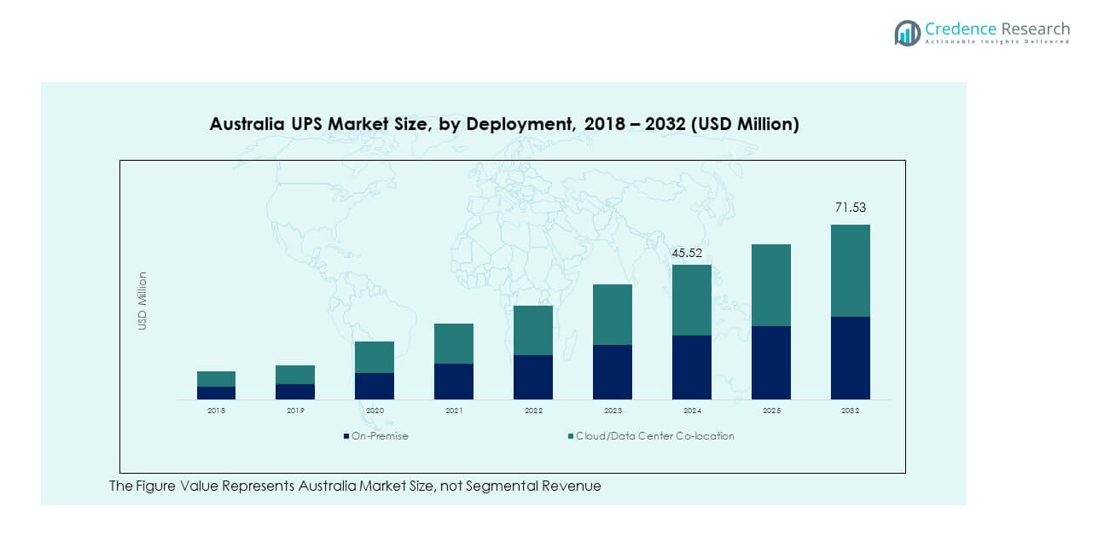
  • Cloud/Data Center Colocation deployments hold the larger share (about 60–65%), reflecting strong growth in data hosting, digital services, and colocation facilities.
  • On-Premise UPS systems represent the remaining 35–40% share, supported by office buildings, retail networks, and industrial plants that rely on local backup infrastructure.

Access crucial information at unmatched prices!

Request your sample report today & start making informed decisions powered by Credence Research Inc.!

Download Sample

Market Drivers:

Growing Dependence On Stable Power For Digital And Industrial Operations

Demand rises due to strong expansion of digital workloads across cities. Data centers need uninterrupted power to protect servers from outage risk. Hospitals use advanced UPS units to maintain critical device stability. Offices deploy compact systems to prevent workflow loss during voltage dips. Homes adopt small UPS units to support remote work needs. Industrial plants use backup systems to protect automated lines from production stops. The Australia UPS Market gains steady momentum due to rising power sensitivity across sectors.

  • For instance, Schneider Electric’s Galaxy VM supports medical-grade continuity with power ratings up to 200 kVA used in clinical facilities across Europe. Offices deploy compact systems to prevent workflow loss during voltage dips. Homes adopt small UPS units to support remote work needs. Industrial plants use backup systems to protect automated lines from production stops.

Rapid Growth Of Cloud Services And Edge Computing Infrastructure

Cloud expansion creates higher need for stable power across many zones. Edge sites use compact UPS units to support low-latency operations. Telecom towers adopt backup solutions to maintain network uptime during grid issues. IT service firms install scalable UPS units to protect high-load systems. Retail chains use power support for payment infrastructure and security devices. Logistics hubs deploy backup systems to avoid downtime during peak traffic. Strong focus on digital continuity lifts UPS adoption across strategic sites.

  • For instance, Huawei’s NetEco UPS series supports telecom loads with efficiency reaching 96% under online mode. IT service firms install scalable UPS units to protect high-load systems. Retail chains use power support for payment infrastructure and security devices. Logistics hubs deploy backup systems to avoid downtime during peak traffic.

Increasing Use Of Energy-Efficient And Low-Emission Power Backup Systems

Buyers prefer UPS units that reduce heat output and energy loss. Government rules encourage adoption of efficient systems across offices and plants. Modern UPS solutions help cut operational overhead for large buildings. Enterprises upgrade old units to reduce energy waste and improve system life. Hospitals adopt green systems to support sustainability targets. Industrial zones shift toward models with higher conversion efficiency. Strong interest in cleaner solutions supports wider modernization across key regions.

Rising Investments In Automated Facilities And Smart Building Networks

Smart buildings use UPS units to maintain uptime for sensors and control systems. Automated factories adopt high-capacity units to protect robotics from sudden outages. Transport hubs install advanced systems to secure ticketing and surveillance devices. Warehousing operators adopt modular systems to support fast expansion. Corporate parks upgrade central power rooms to handle rising IT loads. Public sites implement UPS support to maintain smooth facility operations. Strong automation adoption lifts UPS relevance across urban clusters.

Market Trends:

Shift Toward Lithium-Ion UPS Adoption Across Commercial And Industrial Sites

Many buyers move toward lithium-ion systems due to longer lifecycle. Units provide faster recharge time that supports high-load environments. Data centers use lithium models to optimize space and reduce heat. Offices choose compact versions that offer high power density. Industrial sites seek systems with lower maintenance needs. Retail clusters deploy lithium units to secure POS operations. The Australia UPS Market observes rising interest in new-age battery formats.

  • For instance, Vertiv’s DCE lithium solutions deliver up to 40% footprint reduction for high-density racks. Offices choose compact versions that offer high power density. Industrial sites seek systems with lower maintenance needs. Retail clusters deploy lithium units to secure POS operations.

Growing Adoption Of Modular UPS Designs For Scalable Operations

Businesses prefer modular systems due to flexible capacity expansion. Data centers add modules to handle rising server loads. Telecom sites use modularity to support network upgrades. Warehouses use scalable systems to match seasonal demand changes. Large buildings install modular units to optimize floor space. Industrial users value easy replacement of modules during repairs. The trend supports faster deployment across fast-growing zones.

  • For instance, Huawei’s FusionPower series allows module expansion up to 1.2 MW in a single system. Telecom sites use modularity to support network upgrades. Warehouses use scalable systems to match seasonal demand changes.

Integration Of Smart Monitoring And Remote Management Platforms

UPS makers introduce systems with real-time performance tracking tools. Remote dashboards help teams detect faults early and reduce downtime. IT teams adjust load distribution through cloud-based controls. Buildings integrate UPS data with central management platforms. Industrial plants monitor battery health to reduce sudden failures. Telecom sites use alerts to plan maintenance during low traffic periods. Digital control adoption strengthens operational reliability for many users.

Rising Preference For Hybrid And Renewable-Linked Backup Solutions

Businesses connect UPS systems with solar arrays to cut grid dependence. Public sites deploy hybrid setups to maintain uptime during outages. Industrial parks integrate renewable support for critical equipment. Offices adopt hybrid inverters to improve power stability across wings. Data centers explore renewable-backed UPS designs to align with emission goals. Warehouses use hybrid systems to support lighting and automation devices. Buyers view hybrid setups as long-term cost-friendly solutions.

Market Challenges Analysis:

High Installation Costs And Complex Upgrade Requirements Across Sectors

Many firms delay upgrades due to high upfront system costs. Large UPS units need strong wiring and stable room conditions. Buildings face challenges while allocating space for heavy cabinets. Industrial plants struggle with downtime during system replacement work. Older structures require extensive electrical adjustments before installation. Buyers hesitate when maintenance contracts appear costly for long periods. The Australia UPS Market manages growth under these cost and setup pressures.

Limited Grid Stability In Remote Regions And Difficult Service Accessibility

Remote sites deal with frequent voltage shifts that strain UPS health. Lack of technical staff slows repair work during failures. Mining zones depend on service teams that travel long distances. Harsh conditions reduce system life and increase replacement risk. Telecom towers in remote belts face difficulty securing fast battery support. Public sites deal with slow turnaround for damaged units. Service gaps create operational challenges for many regional users.

Market Opportunities:

Rising Demand For Backup Systems Across Expanding Digital Infrastructure

Strong cloud expansion creates room for new UPS deployments. Edge networks need compact units for low-latency hubs. Data centers seek advanced systems with longer battery life. Retail networks use UPS units to maintain stable transaction flows. Healthcare growth increases demand for clean power in sensitive zones. Automation adoption drives use of high-efficiency systems. The Australia UPS Market gains new prospects across digital corridors.

Growing Scope For Green, Renewable-Linked And Long-Lifecycle UPS Systems

Companies adopt solar-integrated UPS to lower long-term energy costs. Government sustainability plans support clean backup solutions. Industrial parks explore long-lifecycle systems for heavy equipment. Commercial buildings shift toward energy-efficient models with smart controls. Warehouses adopt eco-friendly units that reduce heat load. Buyers value systems that combine low emissions and strong durability. Many growth pockets emerge across cities focusing on green transitions.

Australia UPS Market share

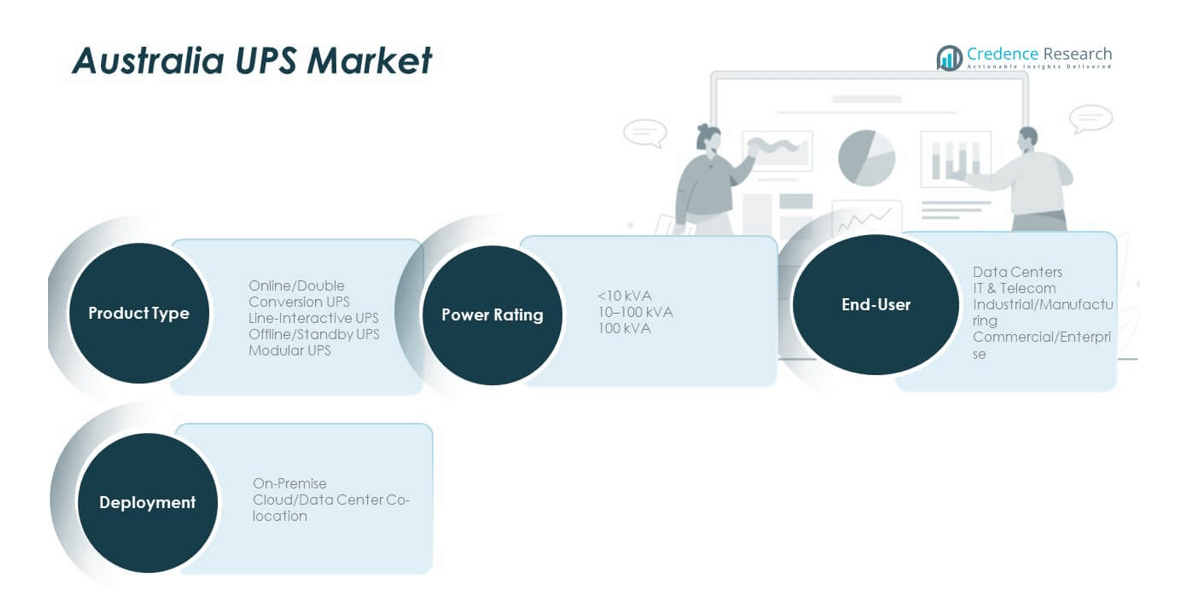
Market Segmentation Analysis:

By Product Type

The Australia UPS Market covers three major product categories that address varied load protection needs. Offline/Standby UPS units support basic home and small office devices with cost-focused features. Line-interactive systems gain traction due to strong voltage regulation performance suited for commercial use. Online/Double Conversion UPS units remain the preferred choice for data centers and industrial automation due to high power quality. Buyers across large facilities install online systems to secure sensitive workloads from grid disturbance. Demand stays balanced across regions with rising digital usage patterns. It gains further strength from wider deployment in smart buildings and remote facilities.

  • For instance, Eaton’s 5SC line-interactive UPS provides AVR correction and supports up to 1500 VA. Online/Double Conversion UPS units remain preferred for data centers and industrial automation due to high power quality.

By Power Rating

Power ratings shape buyer choice across homes, offices, and industrial plants. Units below 1 kVA dominate residential and small workspace settings. Systems between 1–10 kVA support commercial IT rooms and retail networks. Mid-range 10–50 kVA units serve hospitals, logistics hubs, and telecom sites. Higher ratings between 50–200 kVA protect industrial equipment and automation units. Heavy-duty systems above 200 kVA remain critical for data centers and large campuses. Demand stays steady across all ranges with rising equipment sensitivity across sectors.

  • For instance, Vertiv Trinergy Cube scales up to 3.4 MW for hyperscale facilities. Demand stays steady across all ranges with rising equipment sensitivity across sectors.

By End-User

End-user demand stays strong across residential, commercial, industrial, telecom, healthcare, and government sectors. Homes install compact UPS systems to support remote work and essential devices. Commercial buildings deploy scalable units for IT rooms and business continuity. Industrial users adopt high-capacity units to protect automated lines. Data centers drive premium demand due to high power reliability standards. Healthcare facilities prioritize clean and stable power for sensitive devices. Government and public infrastructure adopt UPS systems to ensure uninterrupted service delivery.

By Deployment

Deployment preferences vary across facility size and digital maturity. Centralized UPS systems support large campuses and high-load environments. Decentralized setups gain adoption across offices and retail due to easy placement and quick expansion. Cloud-managed UPS systems rise in demand due to remote monitoring needs and digital maintenance practices.

Australia UPS Market segmentation

Segmentation:

By Product Type

  • Offline/Standby UPS
  • Line-Interactive UPS
  • Online/Double Conversion UPS
  • (Any other product subtypes included in your internal dataset)

By Power Rating

  • < 1 kVA
  • 1–10 kVA
  • 10–50 kVA
  • 50–200 kVA
  • 200 kVA

By End-User

  • Residential
  • Commercial
  • Industrial
  • Data Centers
  • Telecom
  • Healthcare
  • Government & Public Infrastructure

By Deployment

  • Centralized UPS
  • Decentralized/Distributed UPS
  • Cloud-Managed UPS Systems

Regional Analysis:

New South Wales – Leading Commercial and Digital Hub

New South Wales holds the largest share of the Australia UPS Market at nearly 34%, driven by dense commercial clusters and strong data center expansion across Sydney. Large corporate offices invest in high-capacity UPS systems to protect IT infrastructure. Hospitals and public facilities adopt advanced units to maintain power stability in critical operations. Retail networks deploy mid-range systems to secure payment and surveillance equipment. Industrial sites in the region adopt UPS support to safeguard automated machinery from voltage fluctuation. It gains further traction from growth in cloud operations and digital service providers. Adoption patterns remain steady across both urban and suburban zones.

Victoria – Strong Industrial Base and Expanding IT Footprint

Victoria accounts for about 27% of the market, supported by a strong mix of industrial activity and rising IT service workloads. Commercial facilities in Melbourne deploy scalable UPS units to protect hybrid work and digital communication systems. Manufacturing plants adopt high-load models to support automation and protect equipment from electrical disturbance. Healthcare networks rely on stable backup systems due to growing diagnostic and treatment equipment needs. Retail and logistics operators adopt UPS systems to maintain smooth operations during peak hours. It continues to benefit from strong construction activity in commercial districts. Broader digital adoption improves long-term opportunities across the region.

Queensland, Western Australia, and South Australia – Emerging Growth Corridors

Queensland holds nearly 18% market share, supported by rising infrastructure activity and expansion of logistics hubs. Western Australia contributes around 14%, driven by mining operations that depend on high-durability UPS systems for remote sites. South Australia represents roughly 7%, supported by defense, renewable energy, and public infrastructure projects. Regional facilities adopt UPS solutions to reduce power fluctuation risk in zones with variable grid stability. Telecom installations expand across rural belts, helping lift demand for mid-capacity systems. It gains support from ongoing network modernization across these states. Combined adoption across these regions strengthens market balance nationwide.

Shape Your Report to Specific Countries or Regions & Enjoy 30% Off!

Key Player Analysis:

Competitive Analysis:

The Australia UPS Market reflects strong competition among global and regional suppliers that aim to strengthen presence through product innovation and service expansion. Leading brands focus on energy-efficient, high-density UPS systems that support advanced digital infrastructure. Data center growth drives heavy adoption of online UPS units, which increases competitive pressure among top players. Local distributors partner with global manufacturers to improve after-sales service and shorten delivery timelines. Industrial clients demand durable units that handle harsh power environments, which pushes companies to improve battery life and conversion efficiency. Commercial buyers prefer scalable models that support modular expansion. It continues to evolve with rising adoption of smart monitoring platforms across many sectors.

Recent Developments:

  • In June 2025, Eaton launched its next-generation 9PX Gen2 UPS (5–11 kVA) featuring advanced silicon carbide components for superior efficiency and compact design. Although this specific partnership was announced for Singapore with Fengsheng Electric as an authorized distributor, the 9PX Gen2 represents Eaton’s commitment to delivering advanced UPS technology across the Asia-Pacific region, including potential expansion into Australia’s critical infrastructure markets serving residential, commercial, and industrial sectors.
  • In December 2024, the company introduced the Vertiv PowerUPS 9000, an energy-efficient, high-power density uninterruptible power supply system engineered for space-constrained environments. This next-generation system features double-conversion efficiency of up to 97.5%, a 32% smaller physical footprint than previous generations, and modular architecture supporting scalable deployments from 250 to 1250 kW per unit globally.
  • In September 2024, Legrand announced a significant acquisition that strengthened its presence in the Australian market. The company acquired Australian Plastic Profiles (APP), a leading cable management and PVC conduit specialist based in Sydney. This strategic move doubled Legrand’s size in Australia and marked the company’s largest investment in the ANZ region since acquiring HPM in 2007. Australian Plastic Profiles operates two prominent brands—AussieDuct for electrical products and Pipe King for plumbing operations—employing approximately 250 people across its headquarters in Caringbah, Sydney, and seven warehouses distributed throughout Australia.

Report Coverage:

The research report offers an in-depth analysis based on By Product Type, By Power Rating, By End-User, and By Deployment. It details leading market players, providing an overview of their business, product offerings, investments, revenue streams, and key applications. Additionally, the report includes insights into the competitive environment, SWOT analysis, current market trends, as well as the primary drivers and constraints. Furthermore, it discusses various factors that have driven market expansion in recent years. The report also explores market dynamics, regulatory scenarios, and technological advancements that are shaping the industry. It assesses the impact of external factors and global economic changes on market growth. Lastly, it provides strategic recommendations for new entrants and established companies to navigate the complexities of the market.

Future Outlook:

  • Strong digital expansion will intensify demand for high-capacity UPS systems across key sectors.
  • Growth in data center construction will lift adoption of double-conversion units with higher reliability.
  • Smart monitoring functions will gain traction due to rising focus on predictive maintenance.
  • Energy-efficient UPS systems will see broader use across industrial plants and commercial buildings.
  • Lithium-ion battery integration will rise as buyers seek longer lifecycle and reduced maintenance.
  • Distributed UPS architectures will expand with the growth of edge computing in remote zones.
  • Telecom infrastructure upgrades will support steady demand for mid-range power ratings.
  • Green building standards will increase adoption of low-emission and high-efficiency UPS units.
  • Cloud-managed UPS platforms will see stronger interest from enterprises seeking remote control.
  • Broader investment in automation will strengthen market opportunities across industrial clusters.

CHAPTER NO. 1 : INTRODUCTION 22

1.1. Report Description 22

Purpose of the Report 22

USP & Key Offerings 22

1.2. Key Benefits for Stakeholders 23

1.3. Target Audience 23

CHAPTER NO. 2 : EXECUTIVE SUMMARY 24

CHAPTER NO. 3 : AUSTRALIA UPS MARKET FORCES & INDUSTRY PULSE 26

3.1. Foundations of Change Market Overview 26

3.2. Catalysts of Expansion Key Market Drivers 28

3.3. Momentum Boosters Growth Triggers 29

3.4. Innovation Fuel Disruptive Technologies 29

3.5. Headwinds & Crosswinds Market Restraints 30

3.6. Regulatory Tides Compliance Challenges 31

3.7. Economic Frictions Inflationary Pressures 31

3.8. Untapped Horizons Growth Potential & Opportunities and Strategic Navigation Industry Frameworks 32

3.9. Market Equilibrium Porter’s Five Forces 33

3.10. Macro Forces PESTEL Breakdown 35

3.11. Buying Criteria 37

CHAPTER NO. 4 : COMPETITION ANALYSIS 38

4.1. Company Market Share Analysis 38

4.1.1. Australia UPS Market Company Volume Market Share 38

4.1.2. Australia UPS Market Company Revenue Market Share 40

4.2. Strategic Developments 42

4.2.1. Acquisitions & Mergers 42

4.2.2. New Product Type Launch 43

4.2.3. Agreements & Collaborations 44

4.3. Competitive Dashboard 45

4.4. Company Assessment Metrics, 2024 46

CHAPTER NO. 5 : AUSTRALIA MARKET ANALYSIS, INSIGHTS & FORECAST, BY PRODUCT TYPE 47

CHAPTER NO. 6 : AUSTRALIA MARKET ANALYSIS, INSIGHTS & FORECAST, BY POWER RATING 52

CHAPTER NO. 7 : AUSTRALIA MARKET ANALYSIS, INSIGHTS & FORECAST, BY END-USER 57

CHAPTER NO. 8 : AUSTRALIA MARKET ANALYSIS, INSIGHTS & FORECAST, BY DEPLOYMENT 62

CHAPTER NO. 9 : COMPANY PROFILE 67

9.1. Legrand 67

9.2. Schneider Electric 70

9.3. APC by Schneider Electric 70

9.4. Eaton 70

9.5. Vertiv 70

9.6. Company 6 70

9.7. Company 7 70

9.8. Company 8 70

9.9. Company 9 70

9.10. Company 10 70

9.11. Company 11 70

9.12. Company 12 70

9.13. Company 13 70

9.14. Company 14 70

List of Figures

FIG NO. 1. Australia UPS Market Revenue Share, By Product Type, 2024 & 2032 47

FIG NO. 2. Market Attractiveness Analysis, By Product Type 48

FIG NO. 3. Incremental Revenue Growth Opportunity by Product Type, 2024 – 2032 49

FIG NO. 4. Australia UPS Market Revenue Share, By Power Rating, 2024 & 2032 52

FIG NO. 5. Market Attractiveness Analysis, By Power Rating 53

FIG NO. 6. Incremental Revenue Growth Opportunity by Power Rating, 2024 – 2032 54

FIG NO. 7. Australia UPS Market Revenue Share, By End-user, 2024 & 2032 57

FIG NO. 8. Market Attractiveness Analysis, By End-user 58

FIG NO. 9. Incremental Revenue Growth Opportunity by End-user, 2024 – 2032 59

FIG NO. 10. Australia UPS Market Revenue Share, By Deployment, 2024 & 2032 62

FIG NO. 11. Market Attractiveness Analysis, By Deployment 63

FIG NO. 12. Incremental Revenue Growth Opportunity by Deployment, 2024 – 2032 64

List of Tables

TABLE NO. 1. : Australia UPS Market Revenue, By Product Type, 2018 2024 (USD Million) 50

TABLE NO. 2. : Australia UPS Market Revenue, By Product Type, 2025 2032 (USD Million) 50

TABLE NO. 3. : Australia UPS Market Volume, By Product Type, 2018 2024 (Units) 51

TABLE NO. 4. : Australia UPS Market Volume, By Product Type, 2025 2032 (Units) 51

TABLE NO. 5. : Australia UPS Market Revenue, By Power Rating, 2018 2024 (USD Million) 55

TABLE NO. 6. : Australia UPS Market Revenue, By Power Rating, 2025 2032 (USD Million) 55

TABLE NO. 7. : Australia UPS Market Volume, By Power Rating, 2018 2024 (Units) 56

TABLE NO. 8. : Australia UPS Market Volume, By Power Rating, 2025 2032 (Units) 56

TABLE NO. 9. : Australia UPS Market Revenue, By End-user, 2018 2024 (USD Million) 60

TABLE NO. 10. : Australia UPS Market Revenue, By End-user, 2025 2032 (USD Million) 60

TABLE NO. 11. : Australia UPS Market Volume, By End-user, 2018 2024 (Units) 61

TABLE NO. 12. : Australia UPS Market Volume, By End-user, 2025 2032 (Units) 61

TABLE NO. 13. : Australia UPS Market Revenue, By Deployment, 2018 2024 (USD Million) 65

TABLE NO. 14. : Australia UPS Market Revenue, By Deployment, 2025 2032 (USD Million) 65

TABLE NO. 15. : Australia UPS Market Volume, By Deployment, 2018 2024 (Units) 66


TABLE NO. 16. : Australia UPS Market Volume, By Deployment, 2025 2032 (Units) 66

Request Free Sample

We prioritize the confidentiality and security of your data. Our promise: your information remains private.

Ready to Transform Data into Decisions?

Request Your Sample Report and Start Your Journey of Informed Choices


Providing the strategic compass for industry titans.

cr-clients-logos

Frequently Asked Questions

What is the current market size for the Australia UPS Market, and what is its projected size in 2032?

The Australia UPS Market stood at USD 45.52 million in 2024 and is projected to reach USD 71.53 million by 2032. Growth remains steady due to rising demand for reliable backup systems.

At what Compound Annual Growth Rate is the Australia UPS Market projected to grow between 2024 and 2032?

The Australia UPS Market is projected to grow at a CAGR of 5.81% during 2024–2032, supported by digital infrastructure expansion.

Which Australia UPS Market segment held the largest share in 2024?

The Australia UPS Market saw Online/Double Conversion UPS units hold the leading share due to strong use in data centers and industrial facilities

What are the primary factors fueling the growth of the Australia UPS Market?

The Australia UPS Market expands due to rising digital workloads, strong data center activity, commercial IT adoption, and higher reliance on stable electricity across industries.

Who are the leading companies in the Australia UPS Market?

The Australia UPS Market includes key players such as Schneider Electric, Legrand, APC by Schneider Electric, Eaton, and Vertiv, supported by regional distributors.

About Author

Sushant Phapale

Sushant Phapale

ICT & Automation Expert

Sushant is an expert in ICT, automation, and electronics with a passion for innovation and market trends.

View Profile

Related Reports

Gas Fired Water Tube Food Processing Boiler Market

The Gas Fired Water Tube Food Processing Boiler market size was valued at USD 247.94 million in 2024 and is anticipated to reach USD 352.6 million by 2032, at a CAGR of 4.5% during the forecast period.

Electronic shift operations management solutions market

Electronic shift operations management solutions were valued at USD 5.77 billion in 2024 and are projected to reach USD 11.42 billion by 2032, growing at a CAGR of 8.9% during the forecast period.

DC Microgrid Market

The DC Microgrid Market was valued at USD 7.8 billion in 2024 and is expected to reach USD 30.93 billion by 2032, registering a CAGR of 18.8% during the forecast period.

Dynamic Light Scattering (Dls) Particle Size Analyzer Market

Dynamic Light Scattering (DLS) Particle Size Analyzer Market size was valued at USD 360.5 Million in 2024 and is anticipated to reach USD 574.58 Million by 2032, at a CAGR of 6% during the forecast period.

Heat Pump Water Heater Market

The Heat Pump Water Heater market size was valued at USD 5 billion in 2024 and is anticipated to reach USD 8.68 billion by 2032, at a CAGR of 8.2% during the forecast period.

Trimmer Potentiometer Market

The Trimmer potentiometer market is projected to grow from USD 1,078.87 million in 2024 to USD 1,436.11 million by 2032, with a CAGR of 3.64% from 2024 to 2032.

Smart Locks Market

Smart Lock Market size was valued USD 2.78 Billion in 2024 and is anticipated to reach USD 9.72 Billion by 2032, at a CAGR of 16.94% during the forecast period.

Interaction Sensor Market

Interaction Sensor Market size was valued USD 35701 million in 2024 and is anticipated to reach USD 157650 million by 2032, at a CAGR of 20.4% during the forecast period.

Temperature Controlled Material Market

The temperature-controlled materials market was valued at USD 8.5 billion in 2024. It is projected to reach USD 16.08 billion by 2032, growing at a CAGR of 8.3% during the forecast period.

Integrated Bridge System for Ships Market

Integrated Bridge System for Ships market size was valued at USD 8.17 Billion in 2024 and is anticipated to reach USD 10.76 Billion by 2032, growing at a CAGR of 3.5% during the forecast period.

Gas Fueled Peak Shaving Power Rental Market

Gas Fueled Peak Shaving Power Rental Market was valued at USD 462.8 million in 2024 and is anticipated to reach USD 648.14 million by 2032, growing at a CAGR of 4.3 % during the forecast period.

Electrical Wiring Interconnection System Market

Electrical Wiring Interconnection System market size was valued at USD 7.87 billion in 2024 and is expected to reach USD 12.86 billion by 2032, growing at a CAGR of 6.34% during the forecast period.

Licence Option

The report comes as a view-only PDF document, optimized for individual clients. This version is recommended for personal digital use and does not allow printing. Use restricted to one purchaser only.
$2999

To meet the needs of modern corporate teams, our report comes in two formats: a printable PDF and a data-rich Excel sheet. This package is optimized for internal analysis. Unlimited users allowed within one corporate location (e.g., regional office).
$4999

The report will be delivered in printable PDF format along with the report’s data Excel sheet. This license offers 100 Free Analyst hours where the client can utilize Credence Research Inc. research team. Permitted for unlimited global use by all users within the purchasing corporation, such as all employees of a single company.
$8999

Report delivery within 24 to 48 hours

Credence Staff 3

WILLIAM, North America

Support Staff at Credence Research

KEITH PHILLIPS, Europe

Lee - CR Sales Staff

LEE VALLANCE, Asia Pacific

Kieran Jameson

KIERAN JAMESON, Australia

Smallform of Sample request
User Review

Thank you for the data! The numbers are exactly what we asked for and what we need to build our business case.

Materials Scientist
(privacy requested)

User Review

The report was an excellent overview of the Industrial Burners market. This report does a great job of breaking everything down into manageable chunks.

Imre Hof
Management Assistant, Bekaert

cr-clients-logos

Request Sample