CHAPTER NO. 1 : INTRODUCTION 30
1.1.1. Report Description 30
Purpose of the Report 30
USP & Key Offerings 30
1.1.2. Key Benefits for Stakeholders 30
1.1.3. Target Audience 31
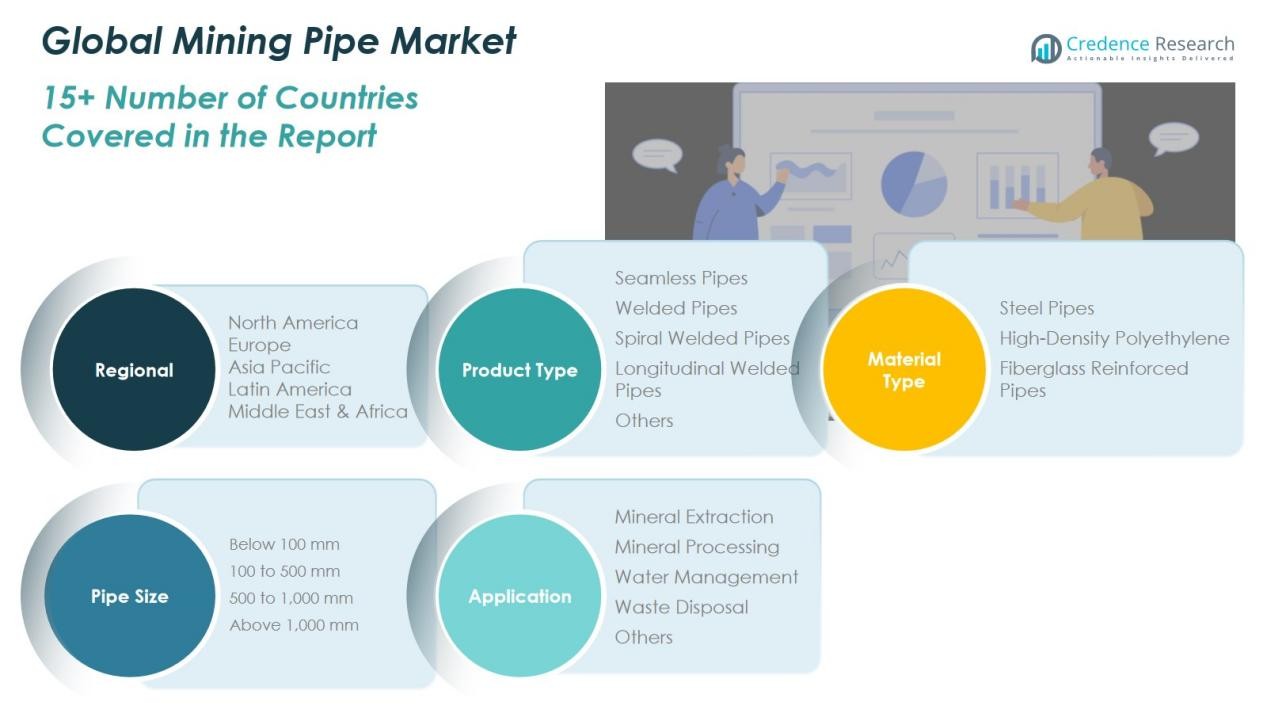
1.1.4. Report Scope 31
1.1.5. Regional Scope 32
CHAPTER NO. 2 : EXECUTIVE SUMMARY 33
2.1. Mining Pipe Market Snapshot 33
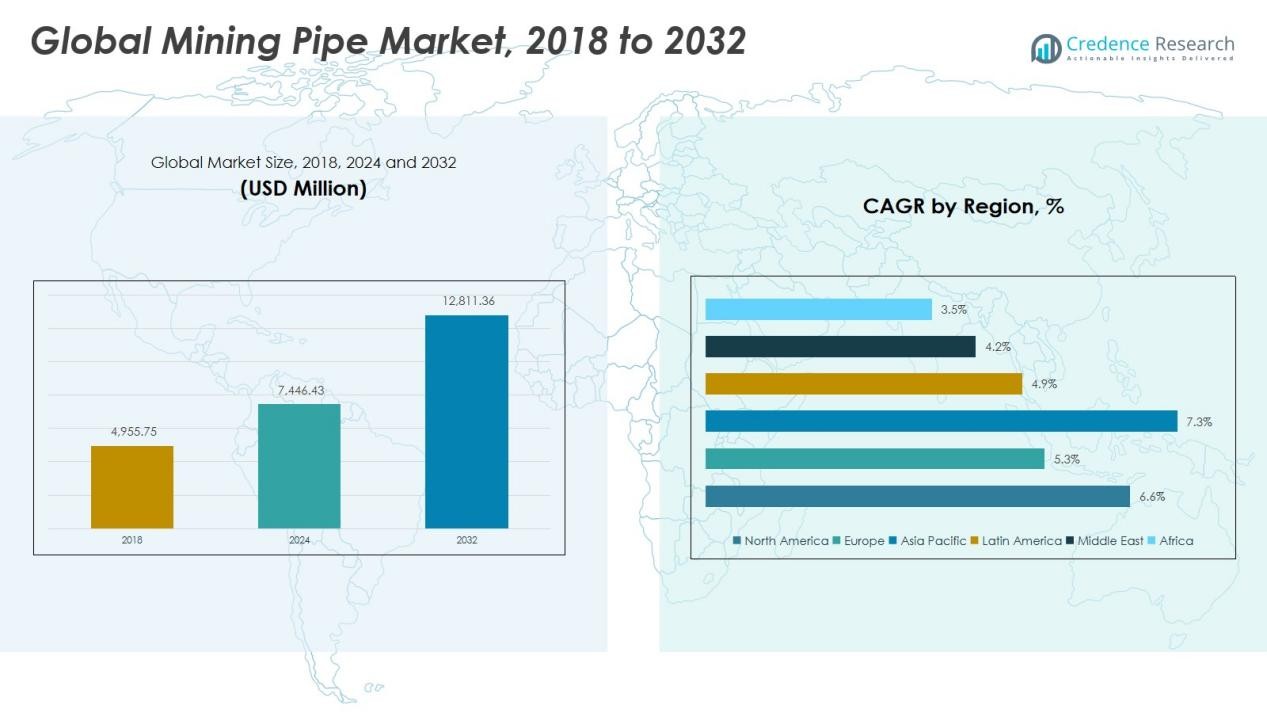
2.1.1. Global Mining Pipe Market, 2018 – 2032 (Thousand Tons) (USD Million) 35
2.2. Insights from Primary Respondents 35
CHAPTER NO. 3 : GEOPOLITICAL CRISIS IMPACT ANALYSIS 36
3.1. Russia-Ukraine and Israel-Palestine War Impacts 36
CHAPTER NO. 4 : MINING PIPE MARKET – INDUSTRY ANALYSIS 37
4.1. Introduction 37
4.2. Market Drivers 38
4.2.1. Rising Mineral Production and Exploration Activities 38
4.2.2. Growing Adoption of Corrosion-Resistant and Lightweight Materials 39
4.3. Market Restraints 40
4.3.1. High Initial Installation and Replacement Costs 40
4.4. Market Opportunities 41
4.4.1. Market Opportunity Analysis 41
4.5. Porter’s Five Forces Analysis 42
4.6. Value Chain Analysis 43
4.7. Buying Criteria 44
CHAPTER NO. 5 : PRICE ANALYSIS 45
5.1. Price Analysis by Region 45
5.1.1. Global Mining Pipe Market Price, By Region, 2018 – 2023 45
5.1.2. Global Product Type Market Price, By Region, 2018 – 2023 45
5.2. Price Analysis by Product Type 46
5.2.1. Global Mining Pipe Market Price, By Product Type, 2018 – 2023 46
5.2.2. Global Product Type Market Price, By Product Type, 2018 – 2023 46
CHAPTER NO. 6 : ANALYSIS COMPETITIVE LANDSCAPE 47
6.1. Company Market Share Analysis – 2023 47
6.1.1. Global Mining Pipe Market: Company Market Share, by Volume, 2023 47
6.1.2. Global Mining Pipe Market: Company Market Share, by Revenue, 2023 48
6.1.3. Global Mining Pipe Market: Top 6 Company Market Share, by Revenue, 2023 48
6.1.4. Global Mining Pipe Market: Top 3 Company Market Share, by Revenue, 2023 49
6.2. Global Mining Pipe Market Company Volume Market Share, 2023 50
6.3. Global Mining Pipe Market Company Revenue Market Share, 2023 51
6.4. Company Assessment Metrics, 2023 52
6.4.1. Stars 52
6.4.2. Emerging Leaders 52
6.4.3. Pervasive Players 52
6.4.4. Participants 52
6.5. Start-ups /SMEs Assessment Metrics, 2023 52
6.5.1. Progressive Companies 52
6.5.2. Responsive Companies 52
6.5.3. Dynamic Companies 52
6.5.4. Starting Blocks 52
6.6. Strategic Developments 53
6.6.1. Acquisitions & Mergers 53
New Product Launch 53
Regional Expansion 53
6.7. Key Players Product Matrix 54
CHAPTER NO. 7 : PESTEL & ADJACENT MARKET ANALYSIS 55
7.1. PESTEL 55
7.1.1. Political Factors 55
7.1.2. Economic Factors 55
7.1.3. Social Factors 55
7.1.4. Technological Factors 55
7.1.5. Environmental Factors 55
7.1.6. Legal Factors 55
7.2. Adjacent Market Analysis 55
CHAPTER NO. 8 : MINING PIPE MARKET – BY PRODUCT TYPE SEGMENT ANALYSIS 56
8.1. Mining Pipe Market Overview, by Product Type Segment 56
8.1.1. Mining Pipe Market Volume Share, By Product Type, 2023 & 2032 57
8.1.2. Mining Pipe Market Revenue Share, By Product Type, 2023 & 2032 57
8.1.3. Mining Pipe Market Attractiveness Analysis, By Product Type 58
8.1.4. Incremental Revenue Growth Opportunity, by Product Type, 2024 – 2032 58
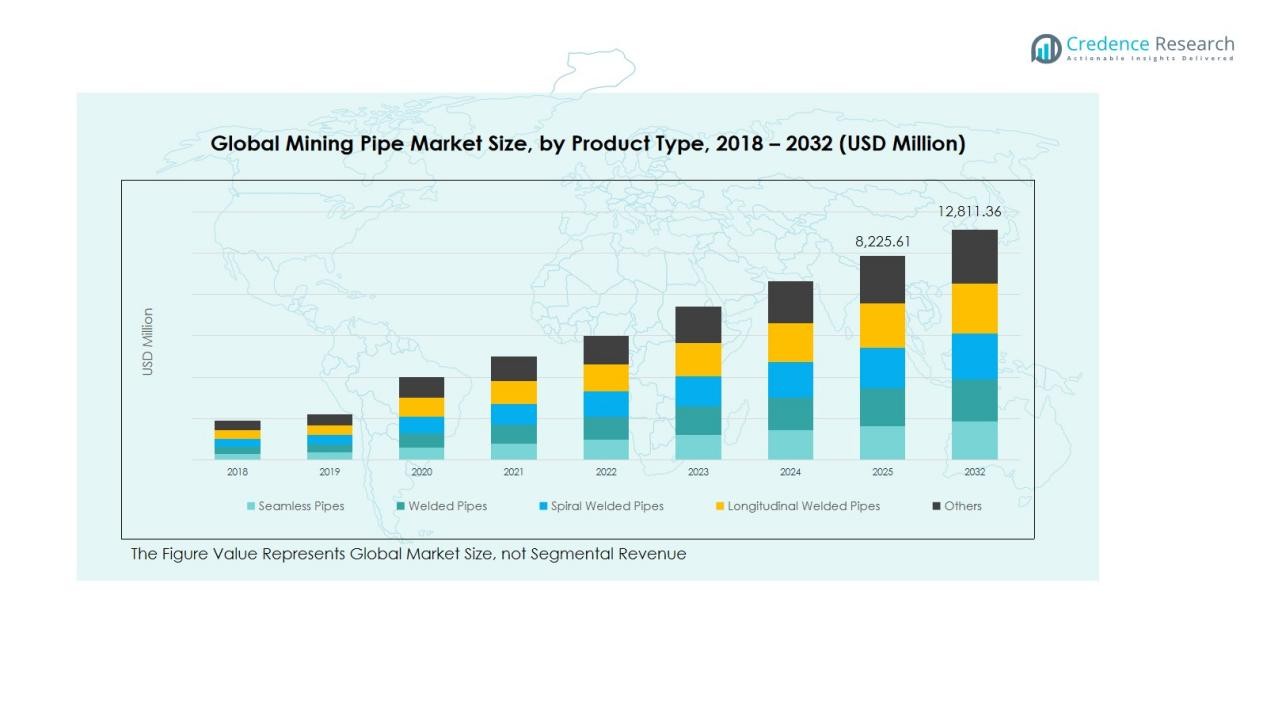
8.1.5. Mining Pipe Market Revenue, By Product Type, 2018, 2023, 2027 & 2032 59
8.2. Seamless Pipes 60
8.2.1. Global Seamless Pipes Mining Pipe Market Volume & Revenue, By Region, 2018 – 2023 (Thousand Tons) (USD Million) 61
8.2.2. Global Seamless Pipes Mining Pipe Market Volume & Revenue, By Region, 2024 – 2032 (Thousand Tons) (USD Million) 61
8.3. Welded Pipes 63
8.3.1. Global Welded Pipes Mining Pipe Market Volume & Revenue, By Region, 2018 – 2023 (Thousand Tons) (USD Million) 64
8.3.2. Global Welded Pipes Mining Pipe Market Volume & Revenue, By Region, 2024 – 2032 (Thousand Tons) (USD Million) 64
8.4. Spiral Welded Pipes 66
8.5. Global Spiral Welded Pipes Mining Pipe Market Volume & Revenue, By Region, 2018 – 2023 (Thousand Tons) (USD Million) 67
8.6. Global Spiral Welded Pipes Mining Pipe Market Volume & Revenue, By Region, 2024 – 2032 (Thousand Tons) (USD Million) 67
8.7. Longitudinal Welded Pipes 69
8.7.1. Global Longitudinal Welded Pipes Mining Pipe Market Volume & Revenue, By Region, 2018 – 2023 (Thousand Tons) (USD Million) 70
8.7.2. Global Longitudinal Welded Pipes Mining Pipe Market Volume & Revenue, By Region, 2024 – 2032 (Thousand Tons) (USD Million) 70
8.8. Others 72
8.8.1. Global Others Mining Pipe Market Volume & Revenue, By Region, 2018 – 2023 (Thousand Tons) (USD Million) 73
8.8.2. Global Others Mining Pipe Market Volume & Revenue, By Region, 2024 – 2032 (Thousand Tons) (USD Million) 73
CHAPTER NO. 9 : MINING PIPE MARKET – BY MATERIAL TYPE SEGMENT ANALYSIS 74
9.1. Mining Pipe Market Overview, by Material Type Segment 74
9.1.1. Mining Pipe Market Volume Share, By Material Type, 2023 & 2032 75
9.1.2. Mining Pipe Market Revenue Share, By Material Type, 2023 & 2032 75
9.1.3. Mining Pipe Market Attractiveness Analysis, By Material Type 76
9.1.4. Incremental Revenue Growth Opportunity, by Material Type, 2024 – 2032 76
9.1.5. Mining Pipe Market Revenue, By Material Type, 2018, 2023, 2027 & 2032 77
9.2. Steel Pipes 78
9.2.1. Global Steel Pipes Mining Pipe Market Volume & Revenue, By Region, 2018 – 2023 (Thousand Tons) (USD Million) 79
9.2.2. Global Steel Pipes Mining Pipe Market Volume & Revenue, By Region, 2024 – 2032 (Thousand Tons) (USD Million) 79
9.3. High-Density Polyethylene 80
9.3.1. Global High-Density Polyethylene Mining Pipe Market Volume & Revenue, By Region, 2018 – 2023 (Thousand Tons) (USD Million) 81
9.3.2. Global High-Density Polyethylene Mining Pipe Market Volume & Revenue, By Region, 2024 – 2032 (Thousand Tons) (USD Million) 81
9.4. Fiberglass Reinforced Pipes 83
9.5. Global Fiberglass Reinforced Pipes Mining Pipe Market Volume & Revenue, By Region, 2018 – 2023 (Thousand Tons) (USD Million) 84
9.6. Global Fiberglass Reinforced Pipes Mining Pipe Market Volume & Revenue, By Region, 2024 – 2032 (Thousand Tons) (USD Million) 84
CHAPTER NO. 10 : MINING PIPE MARKET – BY PIPE SIZE SEGMENT ANALYSIS 86
10.1. Mining Pipe Market Overview, by Pipe Size Segment 86
10.1.1. Mining Pipe Market Volume Share, By Pipe Size, 2023 & 2032 87
10.1.2. Mining Pipe Market Revenue Share, By Pipe Size, 2023 & 2032 87
10.1.3. Mining Pipe Market Attractiveness Analysis, By Pipe Size 88
10.1.4. Incremental Revenue Growth Opportunity, by Pipe Size, 2024 – 2032 88
10.1.5. Mining Pipe Market Revenue, By Pipe Size, 2018, 2023, 2027 & 2032 89
10.2. Below 100 mm 90
10.2.1. Global Below 100 mm Mining Pipe Market Volume & Revenue, By Region, 2018 – 2023 (Thousand Tons) (USD Million) 91
10.2.2. Global Below 100 mm Mining Pipe Market Volume & Revenue, By Region, 2024 – 2032 (Thousand Tons) (USD Million) 91
10.3. 100 to 500 mm 93
10.3.1. Global 100 to 500 mm Mining Pipe Market Volume & Revenue, By Region, 2018 – 2023 (Thousand Tons) (USD Million) 94
10.3.2. Global 100 to 500 mm Mining Pipe Market Volume & Revenue, By Region, 2024 – 2032 (Thousand Tons) (USD Million) 94
10.4. 500 to 1,000 mm 96
10.5. Global 500 to 1,000 mm Mining Pipe Market Volume & Revenue, By Region, 2018 – 2023 (Thousand Tons) (USD Million) 97
10.6. Global 500 to 1,000 mm Mining Pipe Market Volume & Revenue, By Region, 2024 – 2032 (Thousand Tons) (USD Million) 97
10.7. Above 1,000 mm 99
10.7.1. Global Above 1,000 mm Mining Pipe Market Volume & Revenue, By Region, 2018 – 2023 (Thousand Tons) (USD Million) 100
10.7.2. Global Above 1,000 mm Mining Pipe Market Volume & Revenue, By Region, 2024 – 2032 (Thousand Tons) (USD Million) 100
CHAPTER NO. 11 : MINING PIPE MARKET – BY APPLICATION SEGMENT ANALYSIS 102
11.1. Mining Pipe Market Overview, by Application Segment 102
11.1.1. Mining Pipe Market Volume Share, By Application, 2023 & 2032 103
11.1.2. Mining Pipe Market Revenue Share, By Application, 2023 & 2032 103
11.1.3. Mining Pipe Market Attractiveness Analysis, By Application 104
11.1.4. Incremental Revenue Growth Opportunity, by Application, 2024 – 2032 104
11.1.5. Mining Pipe Market Revenue, By Application, 2018, 2023, 2027 & 2032 105
11.2. Mineral Extraction 106
11.2.1. Global Mineral Extraction Mining Pipe Market Volume & Revenue, By Region, 2018 – 2023 (Thousand Tons) (USD Million) 107
11.2.2. Global Mineral Extraction Mining Pipe Market Volume & Revenue, By Region, 2024 – 2032 (Thousand Tons) (USD Million) 107
11.3. Mineral Processing 109
11.3.1. Global Mineral Processing Mining Pipe Market Volume & Revenue, By Region, 2018 – 2023 (Thousand Tons) (USD Million) 110
11.3.2. Global Mineral Processing Mining Pipe Market Volume & Revenue, By Region, 2024 – 2032 (Thousand Tons) (USD Million) 110
11.4. Water Management 112
11.5. Global Water Management Mining Pipe Market Volume & Revenue, By Region, 2018 – 2023 (Thousand Tons) (USD Million) 113
11.6. Global Water Management Mining Pipe Market Volume & Revenue, By Region, 2024 – 2032 (Thousand Tons) (USD Million) 113
11.7. Waste Disposal 115
11.7.1. Global Waste Disposal Mining Pipe Market Volume & Revenue, By Region, 2018 – 2023 (Thousand Tons) (USD Million) 116
11.7.2. Global Waste Disposal Mining Pipe Market Volume & Revenue, By Region, 2024 – 2032 (Thousand Tons) (USD Million) 116
11.8. Others 118
11.8.1. Global Others Mining Pipe Market Volume & Revenue, By Region, 2018 – 2023 (Thousand Tons) (USD Million) 119
11.8.2. Global Others Mining Pipe Market Volume & Revenue, By Region, 2024 – 2032 (Thousand Tons) (USD Million) 119
CHAPTER NO. 12 : MINING PIPE MARKET – REGIONAL ANALYSIS 120
12.1. Mining Pipe Market Overview, by Regional Segments 120
12.2. Region 121
12.2.1. Global Mining Pipe Market Volume Share, By Region, 2023 & 2032 121
12.2.2. Global Mining Pipe Market Revenue Share, By Region, 2023 & 2032 121
12.2.3. Mining Pipe Market Attractiveness Analysis, By Region 122
12.2.4. Incremental Revenue Growth Opportunity, by Region, 2024 – 2032 122
12.2.5. Mining Pipe Market Revenue, By Region, 2018, 2023, 2027 & 2032 123
12.2.6. Global Mining Pipe Market Volume & Revenue, By Region, 2018 – 2023 (Thousand Tons) (USD Million) 124
12.2.7. Global Mining Pipe Market Volume & Revenue, By Region, 2024 – 2032 (Thousand Tons) (USD Million) 124
12.3. Product Type 125
12.3.1. Global Mining Pipe Market Volume & Revenue, By Product Type, 2018 – 2023 (Thousand Tons) (USD Million) 125
12.4. Global Mining Pipe Market Volume & Revenue, By Product Type, 2024 – 2032 (Thousand Tons) (USD Million) 125
12.5. Material Type 126
12.5.1. Global Mining Pipe Market Volume & Revenue, By Material Type, 2018 – 2023 (Thousand Tons) (USD Million) 126
12.5.2. Global Mining Pipe Market Volume & Revenue, By Material Type, 2024 – 2032 (Thousand Tons) (USD Million) 126
12.6. Pipe Size 127
12.6.1. Global Mining Pipe Market Volume & Revenue, By Pipe Size, 2018 – 2023 (Thousand Tons) (USD Million) 127
12.6.2. Global Mining Pipe Market Volume & Revenue, By Pipe Size, 2024 – 2032 (Thousand Tons) (USD Million) 127
12.7. Application 128
12.7.1. Global Mining Pipe Market Volume & Revenue, By Application, 2018 – 2023 (Thousand Tons) (USD Million) 128
12.7.2. Global Mining Pipe Market Volume & Revenue, By Application, 2024 – 2032 (Thousand Tons) (USD Million) 128
CHAPTER NO. 13 : MINING PIPE MARKET – NORTH AMERICA 129
13.1. North America 129
13.1.1. Key Highlights 129
13.1.2. North America Mining Pipe Market Volume, By Country, 2018 – 2032 (Thousand Tons) 130
13.1.3. North America Mining Pipe Market Revenue, By Country, 2018 – 2023 (USD Million) 131
13.1.4. North America Mining Pipe Market Volume, By Product Type, 2018 – 2023 (Thousand Tons) 132
13.1.5. North America Mining Pipe Market Revenue, By Product Type, 2018 – 2023 (USD Million) 133
13.1.6. North America Mining Pipe Market Volume, By Material Type, 2018 – 2023 (Thousand Tons) 134
13.1.7. North America Mining Pipe Market Revenue, By Material Type, 2018 – 2023 (USD Million) 135
13.1.8. North America Mining Pipe Market Volume, By Pipe Size, 2018 – 2023 (Thousand Tons) 136
13.1.9. North America Mining Pipe Market Revenue, By Pipe Size, 2018 – 2023 (USD Million) 137
13.1.10. North America Mining Pipe Market Volume, By Application, 2018 – 2023 (Thousand Tons) 138
13.1.11. North America Mining Pipe Market Revenue, By Application, 2018 – 2023 (USD Million) 139
13.2. U.S. 140
13.3. Canada 140
13.4. Mexico 140
CHAPTER NO. 14 : MINING PIPE MARKET – EUROPE 141
14.1. Europe 141
14.1.1. Key Highlights 141
14.1.2. Europe Mining Pipe Market Volume, By Country, 2018 – 2032 (Thousand Tons) 142
14.1.3. Europe Mining Pipe Market Revenue, By Country, 2018 – 2023 (USD Million) 143
14.1.4. Europe Mining Pipe Market Volume, By Product Type, 2018 – 2023 (Thousand Tons) 144
14.1.5. Europe Mining Pipe Market Revenue, By Product Type, 2018 – 2023 (USD Million) 145
14.1.6. Europe Mining Pipe Market Volume, By Material Type, 2018 – 2023 (Thousand Tons) 146
14.1.7. Europe Mining Pipe Market Revenue, By Material Type, 2018 – 2023 (USD Million) 147
14.1.8. Europe Mining Pipe Market Volume, By Pipe Size, 2018 – 2023 (Thousand Tons) 148
14.1.9. Europe Mining Pipe Market Revenue, By Pipe Size, 2018 – 2023 (USD Million) 149
14.1.10. Europe Mining Pipe Market Volume, By Application, 2018 – 2023 (Thousand Tons) 150
14.1.11. Europe Mining Pipe Market Revenue, By Application, 2018 – 2023 (USD Million) 151
14.2. UK 152
14.3. France 152
14.4. Germany 152
14.5. Italy 152
14.6. Spain 152
14.7. Russia 152
14.8. Belgium 152
14.9. Netherland 152
14.10. Austria 152
14.11. Sweden 152
14.12. Poland 152
14.13. Denmark 152
14.14. Switzerland 152
14.15. Rest of Europe 152
CHAPTER NO. 15 : MINING PIPE MARKET – ASIA PACIFIC 153
15.1. Asia Pacific 153
15.1.1. Key Highlights 153
15.1.2. Asia Pacific Mining Pipe Market Volume, By Country, 2018 – 2032 (Thousand Tons) 154
15.1.3. Asia Pacific Mining Pipe Market Revenue, By Country, 2018 – 2023 (USD Million) 155
15.1.4. Asia Pacific Mining Pipe Market Volume, By Product Type, 2018 – 2023 (Thousand Tons) 156
15.1.5. Asia Pacific Mining Pipe Market Revenue, By Product Type, 2018 – 2023 (USD Million) 157
15.1.6. Asia Pacific Mining Pipe Market Volume, By Material Type, 2018 – 2023 (Thousand Tons) 158
15.1.7. Asia Pacific Mining Pipe Market Revenue, By Material Type, 2018 – 2023 (USD Million) 159
15.1.8. Asia Pacific Mining Pipe Market Volume, By Pipe Size, 2018 – 2023 (Thousand Tons) 160
15.1.9. Asia Pacific Mining Pipe Market Revenue, By Pipe Size, 2018 – 2023 (USD Million) 161
15.1.10. Asia Pacific Mining Pipe Market Volume, By Application, 2018 – 2023 (Thousand Tons) 162
15.1.11. Asia Pacific Mining Pipe Market Revenue, By Application, 2018 – 2023 (USD Million) 163
15.2. China 164
15.3. Japan 164
15.4. South Korea 164
15.5. India 164
15.6. Australia 164
15.7. Thailand 164
15.8. Indonesia 164
15.9. Vietnam 164
15.10. Malaysia 164
15.11. Philippines 164
15.12. Taiwan 164
15.13. Rest of Asia Pacific 164
CHAPTER NO. 16 : MINING PIPE MARKET – LATIN AMERICA 165
16.1. Latin America 165
16.1.1. Key Highlights 165
16.1.2. Latin America Mining Pipe Market Volume, By Country, 2018 – 2032 (Thousand Tons) 166
16.1.3. Latin America Mining Pipe Market Revenue, By Country, 2018 – 2023 (USD Million) 167
16.1.4. Latin America Mining Pipe Market Volume, By Product Type, 2018 – 2023 (Thousand Tons) 168
16.1.5. Latin America Mining Pipe Market Revenue, By Product Type, 2018 – 2023 (USD Million) 169
16.1.6. Latin America Mining Pipe Market Volume, By Material Type, 2018 – 2023 (Thousand Tons) 170
16.1.7. Latin America Mining Pipe Market Revenue, By Material Type, 2018 – 2023 (USD Million) 171
16.1.8. Latin America Mining Pipe Market Volume, By Pipe Size, 2018 – 2023 (Thousand Tons) 172
16.1.9. Latin America Mining Pipe Market Revenue, By Pipe Size, 2018 – 2023 (USD Million) 173
16.1.10. Latin America Mining Pipe Market Volume, By Application, 2018 – 2023 (Thousand Tons) 174
16.1.11. Latin America Mining Pipe Market Revenue, By Application, 2018 – 2023 (USD Million) 175
16.2. Brazil 176
16.3. Argentina 176
16.4. Peru 176
16.5. Chile 176
16.6. Colombia 176
16.7. Rest of Latin America 176
CHAPTER NO. 17 : MINING PIPE MARKET – MIDDLE EAST 177
17.1. Middle East 177
17.1.1. Key Highlights 177
17.1.2. Middle East Mining Pipe Market Volume, By Country, 2018 – 2032 (Thousand Tons) 178
17.1.3. Middle East Mining Pipe Market Revenue, By Country, 2018 – 2023 (USD Million) 179
17.1.4. Middle East Mining Pipe Market Volume, By Product Type, 2018 – 2023 (Thousand Tons) 180
17.1.5. Middle East Mining Pipe Market Revenue, By Product Type, 2018 – 2023 (USD Million) 181
17.1.6. Middle East Mining Pipe Market Volume, By Material Type, 2018 – 2023 (Thousand Tons) 182
17.1.7. Middle East Mining Pipe Market Revenue, By Material Type, 2018 – 2023 (USD Million) 183
17.1.8. Middle East Mining Pipe Market Volume, By Pipe Size, 2018 – 2023 (Thousand Tons) 184
17.1.9. Middle East Mining Pipe Market Revenue, By Pipe Size, 2018 – 2023 (USD Million) 185
17.1.10. Middle East Mining Pipe Market Volume, By Application, 2018 – 2023 (Thousand Tons) 186
17.1.11. Middle East Mining Pipe Market Revenue, By Application, 2018 – 2023 (USD Million) 187
17.2. UAE 188
17.3. KSA 188
17.4. Israel 188
17.5. Turkey 188
17.6. Iran 188
17.7. Rest of Middle East 188
CHAPTER NO. 18 : MINING PIPE MARKET – AFRICA 189
18.1. Africa 189
18.1.1. Key Highlights 189
18.1.2. Africa Mining Pipe Market Volume, By Country, 2018 – 2032 (Thousand Tons) 190
18.1.3. Africa Mining Pipe Market Revenue, By Country, 2018 – 2023 (USD Million) 191
18.1.4. Africa Mining Pipe Market Volume, By Product Type, 2018 – 2023 (Thousand Tons) 192
18.1.5. Africa Mining Pipe Market Revenue, By Product Type, 2018 – 2023 (USD Million) 193
18.1.6. Africa Mining Pipe Market Volume, By Material Type, 2018 – 2023 (Thousand Tons) 194
18.1.7. Africa Mining Pipe Market Revenue, By Material Type, 2018 – 2023 (USD Million) 195
18.1.8. Africa Mining Pipe Market Volume, By Pipe Size, 2018 – 2023 (Thousand Tons) 196
18.1.9. Africa Mining Pipe Market Revenue, By Pipe Size, 2018 – 2023 (USD Million) 197
18.1.10. Africa Mining Pipe Market Volume, By Application, 2018 – 2023 (Thousand Tons) 198
18.1.11. Africa Mining Pipe Market Revenue, By Application, 2018 – 2023 (USD Million) 199
18.2. Egypt 200
18.3. Nigeria 200
18.4. Algeria 200
18.5. Morocco 200
18.6. Rest of Africa 200
CHAPTER NO. 19 : COMPANY PROFILES 201
19.1. Vallourec S.A. 201
19.1.1. Company Overview 201
19.1.2. Product Portfolio 201
19.1.3. Swot Analysis 201
19.1.4. Business Strategy 201
19.1.5. Financial Overview 202
19.2. Metalurgica Gerdau S.A. 203
19.3. Georg Fischer Ltd. 203
19.4. China National Petroleum Corporation (CNPC) 203
19.5. PSL Limited 203
19.6. Jindal Saw Ltd. 203
19.7. Welspun Corp Limited 203
19.8. Company 8 203
19.9. Company 9 203
19.10. Company 10 203
19.11. Company 11 203
19.12. Company 12 203
19.13. Company 13 203
19.14. Company 14 203
List of Figures
FIG NO. 1. Global Mining Pipe Market Volume & Revenue, 2018 – 2032 (Thousand Tons) (USD Million) 35
FIG NO. 2. Porter’s Five Forces Analysis for Global Mining Pipe Market 42
FIG NO. 3. Value Chain Analysis for Global Mining Pipe Market 43
FIG NO. 4. Global Mining Pipe Market Price, By Region, 2018 – 2023 45
FIG NO. 5. Global Mining Pipe Market Price, By Product Type, 2018 – 2023 46
FIG NO. 6. Company Share Analysis, 2023 47
FIG NO. 7. Company Share Analysis, 2023 48
FIG NO. 8. Company Share Analysis, 2023 48
FIG NO. 9. Company Share Analysis, 2023 49
FIG NO. 10. Mining Pipe Market – Company Volume Market Share, 2023 50
FIG NO. 11. Mining Pipe Market – Company Revenue Market Share, 2023 51
FIG NO. 12. Mining Pipe Market Volume Share, By Product Type, 2023 & 2032 57
FIG NO. 13. Mining Pipe Market Revenue Share, By Product Type, 2023 & 2032 57
FIG NO. 14. Market Attractiveness Analysis, By Product Type 58
FIG NO. 15. Incremental Revenue Growth Opportunity by Product Type, 2024 – 2032 58
FIG NO. 16. Mining Pipe Market Revenue, By Product Type, 2018, 2023, 2027 & 2032 59
FIG NO. 17. Global Mining Pipe Market for Seamless Pipes, Volume & Revenue (Thousand Tons) (USD Million) 2018 – 2032 60
FIG NO. 18. Global Mining Pipe Market for Welded Pipes, Volume & Revenue (Thousand Tons) (USD Million) 2018 – 2032 63
FIG NO. 19. Global Mining Pipe Market for Spiral Welded Pipes, Volume & Revenue (Thousand Tons) (USD Million) 2018 – 2032 66
FIG NO. 20. Global Mining Pipe Market for Longitudinal Welded Pipes, Volume & Revenue (Thousand Tons) (USD Million) 2018 – 2032 69
FIG NO. 21. Global Mining Pipe Market for Others, Volume & Revenue (Thousand Tons) (USD Million) 2018 – 2032 72
FIG NO. 22. Mining Pipe Market Volume Share, By Material Type, 2023 & 2032 75
FIG NO. 23. Mining Pipe Market Revenue Share, By Material Type, 2023 & 2032 75
FIG NO. 24. Market Attractiveness Analysis, By Material Type 76
FIG NO. 25. Incremental Revenue Growth Opportunity by Material Type, 2024 – 2032 76
FIG NO. 26. Mining Pipe Market Revenue, By Material Type, 2018, 2023, 2027 & 2032 77
FIG NO. 27. Global Mining Pipe Market for Steel Pipes, Volume & Revenue (Thousand Tons) (USD Million) 2018 – 2032 78
FIG NO. 28. Global Mining Pipe Market for High-Density Polyethylene, Volume & Revenue (Thousand Tons) (USD Million) 2018 – 2032 80
FIG NO. 29. Global Mining Pipe Market for Fiberglass Reinforced Pipes, Volume & Revenue (Thousand Tons) (USD Million) 2018 – 2032 83
FIG NO. 30. Mining Pipe Market Volume Share, By Pipe Size, 2023 & 2032 87
FIG NO. 31. Mining Pipe Market Revenue Share, By Pipe Size, 2023 & 2032 87
FIG NO. 32. Market Attractiveness Analysis, By Pipe Size 88
FIG NO. 33. Incremental Revenue Growth Opportunity by Pipe Size, 2024 – 2032 88
FIG NO. 34. Mining Pipe Market Revenue, By Pipe Size, 2018, 2023, 2027 & 2032 89
FIG NO. 35. Global Mining Pipe Market for Below 100 mm, Volume & Revenue (Thousand Tons) (USD Million) 2018 – 2032 90
FIG NO. 36. Global Mining Pipe Market for 100 to 500 mm, Volume & Revenue (Thousand Tons) (USD Million) 2018 – 2032 93
FIG NO. 37. Global Mining Pipe Market for 500 to 1,000 mm, Volume & Revenue (Thousand Tons) (USD Million) 2018 – 2032 96
FIG NO. 38. Global Mining Pipe Market for Above 1,000 mm, Volume & Revenue (Thousand Tons) (USD Million) 2018 – 2032 99
FIG NO. 39. Mining Pipe Market Volume Share, By Application, 2023 & 2032 103
FIG NO. 40. Mining Pipe Market Revenue Share, By Application, 2023 & 2032 103
FIG NO. 41. Market Attractiveness Analysis, By Application 104
FIG NO. 42. Incremental Revenue Growth Opportunity by Application, 2024 – 2032 104
FIG NO. 43. Mining Pipe Market Revenue, By Application, 2018, 2023, 2027 & 2032 105
FIG NO. 44. Global Mining Pipe Market for Mineral Extraction, Volume & Revenue (Thousand Tons) (USD Million) 2018 – 2032 106
FIG NO. 45. Global Mining Pipe Market for Mineral Processing, Volume & Revenue (Thousand Tons) (USD Million) 2018 – 2032 109
FIG NO. 46. Global Mining Pipe Market for Water Management, Volume & Revenue (Thousand Tons) (USD Million) 2018 – 2032 112
FIG NO. 47. Global Mining Pipe Market for Waste Disposal, Volume & Revenue (Thousand Tons) (USD Million) 2018 – 2032 115
FIG NO. 48. Global Mining Pipe Market for Others, Volume & Revenue (Thousand Tons) (USD Million) 2018 – 2032 118
FIG NO. 49. Global Mining Pipe Market Volume Share, By Region, 2023 & 2032 121
FIG NO. 50. Global Mining Pipe Market Revenue Share, By Region, 2023 & 2032 121
FIG NO. 51. Market Attractiveness Analysis, By Region 122
FIG NO. 52. Incremental Revenue Growth Opportunity by Region, 2024 – 2032 122
FIG NO. 53. Mining Pipe Market Revenue, By Region, 2018, 2023, 2027 & 2032 123
FIG NO. 54. North America Mining Pipe Market Volume & Revenue, 2018 – 2032 (Thousand Tons) (USD Million) 129
FIG NO. 55. Europe Mining Pipe Market Volume & Revenue, 2018 – 2032 (Thousand Tons) (USD Million) 141
FIG NO. 56. Asia Pacific Mining Pipe Market Volume & Revenue, 2018 – 2032 (Thousand Tons) (USD Million) 153
FIG NO. 57. Latin America Mining Pipe Market Volume & Revenue, 2018 – 2032 (Thousand Tons) (USD Million) 165
FIG NO. 58. Middle East Mining Pipe Market Volume & Revenue, 2018 – 2032 (Thousand Tons) (USD Million) 177
FIG NO. 59. Africa Mining Pipe Market Volume & Revenue, 2018 – 2032 (Thousand Tons) (USD Million) 189
List of Tables
TABLE NO. 1. : Global Mining Pipe Market: Snapshot 33
TABLE NO. 2. : Drivers for the Mining Pipe Market: Impact Analysis 38
TABLE NO. 3. : Restraints for the Mining Pipe Market: Impact Analysis 40
TABLE NO. 4. : Global Mining Pipe Market Volume & Revenue, By Region, 2018 – 2023 45
TABLE NO. 5. : Global Mining Pipe Market Volume & Revenue, By Product Type, 2018 – 2023 46
TABLE NO. 6. : Global Seamless Pipes Mining Pipe Market Volume & Revenue, By Region, 2018 – 2023 (Thousand Tons) (USD Million) 61
TABLE NO. 7. : Global Seamless Pipes Mining Pipe Market Volume & Revenue, By Region, 2024 – 2032 (Thousand Tons) (USD Million) 61
TABLE NO. 8. : Global Welded Pipes Mining Pipe Market Volume & Revenue, By Region, 2018 – 2023 (Thousand Tons) (USD Million) 64
TABLE NO. 9. : Global Welded Pipes Mining Pipe Market Volume & Revenue, By Region, 2024 – 2032 (Thousand Tons) (USD Million) 64
TABLE NO. 10. : Global Spiral Welded Pipes Mining Pipe Market Volume & Revenue, By Region, 2018 – 2023 (Thousand Tons) (USD Million) 67
TABLE NO. 11. : Global Spiral Welded Pipes Mining Pipe Market Volume & Revenue, By Region, 2024 – 2032 (Thousand Tons) (USD Million) 67
TABLE NO. 12. : Global Longitudinal Welded Pipes Mining Pipe Market Volume & Revenue, By Region, 2018 – 2023 (Thousand Tons) (USD Million) 70
TABLE NO. 13. : Global Longitudinal Welded Pipes Mining Pipe Market Volume & Revenue, By Region, 2024 – 2032 (Thousand Tons) (USD Million) 70
TABLE NO. 14. : Global Others Mining Pipe Market Volume & Revenue, By Region, 2018 – 2023 (Thousand Tons) (USD Million) 73
TABLE NO. 15. : Global Others Mining Pipe Market Volume & Revenue, By Region, 2024 – 2032 (Thousand Tons) (USD Million) 73
TABLE NO. 16. : Global Steel Pipes Mining Pipe Market Volume & Revenue, By Region, 2018 – 2023 (Thousand Tons) (USD Million) 79
TABLE NO. 17. : Global Steel Pipes Mining Pipe Market Volume & Revenue, By Region, 2024 – 2032 (Thousand Tons) (USD Million) 79
TABLE NO. 18. : Global High-Density Polyethylene Mining Pipe Market Volume & Revenue, By Region, 2018 – 2023 (Thousand Tons) (USD Million) 81
TABLE NO. 19. : Global High-Density Polyethylene Mining Pipe Market Volume & Revenue, By Region, 2024 – 2032 (Thousand Tons) (USD Million) 81
TABLE NO. 20. : Global Fiberglass Reinforced Pipes Mining Pipe Market Volume & Revenue, By Region, 2018 – 2023 (Thousand Tons) (USD Million) 84
TABLE NO. 21. : Global Fiberglass Reinforced Pipes Mining Pipe Market Volume & Revenue, By Region, 2024 – 2032 (Thousand Tons) (USD Million) 84
TABLE NO. 22. : Global Below 100 mm Mining Pipe Market Volume & Revenue, By Region, 2018 – 2023 (Thousand Tons) (USD Million) 91
TABLE NO. 23. : Global Below 100 mm Mining Pipe Market Volume & Revenue, By Region, 2024 – 2032 (Thousand Tons) (USD Million) 91
TABLE NO. 24. : Global 100 to 500 mm Mining Pipe Market Volume & Revenue, By Region, 2018 – 2023 (Thousand Tons) (USD Million) 94
TABLE NO. 25. : Global 100 to 500 mm Mining Pipe Market Volume & Revenue, By Region, 2024 – 2032 (Thousand Tons) (USD Million) 94
TABLE NO. 26. : Global 500 to 1,000 mm Mining Pipe Market Volume & Revenue, By Region, 2018 – 2023 (Thousand Tons) (USD Million) 97
TABLE NO. 27. : Global 500 to 1,000 mm Mining Pipe Market Volume & Revenue, By Region, 2024 – 2032 (Thousand Tons) (USD Million) 97
TABLE NO. 28. : Global Above 1,000 mm Mining Pipe Market Volume & Revenue, By Region, 2018 – 2023 (Thousand Tons) (USD Million) 100
TABLE NO. 29. : Global Above 1,000 mm Mining Pipe Market Volume & Revenue, By Region, 2024 – 2032 (Thousand Tons) (USD Million) 100
TABLE NO. 30. : Global Mineral Extraction Mining Pipe Market Volume & Revenue, By Region, 2018 – 2023 (Thousand Tons) (USD Million) 107
TABLE NO. 31. : Global Mineral Extraction Mining Pipe Market Volume & Revenue, By Region, 2024 – 2032 (Thousand Tons) (USD Million) 107
TABLE NO. 32. : Global Mineral Processing Mining Pipe Market Volume & Revenue, By Region, 2018 – 2023 (Thousand Tons) (USD Million) 110
TABLE NO. 33. : Global Mineral Processing Mining Pipe Market Volume & Revenue, By Region, 2024 – 2032 (Thousand Tons) (USD Million) 110
TABLE NO. 34. : Global Water Management Mining Pipe Market Volume & Revenue, By Region, 2018 – 2023 (Thousand Tons) (USD Million) 113
TABLE NO. 35. : Global Water Management Mining Pipe Market Volume & Revenue, By Region, 2024 – 2032 (Thousand Tons) (USD Million) 113
TABLE NO. 36. : Global Waste Disposal Mining Pipe Market Volume & Revenue, By Region, 2018 – 2023 (Thousand Tons) (USD Million) 116
TABLE NO. 37. : Global Waste Disposal Mining Pipe Market Volume & Revenue, By Region, 2024 – 2032 (Thousand Tons) (USD Million) 116
TABLE NO. 38. : Global Others Mining Pipe Market Volume & Revenue, By Region, 2018 – 2023 (Thousand Tons) (USD Million) 119
TABLE NO. 39. : Global Others Mining Pipe Market Volume & Revenue, By Region, 2024 – 2032 (Thousand Tons) (USD Million) 119
TABLE NO. 40. : Global Mining Pipe Market Volume & Revenue, By Region, 2018 – 2023 (Thousand Tons) (USD Million) 124
TABLE NO. 41. : Global Mining Pipe Market Volume & Revenue, By Region, 2024 – 2032 (Thousand Tons) (USD Million) 124
TABLE NO. 42. : Global Mining Pipe Market Volume & Revenue, By Product Type, 2018 – 2023 (Thousand Tons) (USD Million) 125
TABLE NO. 43. : Global Mining Pipe Market Volume & Revenue, By Product Type, 2024 – 2032 (Thousand Tons) (USD Million) 125
TABLE NO. 44. : Global Mining Pipe Market Volume & Revenue, By Material Type, 2018 – 2023 (Thousand Tons) (USD Million) 126
TABLE NO. 45. : Global Mining Pipe Market Volume & Revenue, By Material Type, 2024 – 2032 (Thousand Tons) (USD Million) 126
TABLE NO. 46. : Global Mining Pipe Market Volume & Revenue, By Pipe Size, 2018 – 2023 (Thousand Tons) (USD Million) 127
TABLE NO. 47. : Global Mining Pipe Market Volume & Revenue, By Pipe Size, 2024 – 2032 (Thousand Tons) (USD Million) 127
TABLE NO. 48. : Global Mining Pipe Market Volume & Revenue, By Application, 2018 – 2023 (Thousand Tons) (USD Million) 128
TABLE NO. 49. : Global Mining Pipe Market Volume & Revenue, By Application, 2024 – 2032 (Thousand Tons) (USD Million) 128
TABLE NO. 50. : North America Mining Pipe Market Volume, By Country, 2018 – 2023 (Thousand Tons) 130
TABLE NO. 51. : North America Mining Pipe Market Volume, By Country, 2024 – 2032 (Thousand Tons) 130
TABLE NO. 52. : North America Mining Pipe Market Revenue, By Country, 2018 – 2023 (USD Million) 131
TABLE NO. 53. : North America Mining Pipe Market Revenue, By Country, 2024 – 2032 (USD Million) 131
TABLE NO. 54. : North America Mining Pipe Market Volume, By Product Type, 2018 – 2023 (Thousand Tons) 132
TABLE NO. 55. : North America Mining Pipe Market Volume, By Product Type, 2024 – 2032 (Thousand Tons) 132
TABLE NO. 56. : North America Mining Pipe Market Revenue, By Product Type, 2018 – 2023 (USD Million) 133
TABLE NO. 57. : North America Mining Pipe Market Revenue, By Product Type, 2024 – 2032 (USD Million) 133
TABLE NO. 58. : North America Mining Pipe Market Volume, By Material Type, 2018 – 2023 (Thousand Tons) 134
TABLE NO. 59. : North America Mining Pipe Market Volume, By Material Type, 2024 – 2032 (Thousand Tons) 134
TABLE NO. 60. : North America Mining Pipe Market Revenue, By Material Type, 2018 – 2023 (USD Million) 135
TABLE NO. 61. : North America Mining Pipe Market Revenue, By Material Type, 2024 – 2032 (USD Million) 135
TABLE NO. 62. : North America Mining Pipe Market Volume, By Pipe Size, 2018 – 2023 (Thousand Tons) 136
TABLE NO. 63. : North America Mining Pipe Market Volume, By Pipe Size, 2024 – 2032 (Thousand Tons) 136
TABLE NO. 64. : North America Mining Pipe Market Revenue, By Pipe Size, 2018 – 2023 (USD Million) 137
TABLE NO. 65. : North America Mining Pipe Market Revenue, By Pipe Size, 2024 – 2032 (USD Million) 137
TABLE NO. 66. : North America Mining Pipe Market Volume, By Application, 2018 – 2023 (Thousand Tons) 138
TABLE NO. 67. : North America Mining Pipe Market Volume, By Application, 2024 – 2032 (Thousand Tons) 138
TABLE NO. 68. : North America Mining Pipe Market Revenue, By Application, 2018 – 2023 (USD Million) 139
TABLE NO. 69. : North America Mining Pipe Market Revenue, By Application, 2024 – 2032 (USD Million) 139
TABLE NO. 70. : Europe Mining Pipe Market Volume, By Country, 2018 – 2023 (Thousand Tons) 142
TABLE NO. 71. : Europe Mining Pipe Market Volume, By Country, 2024 – 2032 (Thousand Tons) 142
TABLE NO. 72. : Europe Mining Pipe Market Revenue, By Country, 2018 – 2023 (USD Million) 143
TABLE NO. 73. : Europe Mining Pipe Market Revenue, By Country, 2024 – 2032 (USD Million) 143
TABLE NO. 74. : Europe Mining Pipe Market Volume, By Product Type, 2018 – 2023 (Thousand Tons) 144
TABLE NO. 75. : Europe Mining Pipe Market Volume, By Product Type, 2024 – 2032 (Thousand Tons) 144
TABLE NO. 76. : Europe Mining Pipe Market Revenue, By Product Type, 2018 – 2023 (USD Million) 145
TABLE NO. 77. : Europe Mining Pipe Market Revenue, By Product Type, 2024 – 2032 (USD Million) 145
TABLE NO. 78. : Europe Mining Pipe Market Volume, By Material Type, 2018 – 2023 (Thousand Tons) 146
TABLE NO. 79. : Europe Mining Pipe Market Volume, By Material Type, 2024 – 2032 (Thousand Tons) 146
TABLE NO. 80. : Europe Mining Pipe Market Revenue, By Material Type, 2018 – 2023 (USD Million) 147
TABLE NO. 81. : Europe Mining Pipe Market Revenue, By Material Type, 2024 – 2032 (USD Million) 147
TABLE NO. 82. : Europe Mining Pipe Market Volume, By Pipe Size, 2018 – 2023 (Thousand Tons) 148
TABLE NO. 83. : Europe Mining Pipe Market Volume, By Pipe Size, 2024 – 2032 (Thousand Tons) 148
TABLE NO. 84. : Europe Mining Pipe Market Revenue, By Pipe Size, 2018 – 2023 (USD Million) 149
TABLE NO. 85. : Europe Mining Pipe Market Revenue, By Pipe Size, 2024 – 2032 (USD Million) 149
TABLE NO. 86. : Europe Mining Pipe Market Volume, By Application, 2018 – 2023 (Thousand Tons) 150
TABLE NO. 87. : Europe Mining Pipe Market Volume, By Application, 2024 – 2032 (Thousand Tons) 150
TABLE NO. 88. : Europe Mining Pipe Market Revenue, By Application, 2018 – 2023 (USD Million) 151
TABLE NO. 89. : Europe Mining Pipe Market Revenue, By Application, 2024 – 2032 (USD Million) 151
TABLE NO. 90. : Asia Pacific Mining Pipe Market Volume, By Country, 2018 – 2023 (Thousand Tons) 154
TABLE NO. 91. : Asia Pacific Mining Pipe Market Volume, By Country, 2024 – 2032 (Thousand Tons) 154
TABLE NO. 92. : Asia Pacific Mining Pipe Market Revenue, By Country, 2018 – 2023 (USD Million) 155
TABLE NO. 93. : Asia Pacific Mining Pipe Market Revenue, By Country, 2024 – 2032 (USD Million) 155
TABLE NO. 94. : Asia Pacific Mining Pipe Market Volume, By Product Type, 2018 – 2023 (Thousand Tons) 156
TABLE NO. 95. : Asia Pacific Mining Pipe Market Volume, By Product Type, 2024 – 2032 (Thousand Tons) 156
TABLE NO. 96. : Asia Pacific Mining Pipe Market Revenue, By Product Type, 2018 – 2023 (USD Million) 157
TABLE NO. 97. : Asia Pacific Mining Pipe Market Revenue, By Product Type, 2024 – 2032 (USD Million) 157
TABLE NO. 98. : Asia Pacific Mining Pipe Market Volume, By Material Type, 2018 – 2023 (Thousand Tons) 158
TABLE NO. 99. : Asia Pacific Mining Pipe Market Volume, By Material Type, 2024 – 2032 (Thousand Tons) 158
TABLE NO. 100. : Asia Pacific Mining Pipe Market Revenue, By Material Type, 2018 – 2023 (USD Million) 159
TABLE NO. 101. : Asia Pacific Mining Pipe Market Revenue, By Material Type, 2024 – 2032 (USD Million) 159
TABLE NO. 102. : Asia Pacific Mining Pipe Market Volume, By Pipe Size, 2018 – 2023 (Thousand Tons) 160
TABLE NO. 103. : Asia Pacific Mining Pipe Market Volume, By Pipe Size, 2024 – 2032 (Thousand Tons) 160
TABLE NO. 104. : Asia Pacific Mining Pipe Market Revenue, By Pipe Size, 2018 – 2023 (USD Million) 161
TABLE NO. 105. : Asia Pacific Mining Pipe Market Revenue, By Pipe Size, 2024 – 2032 (USD Million) 161
TABLE NO. 106. : Asia Pacific Mining Pipe Market Volume, By Application, 2018 – 2023 (Thousand Tons) 162
TABLE NO. 107. : Asia Pacific Mining Pipe Market Volume, By Application, 2024 – 2032 (Thousand Tons) 162
TABLE NO. 108. : Asia Pacific Mining Pipe Market Revenue, By Application, 2018 – 2023 (USD Million) 163
TABLE NO. 109. : Asia Pacific Mining Pipe Market Revenue, By Application, 2024 – 2032 (USD Million) 163
TABLE NO. 110. : Latin America Mining Pipe Market Volume, By Country, 2018 – 2023 (Thousand Tons) 166
TABLE NO. 111. : Latin America Mining Pipe Market Volume, By Country, 2024 – 2032 (Thousand Tons) 166
TABLE NO. 112. : Latin America Mining Pipe Market Revenue, By Country, 2018 – 2023 (USD Million) 167
TABLE NO. 113. : Latin America Mining Pipe Market Revenue, By Country, 2024 – 2032 (USD Million) 167
TABLE NO. 114. : Latin America Mining Pipe Market Volume, By Product Type, 2018 – 2023 (Thousand Tons) 168
TABLE NO. 115. : Latin America Mining Pipe Market Volume, By Product Type, 2024 – 2032 (Thousand Tons) 168
TABLE NO. 116. : Latin America Mining Pipe Market Revenue, By Product Type, 2018 – 2023 (USD Million) 169
TABLE NO. 117. : Latin America Mining Pipe Market Revenue, By Product Type, 2024 – 2032 (USD Million) 169
TABLE NO. 118. : Latin America Mining Pipe Market Volume, By Material Type, 2018 – 2023 (Thousand Tons) 170
TABLE NO. 119. : Latin America Mining Pipe Market Volume, By Material Type, 2024 – 2032 (Thousand Tons) 170
TABLE NO. 120. : Latin America Mining Pipe Market Revenue, By Material Type, 2018 – 2023 (USD Million) 171
TABLE NO. 121. : Latin America Mining Pipe Market Revenue, By Material Type, 2024 – 2032 (USD Million) 171
TABLE NO. 122. : Latin America Mining Pipe Market Volume, By Pipe Size, 2018 – 2023 (Thousand Tons) 172
TABLE NO. 123. : Latin America Mining Pipe Market Volume, By Pipe Size, 2024 – 2032 (Thousand Tons) 172
TABLE NO. 124. : Latin America Mining Pipe Market Revenue, By Pipe Size, 2018 – 2023 (USD Million) 173
TABLE NO. 125. : Latin America Mining Pipe Market Revenue, By Pipe Size, 2024 – 2032 (USD Million) 173
TABLE NO. 126. : Latin America Mining Pipe Market Volume, By Application, 2018 – 2023 (Thousand Tons) 174
TABLE NO. 127. : Latin America Mining Pipe Market Volume, By Application, 2024 – 2032 (Thousand Tons) 174
TABLE NO. 128. : Latin America Mining Pipe Market Revenue, By Application, 2018 – 2023 (USD Million) 175
TABLE NO. 129. : Latin America Mining Pipe Market Revenue, By Application, 2024 – 2032 (USD Million) 175
TABLE NO. 130. : Middle East Mining Pipe Market Volume, By Country, 2018 – 2023 (Thousand Tons) 178
TABLE NO. 131. : Middle East Mining Pipe Market Volume, By Country, 2024 – 2032 (Thousand Tons) 178
TABLE NO. 132. : Middle East Mining Pipe Market Revenue, By Country, 2018 – 2023 (USD Million) 179
TABLE NO. 133. : Middle East Mining Pipe Market Revenue, By Country, 2024 – 2032 (USD Million) 179
TABLE NO. 134. : Middle East Mining Pipe Market Volume, By Product Type, 2018 – 2023 (Thousand Tons) 180
TABLE NO. 135. : Middle East Mining Pipe Market Volume, By Product Type, 2024 – 2032 (Thousand Tons) 180
TABLE NO. 136. : Middle East Mining Pipe Market Revenue, By Product Type, 2018 – 2023 (USD Million) 181
TABLE NO. 137. : Middle East Mining Pipe Market Revenue, By Product Type, 2024 – 2032 (USD Million) 181
TABLE NO. 138. : Middle East Mining Pipe Market Volume, By Material Type, 2018 – 2023 (Thousand Tons) 182
TABLE NO. 139. : Middle East Mining Pipe Market Volume, By Material Type, 2024 – 2032 (Thousand Tons) 182
TABLE NO. 140. : Middle East Mining Pipe Market Revenue, By Material Type, 2018 – 2023 (USD Million) 183
TABLE NO. 141. : Middle East Mining Pipe Market Revenue, By Material Type, 2024 – 2032 (USD Million) 183
TABLE NO. 142. : Middle East Mining Pipe Market Volume, By Pipe Size, 2018 – 2023 (Thousand Tons) 184
TABLE NO. 143. : Middle East Mining Pipe Market Volume, By Pipe Size, 2024 – 2032 (Thousand Tons) 184
TABLE NO. 144. : Middle East Mining Pipe Market Revenue, By Pipe Size, 2018 – 2023 (USD Million) 185
TABLE NO. 145. : Middle East Mining Pipe Market Revenue, By Pipe Size, 2024 – 2032 (USD Million) 185
TABLE NO. 146. : Middle East Mining Pipe Market Volume, By Application, 2018 – 2023 (Thousand Tons) 186
TABLE NO. 147. : Middle East Mining Pipe Market Volume, By Application, 2024 – 2032 (Thousand Tons) 186
TABLE NO. 148. : Middle East Mining Pipe Market Revenue, By Application, 2018 – 2023 (USD Million) 187
TABLE NO. 149. : Middle East Mining Pipe Market Revenue, By Application, 2024 – 2032 (USD Million) 187
TABLE NO. 150. : Africa Mining Pipe Market Volume, By Country, 2018 – 2023 (Thousand Tons) 190
TABLE NO. 151. : Africa Mining Pipe Market Volume, By Country, 2024 – 2032 (Thousand Tons) 190
TABLE NO. 152. : Africa Mining Pipe Market Revenue, By Country, 2018 – 2023 (USD Million) 191
TABLE NO. 153. : Africa Mining Pipe Market Revenue, By Country, 2024 – 2032 (USD Million) 191
TABLE NO. 154. : Africa Mining Pipe Market Volume, By Product Type, 2018 – 2023 (Thousand Tons) 192
TABLE NO. 155. : Africa Mining Pipe Market Volume, By Product Type, 2024 – 2032 (Thousand Tons) 192
TABLE NO. 156. : Africa Mining Pipe Market Revenue, By Product Type, 2018 – 2023 (USD Million) 193
TABLE NO. 157. : Africa Mining Pipe Market Revenue, By Product Type, 2024 – 2032 (USD Million) 193
TABLE NO. 158. : Africa Mining Pipe Market Volume, By Material Type, 2018 – 2023 (Thousand Tons) 194
TABLE NO. 159. : Africa Mining Pipe Market Volume, By Material Type, 2024 – 2032 (Thousand Tons) 194
TABLE NO. 160. : Africa Mining Pipe Market Revenue, By Material Type, 2018 – 2023 (USD Million) 195
TABLE NO. 161. : Africa Mining Pipe Market Revenue, By Material Type, 2024 – 2032 (USD Million) 195
TABLE NO. 162. : Africa Mining Pipe Market Volume, By Pipe Size, 2018 – 2023 (Thousand Tons) 196
TABLE NO. 163. : Africa Mining Pipe Market Volume, By Pipe Size, 2024 – 2032 (Thousand Tons) 196
TABLE NO. 164. : Africa Mining Pipe Market Revenue, By Pipe Size, 2018 – 2023 (USD Million) 197
TABLE NO. 165. : Africa Mining Pipe Market Revenue, By Pipe Size, 2024 – 2032 (USD Million) 197
TABLE NO. 166. : Africa Mining Pipe Market Volume, By Application, 2018 – 2023 (Thousand Tons) 198
TABLE NO. 167. : Africa Mining Pipe Market Volume, By Application, 2024 – 2032 (Thousand Tons) 198
TABLE NO. 168. : Africa Mining Pipe Market Revenue, By Application, 2018 – 2023 (USD Million) 199
TABLE NO. 169. : Africa Mining Pipe Market Revenue, By Application, 2024 – 2032 (USD Million) 199