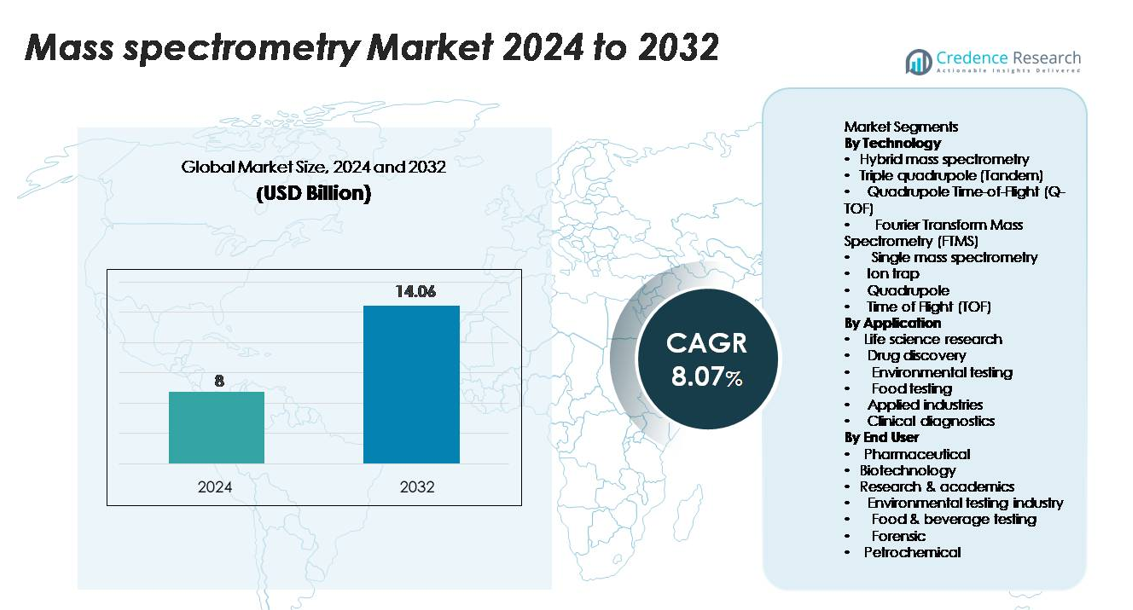
Home » Biotechnology » Mass Spectrometry Market

Mass Spectrometry Market By Price Range (Low, Medium, High)-Growth, Future Prospects & Competitive Analysis, 2016 – 2030

Price: $4999

Published: | Report ID: 8586 | Report Format : PDF

Market Insights

  • The international mass spectrometry marketplace is projected to reach USD 9,478.65 million by 2030, growing at a CAGR of 7.50% from 2023 to 2030.
  • Proteomics is the leading application marketplace for mass spectrometry, driven by the increasing focus on understanding the structure and function of proteins in various biological methods.
  • The pharmaceutical and biotechnology businesses section dominated the marketplace in 2022 due to the large use of mass spectrometry in drug discovery, development, and satisfactory control procedures.
  • The devices segment accounted for over 75% of the marketplace share in 2022, indicating the massive demand for superior mass spectrometry contraptions across various industries.
  • Quadrupole liquid chromatography-mass spectrometry (LC-MS) held the largest share of over 30%, reflecting its huge variety of applications in pharmaceuticals, environmental evaluation, and forensic sciences.
  • Europe was the leading regional marketplace, preserving over 25% of the global market share, attributed to the presence of mounted pharmaceutical and biotechnology agencies and supportive government initiatives.

Mass Spectrometry Market

Executive Summary

Market Definition

The global mass spectrometry market is experiencing robust growth because of several key elements. The marketplace is expected to witness a steady CAGR of 7.50% during the forecast, attaining a price of USD 9,478.65 million by 2030. The increasing demand for drug discovery and development, advancements in analytical techniques, growing awareness of food and environmental safety, growing R&D investments, and the prevalence of chronic illnesses are driving market growth.

However, the high cost of units, the absence of professional experts, and complicated data evaluation pose demanding situations for marketplace growth. Nevertheless, emerging markets, technological developments, collaborations and partnerships, and the emergence of precision medicine and personalized healthcare provide extensive growth possibilities inside the mass spectrometry marketplace.

Design Element 2

Access crucial information at unmatched prices!

Request your free sample report today & start making informed decisions powered by Credence Research!

Download Free Sample
CTA Design Element 3

Market Overview

The mass spectrometry market refers to using analytical techniques to measure and analyze the mass-to-charge ratio of ions. It has become indispensable in various industries, including pharmaceuticals, biotechnology, environmental analysis, food and beverage, and medical diagnostics.

Mass spectrometry permits precise identity, quantification, and characterization of molecules, making it treasured for research, quality control, and safety guarantee functions.

What Are the Main Drivers of the Mass Spectrometry Market?

The main drivers of the Mass Spectrometry Market include increasing demand for drug discovery and development, advancements in analytical techniques, growing focus on food and environmental safety, emerging R&D investments, and increasing prevalence of chronic diseases.

What Are The Major Challenges Faced By the Mass Spectrometry Market?

The major challenges faced by the Mass Spectrometry Market include the high cost of instruments, lack of skilled professionals, and complex data analysis.

What Are The Growth Opportunities In the Mass Spectrometry Market?

The growth opportunities in the Mass Spectrometry Market include emerging markets, technological advancements, collaboration and partnerships, and precision medicine and personalized healthcare.

Increasing Demand for Drug Discovery and Development

The demand for mass spectrometry in drug discovery and processes is developing rapidly. Mass spectrometry techniques play an important role in drug metabolism research, identification of drug goals, pharmacokinetics, and drug-drug interplay research.

The capacity to investigate complex biological samples and locate trace degrees of compounds makes mass spectrometry critical in early-stage drug development, ensuring drug safety and efficacy.

Advancements in Analytical Techniques

Technological advancements in mass spectrometry have revolutionized the sphere, permitting excessive decision evaluation, faster data acquisition, and improved sensitivity. The development of hybrid mass spectrometers, which includes triple quadrupole and quadrupole time-of-flight gadgets, has accelerated the utility areas and improved the overall performance of mass spectrometry.

These developments have superior accuracy, precision, and evaluation speed, riding mass spectrometry’s adoption in numerous industries.

Growing Focus on Food and Environmental Safety

The growing worries concerning food safety, environmental pollutants, and the need for accurate analysis of contaminants have boosted the demand for mass spectrometry. Mass spectrometry allows for easier detection and quantifying of insecticides, pollutants, heavy metals, and dangerous substances in food, water, and environmental samples. Regulatory bodies and companies increasingly rely upon mass spectrometry to ensure compliance with safety requirements and protect public health.

Mass Spectrometry Market

Emerging R&D Investments

The continuous investments in research and development activities throughout industries are propelling the growth of the mass spectrometry marketplace. Governments, academic establishments, and private organizations are allocating considerable funds to growth analytical techniques, develop novel units, and discover new applications of mass spectrometry. These investments power innovation and lead to the introduction of advanced mass spectrometry platforms, expanding the market further.

Increasing Prevalence of Chronic Diseases

The emerging prevalence of chronic illnesses, consisting of cancer, diabetes, cardiovascular diseases, and neurological issues, has created a sizeable demand for accurate diagnostics and personalized medical procedures.

Mass spectrometry is vital in biomarker discovery, disorder profiling, therapeutic drug monitoring, and precision medicine. Its capability to analyze complicated biological samples and identify precise molecular signatures makes it beneficial in disease research and medical practice.

High Cost of Instruments

The excessive cost associated with mass spectrometry gadgets is a major restraint for market growth. Mass spectrometers are complicated and complex devices requiring massive procurement and maintenance investments.

The cost of consumables, such as reagents, columns, and standards, adds to the general prices. The high cost of instruments limits their adoption, specifically in smaller research laboratories and resource-restrained regions.

Lack of Skilled Professionals

The effective usage of mass spectrometry requires skilled professionals with an understanding of instrument operation, method development, and data analysis. However, there’s a shortage of well-educated and skilled employees in mass spectrometry. The lack of professional experts hampers the widespread adoption of mass spectrometry techniques and limits the correct interpretation of complex data generated through these contraptions.

Complex Data Analysis

Mass spectrometry generates sizeable quantities of data that require sophisticated data analysis equipment and algorithms for meaningful interpretation. The complexity of data analysis poses a sizable challenge to many users, particularly those missing expertise in bioinformatics and data analysis. The need for superior data analysis competencies and dedicated computational resources can prevent the efficient utilization of mass spectrometry and limit its adoption in certain applications.

Emerging Markets

Emerging markets, mainly in Asia-Pacific and Latin America, present widespread growth opportunities for mass spectrometry. These regions have witnessed rapid economic growth, increasing investments in healthcare infrastructure, and rising research activities.

The increasing pharmaceutical and biotechnology industries and favorable government initiatives create a favorable environment for adopting mass spectrometry technologies.

Technological Advancements

Continuous developments in mass spectrometry generation open up new opportunities for marketplace growth. Miniaturization of instruments, development of transportable mass spectrometers, and integration of multiple analytical techniques expand the application areas and make mass spectrometry more accessible. Introducing high-decision mass spectrometry systems and novel ionization techniques also contribute to improved performance and sensitivity.

Collaboration and Partnerships

Collaborations and partnerships among academic establishments, research organizations, and industry players are key opportunities for the mass spectrometry market. Collaborative efforts enable knowledge sharing, access to expertise, and pooling sources for research and development projects.

Partnerships among instrument producers and pharmaceutical businesses can cause the development of custom-designed solutions and boost the adoption of mass spectrometry in drug discovery and clinical diagnostics.

Precision Medicine and Personalized Healthcare

The emergence of precision medicine and personalized healthcare presents significant possibilities for mass spectrometry. Mass spectrometry techniques permit the identification of biomarkers, molecular profiling, and focused drug delivery based on individual patient characteristics.

The capability to research small pattern volumes and discover low-abundance molecules makes mass spectrometry a perfect tool for customized medicine, permitting tailor-made treatments and improved patient outcomes.

Competitive Landscape

The global mass spectrometry market is exceedingly competitive, with numerous key players dominating the market. These players focus on technological advancements, product development, strategic collaborations, and acquisitions to reinforce their market position.

They also invest in research and development activities to make their product portfolios bigger and cater to the evolving needs of end-users. Some distinguished players in the marketplace include Thermo Fisher Scientific Inc., Agilent Technologies, Inc., Shimadzu Corporation, Waters Corporation, and Bruker Corporation.

Key Players

The Mass Spectrometry market is highly competitive, with several key players. Some of the major players in the market and their market share are as follows:

  • Thermo Fisher Scientific
  • Agilent Technologies
  • SCIEX
  • Bruker Corporation
  • Shimadzu Corporation
  • Waters Corporation

These key players constantly engage in strategic initiatives, which include partnerships, collaborations, acquisitions, and new product launches to reinforce their marketplace position. They invest significantly in research and developments to introduce technologically advanced mass spectrometry systems.

Furthermore, these players provide comprehensive support services, including training, maintenance, and application support, to ensure customer satisfaction.

Summary of Key Findings

  • The international mass spectrometry market is projected to reach USD 9,478.65 million by 2030, growing at a CAGR of 7.50% from 2023 to 2030.
  • Proteomics is the leading software market, driven by the growing attention on understanding protein structure and features.
  • The pharmaceutical and biotechnology organizations sectors ruled the market in 2022, thanks to the considerable use of mass spectrometry in drug discovery and development.
  • Quadrupole liquid chromatography-mass spectrometry (LC-MS) accounted for the largest marketplace share of over 30%, reflecting its huge range of applications.
  • Europe held the biggest regional market percentage of over 25%, supported by established pharmaceutical and biotechnology industries.

Shape Your Report to Specific Countries or Regions & Enjoy 30% Off!

Future Outlook

  • The mass spectrometry market is poised for significant growth in the coming years.
  • Advancements in technology, the growing focus on personalized healthcare, and expanding programs in emerging markets will drive the marketplace forward.
  • The market is expected to consolidate through strategic partnerships, acquisitions, and collaborations among industry players.
  • However, addressing the challenges associated with the high cost of instruments, the absence of professional specialists, and complex data analysis could be vital for sustained market expansion.

Segmentation

By Price Range

  • Low
  • Medium
  • High

By Region

  • North America
  • US.
  • Canada
  • Mexico

Europe

  • Germany
  • France
  • U.K.
  • Italy
  • Spain
  • Rest of Europe

Asia Pacific

  • China
  • Japan
  • India
  • South Korea
  • South-east Asia
  • Rest of Asia Pacific

Latin America

  • Brazil
  • Argentina
  • Rest of Latin America

Middle East & Africa

  • GCC Countries
  • South Africa
  • Rest of Middle East and Africa

CHAPTER NO. 1 : INTRODUCTION 21

1.1. Report Description 21

1.1.1. Purpose of the Report 21

1.1.2. USP & Key Offerings 21

1.2. Key Benefits for Stakeholders 21

1.3. Target Audience 22

1.4. Report Scope 22


CHAPTER NO. 2 : EXECUTIVE SUMMARY 26

2.1. Mass Spectrometry Market Snapshot 26

2.2. Global Mass Spectrometry Market, 2017 – 2030 (K units) (USD Million) 28

2.1. Insights from Primary Respondents 28


CHAPTER NO. 3 : COVID 19 IMPACT ANALYSIS 29

3.1. Impact Assessment of COVID-19 Pandemic, By Region 29


CHAPTER NO. 4 : MASS SPECTROMETRY MARKET – INDUSTRY ANALYSIS 30

4.1. Introduction 30

4.2. Market Drivers 31

4.2.1. Increasing Demand for Drug Discovery and Development 31

4.2.2. Growing Focus on Food and Environmental Safety 32

4.3. Market Restraints 32

4.3.1. Restraining Factor Analysis 32

4.4. Market Opportunities 33

4.4.1. Market Opportunity Analysis 33

4.5. Porter’s Five Forces Analysis 33

4.6. Value Chain Analysis 34


CHAPTER NO. 5 : KEY INVESTMENT POCKETS ANALYSIS 35

5.1. Top Investment Pockets 35

5.1.1.1. Mass Spectrometry Market Attractiveness Analysis, By Type 35

5.1.1.2. Mass Spectrometry Market Attractiveness Analysis, By Application 35

5.1.1.3. Mass Spectrometry Market Attractiveness Analysis, By End-user 36

5.1.1.4. Mass Spectrometry Market Attractiveness Analysis, By Technology 36

5.2. Product Life Cycle Analysis 37

5.3. Incremental Revenue Growth Opportunity, 2023 – 2030 38

5.3.1. Type 38

5.3.2. Application 38

5.3.3. End-user 39

5.3.4. Technology 39


CHAPTER NO. 6 : IMPORT EXPORT ANALYSIS 40

6.1. Import Analysis by Region 40

6.1.1. Global Mass Spectrometry Market Import Volume, By Region, 2017 – 2022 (K units) 40

6.2. Export Analysis by Region 40

6.2.1. Global Mass Spectrometry Market Export Volume, By Region, 2017 – 2022 (K units) 40


CHAPTER NO. 7 : DEMAND SUPPLY ANALYSIS 41

7.1. Demand Analysis by Region 41

7.1.1. Global Mass Spectrometry Market Demand Volume, By Region, 2017 – 2022 (K units) 41

7.2. Supply Analysis by Region 41

7.2.1. Global Mass Spectrometry Market Supply Volume, By Region, 2017 – 2022 (K units) 41


CHAPTER NO. 8 : MARKET POSITIONING OF KEY PLAYERS 42

8.1. Company Market Share Analysis –2020 and 2022 42

8.1.1. Global Mass Spectrometry Market: Company Market Share, 2022 42

8.1.2. Global Mass Spectrometry Market: Company Market Share, 2022 42

8.1. Global Mass Spectrometry Market Company Volume Market Share, 2022 43

8.2. Global Mass Spectrometry Market Company Revenue Market Share, 2022 44

8.3. Market Position of Key Players 2022 45

8.3.1. Market Position of Key Players, 2022 45

8.4. Strategic Developments 46

8.4.1. Acquisitions & Mergers 46

8.4.2. New Product Launch 46

8.4.3. Regional Expansion 46


CHAPTER NO. 9 : MASS SPECTROMETRY MARKET – BY TYPE SEGMENT ANALYSIS 47

9.1. Mass Spectrometry Market Overview, by Type Segment 47

9.1.1. Global Mass Spectrometry Market Volume Share, By Type, 2022 & 2030 48

9.1.2. Global Mass Spectrometry Market Revenue Share, By Type, 2022 & 2030 48

9.2. Instruments 49

9.2.1. Global Instruments Mass Spectrometry Market Volume, By Region, 2017 – 2022 (K units) 49

9.2.2. Global Instruments Mass Spectrometry Market Revenue, By Region, 2017 – 2022 (USD Million) 50

9.3. Consumables & Services 51

9.3.1. Global Consumables & Services Mass Spectrometry Market Volume, By Region, 2017 – 2022 (K units) 51

9.3.2. Global Instruments Mass Spectrometry Market Revenue, By Region, 2017 – 2022 (USD Million) 52


CHAPTER NO. 10 : MASS SPECTROMETRY MARKET – BY APPLICATION SEGMENT ANALYSIS 59

10.1. Mass Spectrometry Market Overview, by Application Segment 59

10.1.1. Global Mass Spectrometry Market Volume Share, By Application, 2022 & 2030 60

10.1.2. Global Mass Spectrometry Market Revenue Share, By Application, 2022 & 2030 60

10.2. Proteomics 61

10.2.1. Global Mass Spectrometry for Proteomics  Market Volume, By Region, 2017 – 2022 (K units) 61

10.2.2. Global Mass Spectrometry for Proteomics  Market Revenue, By Region, 2017 – 2022 (USD Million) 62

10.3. Metabolomics  63

10.3.1. Global Mass Spectrometry for Metabolomics   Market Volume, By Region, 2017 – 2022 (K units) 63

10.3.2. Global Mass Spectrometry for Metabolomics   Market Revenue, By Region, 2017 – 2022 (USD Million) 64

10.4. Glycomics 65

10.4.1. Global Mass Spectrometry for Glycomics Market Volume, By Region, 2017 – 2022 (K units) 65

10.4.2. Global Mass Spectrometry for Glycomics Market Revenue, By Region, 2017 – 2022 (USD Million) 66


CHAPTER NO. 11 : MASS SPECTROMETRY MARKET – BY END-USER SEGMENT ANALYSIS 71

11.1. Mass Spectrometry Market Overview, by End-user Segment 71

11.1.1. Global Mass Spectrometry Market Volume Share, By End-user, 2022 & 2030 72

11.1.2. Global Mass Spectrometry Market Revenue Share, By End-user, 2022 & 2030 72

11.2. Government & Academic Institutions 73

11.2.1. Global Government & Academic Institutions Mass Spectrometry Market Volume, By Region, 2017 – 2022 (K units) 73

11.2.2. Global Government & Academic Institutions Mass Spectrometry Market Revenue, By Region, 2017 – 2022 (USD Million) 74

11.3. Pharmaceutical & Biotechnology Companies 75

11.3.1. Global Pharmaceutical & Biotechnology Companies Mass Spectrometry Market Volume, By Region, 2017 – 2022 (K units) 75

11.3.2. Global Pharmaceutical & Biotechnology Companies Mass Spectrometry Market Revenue, By Region, 2017 – 2022 (USD Million) 76


CHAPTER NO. 12 : MASS SPECTROMETRY MARKET – BY TECHNOLOGY SEGMENT ANALYSIS 83

12.1. Mass Spectrometry Market Overview, by Technology Segment 83

12.1.1. Global Mass Spectrometry Market Revenue Share, By Technology, 2022 & 2030 84

12.1.2. Global Mass Spectrometry Market Revenue Share, By Technology, 2022 & 2030 84

12.2. Quadrupole Liquid Chromatography-Mass Spectrometry 85

12.2.1. Global Quadrupole Liquid Chromatography-Mass Spectrometry Mass Spectrometry Market Volume, By Region, 2017 – 2022 (K units) 85

12.2.2. Global Quadrupole Liquid Chromatography-Mass Spectrometry Mass Spectrometry Market Revenue, By Region, 2017 – 2022 (USD Million) 86

12.3. Gas Chromatography-Mass Spectrometry (GC-MS) 87

12.3.1. Global Gas Chromatography-Mass Spectrometry (GC-MS) Mass Spectrometry Market Volume, By Region, 2017 – 2022 (K units) 87

12.3.2. Global Gas Chromatography-Mass Spectrometry (GC-MS) Mass Spectrometry Market Revenue, By Region, 2017 – 2022 (USD Million) 88

12.4. Fourier Transform-Mass Spectrometry (FT-MS) 89

12.4.1. Global Fourier Transform-Mass Spectrometry (FT-MS) Mass Spectrometry Market Volume, By Region, 2017 – 2022 (K units) 89

12.4.2. Global Fourier Transform-Mass Spectrometry (FT-MS) Mass Spectrometry Market Revenue, By Region, 2017 – 2022 (USD Million) 90

12.5. Time-of-Flight Mass Spectrometry (TOFMS) 91

12.5.1. Global Time-of-Flight Mass Spectrometry (TOFMS) Mass Spectrometry Market Volume, By Region, 2017 – 2022 (K units) 91

12.5.2. Global Time-of-Flight Mass Spectrometry (TOFMS) Mass Spectrometry Market Revenue, By Region, 2017 – 2022 (USD Million) 92

12.6. Others (MALDI-TOF, Magnetic Sector Mass Spectrometry, etc.) 93

12.6.1. Global Others (MALDI-TOF, Magnetic Sector Mass Spectrometry, etc.) Mass Spectrometry Market Volume, By Region, 2017 – 2022 (K units) 93

12.6.2. Global Others (MALDI-TOF, Magnetic Sector Mass Spectrometry, etc.) Mass Spectrometry Market Revenue, By Region, 2017 – 2022 (USD Million) 94


CHAPTER NO. 13 : MASS SPECTROMETRY MARKET – REGIONAL ANALYSIS 95

13.1. Mass Spectrometry Market Overview, by Region Segment 95

13.1.1. Global Mass Spectrometry Market Volume Share, By Region, 2022 & 2030 96

13.1.2. Global Mass Spectrometry Market Revenue Share, By Region, 2022 & 2030 96

13.1.3. Global Mass Spectrometry Market Volume, By Region, 2017 – 2022 (K units) 97

13.1.4. Global Mass Spectrometry Market Revenue, By Region, 2017 – 2022 (USD Million) 98

13.1.5. Global Mass Spectrometry Market Volume, By Type, 2017 – 2022 (K units) 99

13.1.6. Global Mass Spectrometry Market Revenue, By Type, 2017 – 2022 (USD Million) 100

13.1.7. Global Mass Spectrometry Market Volume, By Application, 2017 – 2022 (K units) 101

13.1.8. Global Mass Spectrometry Market Revenue, By Application, 2017 – 2022 (USD Million) 102

13.1.9. Global Mass Spectrometry Market Volume, By End-user, 2017 – 2022 (K units) 103

13.1.10. Global Mass Spectrometry Market Revenue, By End-user, 2017 – 2022 (USD Million) 104

13.1.11. Global Mass Spectrometry Market Volume, By Technology, 2017 – 2022 (K units) 105

13.1.12. Global Mass Spectrometry Market Revenue, By Technology, 2017 – 2022 (USD Million) 106

13.2. North America 107

13.2.1. North America Mass Spectrometry Market Volume, By Country, 2017 – 2022 (K units) 108

13.2.2. North America Mass Spectrometry Market Revenue, By Country, 2017 – 2022 (USD Million) 108

13.2.2.1. North America Mass Spectrometry Market Volume, By Type, 2017 – 2022 (K units) 109

13.2.3. North America Mass Spectrometry Market Revenue, By Type, 2017 – 2022 (USD Million) 110

13.2.4. North America Mass Spectrometry Market Volume, By Application, 2017 – 2022 (K units) 111

13.2.5. North America Mass Spectrometry Market Revenue, By Application, 2017 – 2022 (USD Million) 112

13.2.6. North America Mass Spectrometry Market Volume, By End-user, 2017 – 2022 (K units) 113

13.2.7. North America Mass Spectrometry Market Revenue, By End-user, 2017 – 2022 (USD Million) 114

13.2.8. North America Mass Spectrometry Market Volume, By Technology, 2017 – 2022 (K units) 115

13.2.9. North America Mass Spectrometry Market Revenue, By Technology, 2017 – 2022 (USD Million) 116

13.2.10. U.S. 117

13.2.11. Canada 117

13.2.12. Mexico 117

13.3. Europe 118

13.3.1. Europe Mass Spectrometry Market Volume, By Country, 2017 – 2022 (K units) 119

13.3.2. Europe Mass Spectrometry Market Revenue, By Country, 2017 – 2022 (USD Million) 120

13.3.3. Europe Mass Spectrometry Market Volume, By Type, 2017 – 2022 (K units) 121

13.3.4. Europe Mass Spectrometry Market Revenue, By Type, 2017 – 2022 (USD Million) 122

13.3.5. Europe Mass Spectrometry Market Volume, By Application, 2017 – 2022 (K units) 123

13.3.6. Europe Mass Spectrometry Market Revenue, By Application, 2017 – 2022 (USD Million) 124

13.3.7. Europe Mass Spectrometry Market Volume, By End-user, 2017 – 2022 (K units) 125

13.3.8. Europe Mass Spectrometry Market Revenue, By End-user, 2017 – 2022 (USD Million) 126

13.3.9. Europe Mass Spectrometry Market Volume, By Technology, 2017 – 2022 (K units) 127

13.3.10. Europe Mass Spectrometry Market Revenue, By Technology, 2017 – 2022 (USD Million) 128

13.3.11. UK 129

13.3.12. France 129

13.3.13. Germany 129

13.3.14. Italy 129

13.3.15. Spain 129

13.3.16. Russia 129

13.3.17. BENELUX 129

13.3.18. Sweden 129

13.3.19. Denmark 129

13.3.20. Poland 129

13.3.21. Austria 129

13.3.22. Rest of Europe 129

13.4. Asia Pacific 130

13.4.1. Asia Pacific Mass Spectrometry Market Volume, By Country, 2017 – 2022 (K units) 131

13.4.2. Asia Pacific Mass Spectrometry Market Revenue, By Country, 2017 – 2022 (USD Million) 132

13.4.3. Asia Pacific Mass Spectrometry Market Volume, By Type, 2017 – 2022 (K units) 133

13.4.4. Asia Pacific Mass Spectrometry Market Revenue, By Type, 2017 – 2022 (USD Million) 134

13.4.5. Asia Pacific Mass Spectrometry Market Volume, By Application, 2017 – 2022 (K units) 135

13.4.6. Asia Pacific Mass Spectrometry Market Revenue, By Application, 2017 – 2022 (USD Million) 136

13.4.7. Asia Pacific Mass Spectrometry Market Volume, By End-user, 2017 – 2022 (K units) 137

13.4.8. Asia Pacific Mass Spectrometry Market Revenue, By End-user, 2017 – 2022 (USD Million) 138

13.4.9. Asia Pacific Mass Spectrometry Market Volume, By Technology, 2017 – 2022 (K units) 139

13.4.10. Asia Pacific Mass Spectrometry Market Revenue, By Technology, 2017 – 2022 (USD Million) 140

13.4.11. China 141

13.4.12. Japan 141

13.4.13. South Korea 141

13.4.14. India 141

13.4.15. Thailand 141

13.4.16. Indonesia 141

13.4.17. Vietnam 141

13.4.18. Malaysia 141

13.4.19. Philippines 141

13.4.20. Taiwan 141

13.4.21. Rest of Asia Pacific 141

13.5. Latin America 142

13.5.1. Latin America Mass Spectrometry Market Volume, By Country, 2017 – 2022 (K units) 143

13.5.2. Latin America Mass Spectrometry Market Revenue, By Country, 2017 – 2022 (USD Million) 144

13.5.3. Latin America Mass Spectrometry Market Volume, By Type, 2017 – 2022 (K units) 145

13.5.4. Latin America Mass Spectrometry Market Revenue, By Type, 2017 – 2022 (USD Million) 146

13.5.5. Latin America Mass Spectrometry Market Volume, By Application, 2017 – 2022 (K units) 147

13.5.6. Latin America Mass Spectrometry Market Revenue, By Application, 2017 – 2022 (USD Million) 148

13.5.7. Latin America Mass Spectrometry Market Volume, By End-user, 2017 – 2022 (K units) 149

13.5.8. Latin America Mass Spectrometry Market Revenue, By End-user, 2017 – 2022 (USD Million) 150

13.5.9. Latin America Mass Spectrometry Market Volume, By Technology, 2017 – 2022 (K units) 151

13.5.10. Latin America Mass Spectrometry Market Revenue, By Technology, 2017 – 2022 (USD Million) 152

13.5.11. Brazil 153

13.5.12. Argentina 153

13.5.13. Colombia 153

13.5.14. Chile 153

13.5.15. Peru 153

13.5.16. Rest of Latin America 153

13.6. The Middle-East 154

13.6.1. Middle East Mass Spectrometry Market Volume, By Country, 2017 – 2022 (K units) 155

13.6.2. Middle East Mass Spectrometry Market Revenue, By Country, 2017 – 2022 (USD Million) 156

13.6.3. Middle East Mass Spectrometry Market Volume, By Type, 2017 – 2022 (K units) 157

13.6.4. Middle East Mass Spectrometry Market Revenue, By Type, 2017 – 2022 (USD Million) 158

13.6.5. Middle East Mass Spectrometry Market Volume, By Application, 2017 – 2022 (K units) 159

13.6.6. Middle East Mass Spectrometry Market Revenue, By Application, 2017 – 2022 (USD Million) 160

13.6.7. Middle East Mass Spectrometry Market Volume, By End-user, 2017 – 2022 (K units) 161

13.6.8. Middle East Mass Spectrometry Market Revenue, By End-user, 2017 – 2022 (USD Million) 162

13.6.9. Middle East Mass Spectrometry Market Volume, By Technology, 2017 – 2022 (K units) 163

13.6.10. Middle East Mass Spectrometry Market Revenue, By Technology, 2017 – 2022 (USD Million) 164

13.6.11. GCC Countries 165

13.6.12. Israel 165

13.6.13. Turkey 165

13.6.14. Iran 165

13.6.15. Rest of Middle East & Africa 165

13.7. Africa 166

13.7.1. Africa Mass Spectrometry Market Volume, By Country, 2017 – 2022 (K units) 167

13.7.2. Africa Mass Spectrometry Market Revenue, By Country, 2017 – 2022 (USD Million) 168

13.7.3. Africa Mass Spectrometry Market Volume, By Type, 2017 – 2022 (K units) 169

13.7.4. Africa Mass Spectrometry Market Revenue, By Type, 2017 – 2022 (USD Million) 170

13.7.5. Africa Mass Spectrometry Market Volume, By Application, 2017 – 2022 (K units) 171

13.7.6. Africa Mass Spectrometry Market Revenue, By Application, 2017 – 2022 (USD Million) 172

13.7.7. Africa Mass Spectrometry Market Volume, By End-user, 2017 – 2022 (K units) 173

13.7.8. Africa Mass Spectrometry Market Revenue, By End-user, 2017 – 2022 (USD Million) 174

13.7.9. Africa Mass Spectrometry Market Volume, By Technology, 2017 – 2022 (K units) 175

13.7.10. Africa Mass Spectrometry Market Revenue, By Technology, 2017 – 2022 (USD Million) 176

13.7.11. South Africa 177

13.7.12. Egypt 177

13.7.13. Nigeria 177

13.7.14. Algeria 177

13.7.15. Morocco 177

13.7.16. Rest of Africa 177


CHAPTER NO. 14 : COMPANY PROFILES 178

14.1. Thermo Fisher Scientific Inc. 178

14.1.1. Company Overview 178

14.1.2. Product Portfolio 178

14.1.3. Financial Overview 178

14.2. Agilent Technologies, Inc. 179

14.3. Waters Corporation 179

14.4. SCIEX 179

14.5. Shimadzu Corporation 179

14.6. Bruker Corporation 179

14.7. PerkinElmer, Inc. 179

14.8. Analytik Jena AG (Endress+Hauser) 179

14.9. Analytik Jena AG (Endress+Hauser)JEOL Ltd. 179

14.10. AB SCIEX Pte. Ltd. 179

14.11. LECO Corporation 179

14.12. Advion, Inc. 179

14.13. Rigaku Corporation 179

14.14. FLIR Systems, Inc. 179


CHAPTER NO. 15 : RESEARCH METHODOLOGY 180

15.1. Research Methodology 180

15.2. Phase I – Secondary Research 181

15.3. Phase II – Data Modeling 181

15.3.1. Company Share Analysis Model 182

15.3.2. Revenue Based Modeling 182

15.4. Phase III – Primary Research 183

15.5. Research Limitations 184

15.5.1. Assumptions 184

List of Figures

FIG NO. 1. Global Mass Spectrometry Market Volume & Revenue, 2017 – 2030 (K units) (USD Million) 28

FIG NO. 2. Porter’s Five Forces Analysis for Global Mass Spectrometry Market 33

FIG NO. 3. Value Chain Analysis for Global Mass Spectrometry Market 34

FIG NO. 4. Market Attractiveness Analysis, By Type 35

FIG NO. 5. Market Attractiveness Analysis, By Application 35

FIG NO. 6. Market Attractiveness Analysis, By End-user 36

FIG NO. 7. Market Attractiveness Analysis, By Technology 36

FIG NO. 8. Product Life Cycle Analysis 37

FIG NO. 9. Incremental Revenue Growth Opportunity by Type 38

FIG NO. 10. Incremental Revenue Growth Opportunity by Application 38

FIG NO. 11. Incremental Revenue Growth Opportunity by End-user 39

FIG NO. 12. Incremental Revenue Growth Opportunity by Technology 39

FIG NO. 13. Company Share Analysis, 2020 42

FIG NO. 14. Company Share Analysis, 2022 42

FIG NO. 15. Mass Spectrometry Market – Company Volume  Market Share, 2022 43

FIG NO. 16. Mass Spectrometry Market – Company Revenue Market Share, 2022 44

FIG NO. 17. Market Position of Key Players, 2022 45

FIG NO. 18. Global Mass Spectrometry Market Volume Share, By Type, 2022 & 2030 48

FIG NO. 19. Global Mass Spectrometry Market Revenue Share, By Type, 2022 & 2030 48

FIG NO. 20. Global Mass Spectrometry Market for Instruments, Volume & Revenue (K units) (USD Million) 2017 – 2030 49

FIG NO. 21. Global Mass Spectrometry Market for Consumables & Services, Volume & Revenue (K units) (USD Million) 2017 – 2030 51

FIG NO. 22. Global Mass Spectrometry Market for Type 3, Volume & Revenue (K units) (USD Million) 2017 – 2030 53

FIG NO. 23. Global Mass Spectrometry Market for Type 4, Volume & Revenue (K units) (USD Million) 2017 – 2030 55

FIG NO. 24. Global Mass Spectrometry Market for Type 5, Volume & Revenue (K units) (USD Million) 2017 – 2030 57

FIG NO. 25. Global Mass Spectrometry Market Volume Share, By Application, 2022 & 2030 60

FIG NO. 26. Global Mass Spectrometry Market Revenue Share, By Application, 2022 & 2030 60

FIG NO. 27. Global Mass Spectrometry Market for Proteomics , Volume & Revenue (K units) (USD Million) 2017 – 2030 61

FIG NO. 28. Global Mass Spectrometry Market for Metabolomics  , Volume & Revenue (K units) (USD Million) 2017 – 2030 63

FIG NO. 29. Global Mass Spectrometry Market for Glycomics, Volume & Revenue (K units) (USD Million) 2017 – 2030 65

FIG NO. 30. Global Mass Spectrometry Market for Application 4, Volume & Revenue (K units) (USD Million) 2017 – 2030 67

FIG NO. 31. Global Mass Spectrometry Market for Application 5, Volume & Revenue (K units) (USD Million) 2017 – 2030 69

FIG NO. 32. Global Mass Spectrometry Market Volume Share, By End-user, 2022 & 2030 72

FIG NO. 33. Global Mass Spectrometry Market Revenue Share, By End-user, 2022 & 2030 72

FIG NO. 34. Global Mass Spectrometry Market for Government & Academic Institutions, Volume & Revenue (K units) (USD Million) 2017 – 2030 73

FIG NO. 35. Global Mass Spectrometry Market for Pharmaceutical & Biotechnology Companies, Volume & Revenue (K units) (USD Million) 2017 – 2030 75

FIG NO. 36. Global Mass Spectrometry Market for End-user 3, Volume & Revenue (K units) (USD Million) 2017 – 2030 77

FIG NO. 37. Global Mass Spectrometry Market for End-user 4, Volume & Revenue (K units) (USD Million) 2017 – 2030 79

FIG NO. 38. Global Mass Spectrometry Market for End-user 5, Volume & Revenue (K units) (USD Million) 2017 – 2030 81

FIG NO. 39. Global Mass Spectrometry Market Revenue Share, By Technology, 2022 & 2030 84

FIG NO. 40. Global Mass Spectrometry Market Revenue Share, By Technology, 2022 & 2030 84

FIG NO. 41. Global Mass Spectrometry Market for Quadrupole Liquid Chromatography-Mass Spectrometry, Volume & Revenue (K units) (USD Million) 2017 – 2030 85

FIG NO. 42. Global Mass Spectrometry Market for Gas Chromatography-Mass Spectrometry (GC-MS), Volume & Revenue (K units) (USD Million) 2017 – 2030 87

FIG NO. 43. Global Mass Spectrometry Market for Fourier Transform-Mass Spectrometry (FT-MS), Volume & Revenue (K units) (USD Million) 2017 – 2030 89

FIG NO. 44. Global Mass Spectrometry Market for Time-of-Flight Mass Spectrometry (TOFMS), Volume & Revenue (K units) (USD Million) 2017 – 2030 91

FIG NO. 45. Global Mass Spectrometry Market for Others (MALDI-TOF, Magnetic Sector Mass Spectrometry, etc.), Volume & Revenue (K units) (USD Million) 2017 – 2030 93

FIG NO. 46. Global Mass Spectrometry Market Volume Share, By Region, 2022 & 2030 96

FIG NO. 47. Global Mass Spectrometry Market Revenue Share, By Region, 2022 & 2030 96

FIG NO. 48. North America Mass Spectrometry Market Volume & Revenue, 2017 – 2022 (K units) (USD Million) 107

FIG NO. 49. Europe Mass Spectrometry Market Volume & Revenue, 2017 – 2022 (K units) (USD Million) 118

FIG NO. 50. Asia Pacific Mass Spectrometry Market Volume & Revenue, 2017 – 2022 (K units) (USD Million) 130

FIG NO. 51. Latin America Mass Spectrometry Market Volume & Revenue, 2017 – 2022 (K units) (USD Million) 142

FIG NO. 52. The Middle-East Mass Spectrometry Market Volume & Revenue, 2017 – 2022 (K units) (USD Million) 154

FIG NO. 53. Africa Mass Spectrometry Market Volume & Revenue, 2017 – 2022 (K units) (USD Million) 166

FIG NO. 54. Research Methodology – Detailed View 180

FIG NO. 55. Research Methodology 181

List of Tables

TABLE NO. 1. : Global Mass Spectrometry Market: Snapshot 26

TABLE NO. 2. : Drivers for the Mass Spectrometry Market: Impact Analysis 31

TABLE NO. 3. : Restraints for the Mass Spectrometry Market: Impact Analysis 32

TABLE NO. 4. : Global Mass Spectrometry Market Import Volume, By End-user, 2017 – 2022 (K units) 40

TABLE NO. 5. : Global Mass Spectrometry Market Export Volume, By End-user, 2017 – 2022 (K units) 40

TABLE NO. 6. : Global Mass Spectrometry Market Demand Volume, By End-user, 2017 – 2022 (K units) 41

TABLE NO. 7. : Global Mass Spectrometry Market Supply Volume, By End-user, 2017 – 2022 (K units) 41

TABLE NO. 8. : Global Instruments Mass Spectrometry Market Volume, By Region, 2017 – 2022 (K units) 49

TABLE NO. 9. : Global Instruments Mass Spectrometry Market Volume, By Region, 2023– 2030 (K units) 49

TABLE NO. 10. : Global Instruments Mass Spectrometry Market Revenue, By Region, 2017 – 2022 (USD Million) 50

TABLE NO. 11. : Global Instruments Mass Spectrometry Market Revenue, By Region, 2023– 2030 (USD Million) 50

TABLE NO. 12. : Global Consumables & Services Mass Spectrometry Market Volume, By Region, 2017 – 2022 (K units) 51

TABLE NO. 13. : Global Consumables & Services Mass Spectrometry Market Volume, By Region, 2023– 2030 (K units) 51

TABLE NO. 14. : Global Instruments Mass Spectrometry Market Revenue, By Region, 2017 – 2022 (USD Million) 52

TABLE NO. 15. : Global Instruments Mass Spectrometry Market Revenue, By Region, 2023– 2030 (USD Million) 52

TABLE NO. 16. : Global Type 3 Mass Spectrometry Market Volume, By Region, 2017 – 2022 (K units) 53

TABLE NO. 17. : Global Type 3 Mass Spectrometry Market Volume, By Region, 2023– 2030 (K units) 53

TABLE NO. 18. : Global Type 3 Mass Spectrometry Market Revenue, By Region, 2017 – 2022 (USD Million) 54

TABLE NO. 19. : Global Type 3 Mass Spectrometry Market Revenue, By Region, 2023– 2030 (USD Million) 54

TABLE NO. 20. : Global Type 4 Mass Spectrometry Market Revenue, By Region, 2017 – 2022 (USD Million) 55

TABLE NO. 21. : Global Type 4 Mass Spectrometry Market Volume, By Region, 2023– 2030 (K units) 55

TABLE NO. 22. : Global Type 4 Mass Spectrometry Market Revenue, By Region, 2017 – 2022 (USD Million) 56

TABLE NO. 23. : Global Type 4 Mass Spectrometry Market Revenue, By Region, 2023– 2030 (USD Million) 56

TABLE NO. 24. : Global Type 5 Mass Spectrometry Market Volume, By Region, 2017 – 2022 (K units) 57

TABLE NO. 25. : Global Type 5 Mass Spectrometry Market Volume, By Region, 2023– 2030 (K units) 57

TABLE NO. 26. : Global Type 5 Mass Spectrometry Market Revenue, By Region, 2017 – 2022 (USD Million) 58

TABLE NO. 27. : Global Type 5 Mass Spectrometry Market Revenue, By Region, 2023– 2030 (USD Million) 58

TABLE NO. 28. : Global Mass Spectrometry for Proteomics  Market Volume, By Region, 2017 – 2022 (K units) 61

TABLE NO. 29. : Global Mass Spectrometry for Proteomics  Market Volume, By Region, 2023– 2030 (K units) 61

TABLE NO. 30. : Global Mass Spectrometry for Proteomics  Market Revenue, By Region, 2017 – 2022 (USD Million) 62

TABLE NO. 31. : Global Mass Spectrometry for Proteomics  Market Revenue, By Region, 2023– 2030 (USD Million) 62

TABLE NO. 32. : Global Mass Spectrometry for Metabolomics   Market Volume, By Region, 2017 – 2022 (K units) 63

TABLE NO. 33. : Global Mass Spectrometry for Metabolomics   Market Volume, By Region, 2023– 2030 (K units) 63

TABLE NO. 34. : Global Mass Spectrometry for Metabolomics   Market Revenue, By Region, 2017 – 2022 (USD Million) 64

TABLE NO. 35. : Global Mass Spectrometry for Metabolomics   Market Revenue, By Region, 2023– 2030 (USD Million) 64

TABLE NO. 36. : Global Mass Spectrometry for Glycomics Market Volume, By Region, 2017 – 2022 (K units) 65

TABLE NO. 37. : Global Mass Spectrometry for Glycomics Market Volume, By Region, 2023– 2030 (K units) 65

TABLE NO. 38. : Global Mass Spectrometry for Glycomics Market Revenue, By Region, 2017 – 2022 (USD Million) 66

TABLE NO. 39. : Global Mass Spectrometry for Glycomics Market Revenue, By Region, 2023– 2030 (USD Million) 66

TABLE NO. 40. : Global Mass Spectrometry for Application 4 Market Volume, By Region, 2017 – 2022 (K units) 67

TABLE NO. 41. : Global Mass Spectrometry for Application 4 Market Volume, By Region, 2023– 2030 (K units) 67

TABLE NO. 42. : Global Mass Spectrometry for Application 4 Market Revenue, By Region, 2017 – 2022 (USD Million) 68

TABLE NO. 43. : Global Mass Spectrometry for Application 4 Market Revenue, By Region, 2023– 2030 (USD Million) 68

TABLE NO. 44. : Global Mass Spectrometry for Application 5 Market Volume, By Region, 2017 – 2022 (K units) 69

TABLE NO. 45. : Global Mass Spectrometry for Application 5 Market Volume, By Region, 2023– 2030 (K units) 69

TABLE NO. 46. : Global Mass Spectrometry for Application 5 Market Revenue, By Region, 2017 – 2022 (USD Million) 70

TABLE NO. 47. : Global Mass Spectrometry for Application 5 Market Revenue, By Region, 2023– 2030 (USD Million) 70

TABLE NO. 48. : Global Government & Academic Institutions Mass Spectrometry Market Volume, By Region, 2017 – 2022 (K units) 73

TABLE NO. 49. : Global Government & Academic Institutions Mass Spectrometry Market Volume, By Region, 2023– 2030 (K units) 73

TABLE NO. 50. : Global Government & Academic Institutions Mass Spectrometry Market Revenue, By Region, 2017 – 2022 (USD Million) 74

TABLE NO. 51. : Global Government & Academic Institutions Mass Spectrometry Market Revenue, By Region, 2023– 2030 (USD Million) 74

TABLE NO. 52. : Global Pharmaceutical & Biotechnology Companies Mass Spectrometry Market Volume, By Region, 2017 – 2022 (K units) 75

TABLE NO. 53. : Global Pharmaceutical & Biotechnology Companies Mass Spectrometry Market Volume, By Region, 2023– 2030 (K units) 75

TABLE NO. 54. : Global Pharmaceutical & Biotechnology Companies Mass Spectrometry Market Revenue, By Region, 2017 – 2022 (USD Million) 76

TABLE NO. 55. : Global Pharmaceutical & Biotechnology Companies Mass Spectrometry Market Revenue, By Region, 2023– 2030 (USD Million) 76

TABLE NO. 56. : Global End-user 3 Mass Spectrometry Market Volume, By Region, 2017 – 2022 (K units) 77

TABLE NO. 57. : Global End-user 3 Mass Spectrometry Market Volume, By Region, 2023– 2030 (K units) 77

TABLE NO. 58. : Global End-user 3 Mass Spectrometry Market Revenue, By Region, 2017 – 2022 (USD Million) 78

TABLE NO. 59. : Global End-user 3 Mass Spectrometry Market Revenue, By Region, 2023– 2030 (USD Million) 78

TABLE NO. 60. : Global End-user 4 Mass Spectrometry Market Volume, By Region, 2017 – 2022 (K units) 79

TABLE NO. 61. : Global End-user 4 Mass Spectrometry Market Volume, By Region, 2023– 2030 (K units) 79

TABLE NO. 62. : Global End-user 4 Mass Spectrometry Market Revenue, By Region, 2017 – 2022 (USD Million) 80

TABLE NO. 63. : Global End-user 4 Mass Spectrometry Market Revenue, By Region, 2023– 2030 (USD Million) 80

TABLE NO. 64. : Global End-user 5 Mass Spectrometry Market Volume, By Region, 2017 – 2022 (K units) 81

TABLE NO. 65. : Global End-user 5 Mass Spectrometry Market Volume, By Region, 2023– 2030 (K units) 81

TABLE NO. 66. : Global End-user 5 Mass Spectrometry Market Revenue, By Region, 2017 – 2022 (USD Million) 82

TABLE NO. 67. : Global End-user 5 Mass Spectrometry Market Revenue, By Region, 2023– 2030 (USD Million) 82

TABLE NO. 68. : Global Quadrupole Liquid Chromatography-Mass Spectrometry Mass Spectrometry Market Volume, By Region, 2017 – 2022 (K units) 85

TABLE NO. 69. : Global Quadrupole Liquid Chromatography-Mass Spectrometry Mass Spectrometry Market Volume, By Region, 2023– 2030 (K units) 85

TABLE NO. 70. : Global Quadrupole Liquid Chromatography-Mass Spectrometry Mass Spectrometry Market Revenue, By Region, 2017 – 2022 (USD Million) 86

TABLE NO. 71. : Global Quadrupole Liquid Chromatography-Mass Spectrometry Mass Spectrometry Market Revenue, By Region, 2023– 2030 (USD Million) 86

TABLE NO. 72. : Global Gas Chromatography-Mass Spectrometry (GC-MS) Mass Spectrometry Market Volume, By Region, 2017 – 2022 (K units) 87

TABLE NO. 73. : Global Gas Chromatography-Mass Spectrometry (GC-MS) Mass Spectrometry Market Volume, By Region, 2023– 2030 (K units) 87

TABLE NO. 74. : Global Gas Chromatography-Mass Spectrometry (GC-MS) Mass Spectrometry Market Revenue, By Region, 2017 – 2022 (USD Million) 88

TABLE NO. 75. : Global Gas Chromatography-Mass Spectrometry (GC-MS) Mass Spectrometry Market Revenue, By Region, 2023– 2030 (USD Million) 88

TABLE NO. 76. : Global Fourier Transform-Mass Spectrometry (FT-MS) Mass Spectrometry Market Volume, By Region, 2017 – 2022 (K units) 89

TABLE NO. 77. : Global Fourier Transform-Mass Spectrometry (FT-MS) Mass Spectrometry Market Volume, By Region, 2023– 2030 (K units) 89

TABLE NO. 78. : Global Fourier Transform-Mass Spectrometry (FT-MS) Mass Spectrometry Market Revenue, By Region, 2017 – 2022 (USD Million) 90

TABLE NO. 79. : Global Fourier Transform-Mass Spectrometry (FT-MS) Mass Spectrometry Market Revenue, By Region, 2023– 2030 (USD Million) 90

TABLE NO. 80. : Global Time-of-Flight Mass Spectrometry (TOFMS) Mass Spectrometry Market Volume, By Region, 2017 – 2022 (K units) 91

TABLE NO. 81. : Global Time-of-Flight Mass Spectrometry (TOFMS) Mass Spectrometry Market Volume, By Region, 2023– 2030 (K units) 91

TABLE NO. 82. : Global Time-of-Flight Mass Spectrometry (TOFMS) Mass Spectrometry Market Revenue, By Region, 2017 – 2022 (USD Million) 92

TABLE NO. 83. : Global Time-of-Flight Mass Spectrometry (TOFMS) Mass Spectrometry Market Revenue, By Region, 2023– 2030 (USD Million) 92

TABLE NO. 84. : Global Others (MALDI-TOF, Magnetic Sector Mass Spectrometry, etc.) Mass Spectrometry Market Volume, By Region, 2017 – 2022 (K units) 93

TABLE NO. 85. : Global Others (MALDI-TOF, Magnetic Sector Mass Spectrometry, etc.) Mass Spectrometry Market Volume, By Region, 2023– 2030 (K units) 93

TABLE NO. 86. : Global Others (MALDI-TOF, Magnetic Sector Mass Spectrometry, etc.) Mass Spectrometry Market Revenue, By Region, 2017 – 2022 (USD Million) 94

TABLE NO. 87. : Global Others (MALDI-TOF, Magnetic Sector Mass Spectrometry, etc.) Mass Spectrometry Market Revenue, By Region, 2023– 2030 (USD Million) 94

TABLE NO. 88. : Global Mass Spectrometry Market Volume, By Region, 2017 – 2022 (K units) 97

TABLE NO. 89. : Global Mass Spectrometry Market Volume, By Region, 2023– 2030 (K units) 97

TABLE NO. 90. : Global Mass Spectrometry Market Revenue, By Region, 2017 – 2022 (USD Million) 98

TABLE NO. 91. : Global Mass Spectrometry Market Revenue, By Region, 2023– 2030 (USD Million) 98

TABLE NO. 92. : Global Mass Spectrometry Market Volume, By Type, 2017 – 2022 (K units) 99

TABLE NO. 93. : Global Mass Spectrometry Market Volume, By Type, 2023– 2030 (K units) 99

TABLE NO. 94. : Global Mass Spectrometry Market Revenue, By Type, 2017 – 2022 (USD Million) 100

TABLE NO. 95. : Global Mass Spectrometry Market Revenue, By Type, 2023– 2030 (USD Million) 100

TABLE NO. 96. : Global Mass Spectrometry Market Volume, By Application, 2017 – 2022 (K units) 101

TABLE NO. 97. : Global Mass Spectrometry Market Volume, By Application, 2023– 2030 (K units) 101

TABLE NO. 98. : Global Mass Spectrometry Market Revenue, By Application, 2017 – 2022 (USD Million) 102

TABLE NO. 99. : Global Mass Spectrometry Market Revenue, By Application, 2023– 2030 (USD Million) 102

TABLE NO. 100. : Global Mass Spectrometry Market Volume, By End-user, 2017 – 2022 (K units) 103

TABLE NO. 101. : Global Mass Spectrometry Market Volume, By End-user, 2023– 2030 (K units) 103

TABLE NO. 102. : Global Mass Spectrometry Market Revenue, By End-user, 2017 – 2022 (USD Million) 104

TABLE NO. 103. : Global Mass Spectrometry Market Revenue, By End-user, 2023– 2030 (USD Million) 104

TABLE NO. 104. : Global Mass Spectrometry Market Volume, By Technology, 2017 – 2022 (K units) 105

TABLE NO. 105. : Global Mass Spectrometry Market Volume, By Technology, 2023– 2030 (K units) 105

TABLE NO. 106. : Global Mass Spectrometry Market Revenue, By Technology, 2017 – 2022 (USD Million) 106

TABLE NO. 107. : Global Mass Spectrometry Market Revenue, By Technology, 2023– 2030 (USD Million) 106

TABLE NO. 108. : North America Mass Spectrometry Market Volume, By Country, 2017 – 2022 (K units) 108

TABLE NO. 109. : North America Mass Spectrometry Market Volume, By Country, 2023– 2030 (K units) 108

TABLE NO. 110. : North America Mass Spectrometry Market Revenue, By Country, 2017 – 2022 (USD Million) 108

TABLE NO. 111. : North America Mass Spectrometry Market Revenue, By Country, 2023– 2030 (USD Million) 108

TABLE NO. 112. : North America Mass Spectrometry Market Volume, By Type, 2017 – 2022 (K units) 109

TABLE NO. 113. : North America Mass Spectrometry Market Volume, By Type, 2023– 2030 (K units) 109

TABLE NO. 114. : North America Mass Spectrometry Market Revenue, By Type, 2017 – 2022 (USD Million) 110

TABLE NO. 115. : North America Mass Spectrometry Market Revenue, By Type, 2023– 2030 (USD Million) 110

TABLE NO. 116. : North America Mass Spectrometry Market Volume, By Application, 2017 – 2022 (K units) 111

TABLE NO. 117. : North America Mass Spectrometry Market Volume, By Application, 2023– 2030 (K units) 111

TABLE NO. 118. : North America Mass Spectrometry Market Revenue, By Application, 2017 – 2022 (USD Million) 112

TABLE NO. 119. : North America Mass Spectrometry Market Revenue, By Application, 2023– 2030 (USD Million) 112

TABLE NO. 120. : North America Mass Spectrometry Market Volume, By End-user, 2017 – 2022 (K units) 113

TABLE NO. 121. : North America Mass Spectrometry Market Volume, By End-user, 2023– 2030 (K units) 113

TABLE NO. 122. : North America Mass Spectrometry Market Revenue, By End-user, 2017 – 2022 (USD Million) 114

TABLE NO. 123. : North America Mass Spectrometry Market Revenue, By End-user, 2023– 2030 (USD Million) 114

TABLE NO. 124. : North America Mass Spectrometry Market Volume, By Technology, 2017 – 2022 (K units) 115

TABLE NO. 125. : North America Mass Spectrometry Market Volume, By Technology, 2023– 2030 (K units) 115

TABLE NO. 126. : North America Mass Spectrometry Market Revenue, By Technology, 2017 – 2022 (USD Million) 116

TABLE NO. 127. : North America Mass Spectrometry Market Revenue, By Technology, 2023– 2030 (USD Million) 116

TABLE NO. 128. : Europe Mass Spectrometry Market Volume, By Country, 2017 – 2022 (K units) 119

TABLE NO. 129. : Europe Mass Spectrometry Market Volume, By Country, 2023– 2030 (K units) 119

TABLE NO. 130. : Europe Mass Spectrometry Market Revenue, By Country, 2017 – 2022 (USD Million) 120

TABLE NO. 131. : Europe Mass Spectrometry Market Revenue, By Country, 2023– 2030 (USD Million) 120

TABLE NO. 132. : Europe Mass Spectrometry Market Volume, By Type, 2017 – 2022 (K units) 121

TABLE NO. 133. : Europe Mass Spectrometry Market Volume, By Type, 2023– 2030 (K units) 121

TABLE NO. 134. : Europe Mass Spectrometry Market Revenue, By Type, 2017 – 2022 (USD Million) 122

TABLE NO. 135. : Europe Mass Spectrometry Market Revenue, By Type, 2023– 2030 (USD Million) 122

TABLE NO. 136. : Europe Mass Spectrometry Market Volume, By Application, 2017 – 2022 (K units) 123

TABLE NO. 137. : Europe Mass Spectrometry Market Volume, By Application, 2023– 2030 (K units) 123

TABLE NO. 138. : Europe Mass Spectrometry Market Revenue, By Application, 2017 – 2022 (USD Million) 124

TABLE NO. 139. : Europe Mass Spectrometry Market Revenue, By Application, 2023– 2030 (USD Million) 124

TABLE NO. 140. : Europe Mass Spectrometry Market Volume, By End-user, 2017 – 2022 (K units) 125

TABLE NO. 141. : Europe Mass Spectrometry Market Volume, By End-user, 2023– 2030 (K units) 125

TABLE NO. 142. : Europe Mass Spectrometry Market Revenue, By End-user, 2017 – 2022 (USD Million) 126

TABLE NO. 143. : Europe Mass Spectrometry Market Revenue, By End-user, 2023– 2030 (USD Million) 126

TABLE NO. 144. : Europe Mass Spectrometry Market Volume, By Technology, 2017 – 2022 (K units) 127

TABLE NO. 145. : Europe Mass Spectrometry Market Volume, By Technology, 2023– 2030 (K units) 127

TABLE NO. 146. : Europe Mass Spectrometry Market Revenue, By Technology, 2017 – 2022 (USD Million) 128

TABLE NO. 147. : Europe Mass Spectrometry Market Revenue, By Technology, 2023– 2030 (USD Million) 128

TABLE NO. 148. : Asia Pacific Mass Spectrometry Market Volume, By Country, 2017 – 2022 (K units) 131

TABLE NO. 149. : Asia Pacific Mass Spectrometry Market Volume, By Country, 2023– 2030 (K units) 131

TABLE NO. 150. : Asia Pacific Mass Spectrometry Market Revenue, By Country, 2017 – 2022 (USD Million) 132

TABLE NO. 151. : Asia Pacific Mass Spectrometry Market Revenue, By Country, 2023– 2030 (USD Million) 132

TABLE NO. 152. : Asia Pacific Mass Spectrometry Market Volume, By Type, 2017 – 2022 (K units) 133

TABLE NO. 153. : Asia Pacific Mass Spectrometry Market Volume, By Type, 2023– 2030 (K units) 133

TABLE NO. 154. : Asia Pacific Mass Spectrometry Market Revenue, By Type, 2017 – 2022 (USD Million) 134

TABLE NO. 155. : Asia Pacific Mass Spectrometry Market Revenue, By Type, 2023– 2030 (USD Million) 134

TABLE NO. 156. : Asia Pacific Mass Spectrometry Market Volume, By Application, 2017 – 2022 (K units) 135

TABLE NO. 157. : Asia Pacific Mass Spectrometry Market Volume, By Application, 2023– 2030 (K units) 135

TABLE NO. 158. : Asia Pacific Mass Spectrometry Market Revenue, By Application, 2017 – 2022 (USD Million) 136

TABLE NO. 159. : Asia Pacific Mass Spectrometry Market Revenue, By Application, 2023– 2030 (USD Million) 136

TABLE NO. 160. : Asia Pacific Mass Spectrometry Market Volume, By End-user, 2017 – 2022 (K units) 137

TABLE NO. 161. : Asia Pacific Mass Spectrometry Market Volume, By End-user, 2023– 2030 (K units) 137

TABLE NO. 162. : Asia Pacific Mass Spectrometry Market Revenue, By End-user, 2017 – 2022 (USD Million) 138

TABLE NO. 163. : Asia Pacific Mass Spectrometry Market Revenue, By End-user, 2023– 2030 (USD Million) 138

TABLE NO. 164. : Asia Pacific Mass Spectrometry Market Volume, By Technology, 2017 – 2022 (K units) 139

TABLE NO. 165. : Asia Pacific Mass Spectrometry Market Volume, By Technology, 2023– 2030 (K units) 139

TABLE NO. 166. : Asia Pacific Mass Spectrometry Market Revenue, By Technology, 2017 – 2022 (USD Million) 140

TABLE NO. 167. : Asia Pacific Mass Spectrometry Market Revenue, By Technology, 2023– 2030 (USD Million) 140

TABLE NO. 168. : Latin America Mass Spectrometry Market Volume, By Country, 2017 – 2022 (K units) 143

TABLE NO. 169. : Latin America Mass Spectrometry Market Volume, By Country, 2023– 2030 (K units) 143

TABLE NO. 170. : Latin America Mass Spectrometry Market Revenue, By Country, 2017 – 2022 (USD Million) 144

TABLE NO. 171. : Latin America Mass Spectrometry Market Revenue, By Country, 2023– 2030 (USD Million) 144

TABLE NO. 172. : Latin America Mass Spectrometry Market Volume, By Type, 2017 – 2022 (K units) 145

TABLE NO. 173. : Latin America Mass Spectrometry Market Volume, By Type, 2023– 2030 (K units) 145

TABLE NO. 174. : Latin America Mass Spectrometry Market Revenue, By Type, 2017 – 2022 (USD Million) 146

TABLE NO. 175. : Latin America Mass Spectrometry Market Revenue, By Type, 2023– 2030 (USD Million) 146

TABLE NO. 176. : Latin America Mass Spectrometry Market Volume, By Application, 2017 – 2022 (K units) 147

TABLE NO. 177. : Latin America Mass Spectrometry Market Volume, By Application, 2023– 2030 (K units) 147

TABLE NO. 178. : Latin America Mass Spectrometry Market Revenue, By Application, 2017 – 2022 (USD Million) 148

TABLE NO. 179. : Latin America Mass Spectrometry Market Revenue, By Application, 2023– 2030 (USD Million) 148

TABLE NO. 180. : Latin America Mass Spectrometry Market Volume, By End-user, 2017 – 2022 (K units) 149

TABLE NO. 181. : Latin America Mass Spectrometry Market Volume, By End-user, 2023– 2030 (K units) 149

TABLE NO. 182. : Latin America Mass Spectrometry Market Revenue, By End-user, 2017 – 2022 (USD Million) 150

TABLE NO. 183. : Latin America Mass Spectrometry Market Revenue, By End-user, 2023– 2030 (USD Million) 150

TABLE NO. 184. : Latin America Mass Spectrometry Market Volume, By Technology, 2017 – 2022 (K units) 151

TABLE NO. 185. : Latin America Mass Spectrometry Market Volume, By Technology, 2023– 2030 (K units) 151

TABLE NO. 186. : Latin America Mass Spectrometry Market Revenue, By Technology, 2017 – 2022 (USD Million) 152

TABLE NO. 187. : Latin America Mass Spectrometry Market Revenue, By Technology, 2023– 2030 (USD Million) 152

TABLE NO. 188. : Middle East Mass Spectrometry Market Volume, By Country, 2017 – 2022 (K units) 155

TABLE NO. 189. : Middle East Mass Spectrometry Market Volume, By Country, 2023– 2030 (K units) 155

TABLE NO. 190. : Middle East Mass Spectrometry Market Revenue, By Country, 2017 – 2022 (USD Million) 156

TABLE NO. 191. : Middle East Mass Spectrometry Market Revenue, By Country, 2023– 2030 (USD Million) 156

TABLE NO. 192. : Middle East Mass Spectrometry Market Volume, By Type, 2017 – 2022 (K units) 157

TABLE NO. 193. : Middle East Mass Spectrometry Market Volume, By Type, 2023– 2030 (K units) 157

TABLE NO. 194. : Middle East Mass Spectrometry Market Revenue, By Type, 2017 – 2022 (USD Million) 158

TABLE NO. 195. : Middle East Mass Spectrometry Market Revenue, By Type, 2023– 2030 (USD Million) 158

TABLE NO. 196. : Middle East Mass Spectrometry Market Volume, By Application, 2017 – 2022 (K units) 159

TABLE NO. 197. : Middle East Mass Spectrometry Market Volume, By Application, 2023– 2030 (K units) 159

TABLE NO. 198. : Middle East Mass Spectrometry Market Revenue, By Application, 2017 – 2022 (USD Million) 160

TABLE NO. 199. : Middle East Mass Spectrometry Market Revenue, By Application, 2023– 2030 (USD Million) 160

TABLE NO. 200. : Middle East Mass Spectrometry Market Volume, By End-user, 2017 – 2022 (K units) 161

TABLE NO. 201. : Middle East Mass Spectrometry Market Volume, By End-user, 2023– 2030 (K units) 161

TABLE NO. 202. : Middle East Mass Spectrometry Market Revenue, By End-user, 2017 – 2022 (USD Million) 162

TABLE NO. 203. : Middle East Mass Spectrometry Market Revenue, By End-user, 2023– 2030 (USD Million) 162

TABLE NO. 204. : Middle East Mass Spectrometry Market Volume, By Technology, 2017 – 2022 (K units) 163

TABLE NO. 205. : Middle East Mass Spectrometry Market Volume, By Technology, 2023– 2030 (K units) 163

TABLE NO. 206. : Middle East Mass Spectrometry Market Revenue, By Technology, 2017 – 2022 (USD Million) 164

TABLE NO. 207. : Middle East Mass Spectrometry Market Revenue, By Technology, 2023– 2030 (USD Million) 164

TABLE NO. 208. : Africa Mass Spectrometry Market Volume, By Country, 2017 – 2022 (K units) 167

TABLE NO. 209. : Africa Mass Spectrometry Market Volume, By Country, 2023– 2030 (K units) 167

TABLE NO. 210. : Africa Mass Spectrometry Market Revenue, By Country, 2017 – 2022 (USD Million) 168

TABLE NO. 211. : Africa Mass Spectrometry Market Revenue, By Country, 2023– 2030 (USD Million) 168

TABLE NO. 212. : Africa Mass Spectrometry Market Volume, By Type, 2017 – 2022 (K units) 169

TABLE NO. 213. : Africa Mass Spectrometry Market Volume, By Type, 2023– 2030 (K units) 169

TABLE NO. 214. : Africa Mass Spectrometry Market Revenue, By Type, 2017 – 2022 (USD Million) 170

TABLE NO. 215. : Africa Mass Spectrometry Market Revenue, By Type, 2023– 2030 (USD Million) 170

TABLE NO. 216. : Africa Mass Spectrometry Market Volume, By Application, 2017 – 2022 (K units) 171

TABLE NO. 217. : Africa Mass Spectrometry Market Volume, By Application, 2023– 2030 (K units) 171

TABLE NO. 218. : Africa Mass Spectrometry Market Revenue, By Application, 2017 – 2022 (USD Million) 172

TABLE NO. 219. : Africa Mass Spectrometry Market Revenue, By Application, 2023– 2030 (USD Million) 172

TABLE NO. 220. : Africa Mass Spectrometry Market Volume, By End-user, 2017 – 2022 (K units) 173

TABLE NO. 221. : Africa Mass Spectrometry Market Volume, By End-user, 2023– 2030 (K units) 173

TABLE NO. 222. : Africa Mass Spectrometry Market Revenue, By End-user, 2017 – 2022 (USD Million) 174

TABLE NO. 223. : Africa Mass Spectrometry Market Revenue, By End-user, 2023– 2030 (USD Million) 174

TABLE NO. 224. : Africa Mass Spectrometry Market Volume, By Technology, 2017 – 2022 (K units) 175

TABLE NO. 225. : Africa Mass Spectrometry Market Volume, By Technology, 2023– 2030 (K units) 175

TABLE NO. 226. : Africa Mass Spectrometry Market Revenue, By Technology, 2017 – 2022 (USD Million) 176

TABLE NO. 227. : Africa Mass Spectrometry Market Revenue, By Technology, 2023– 2030 (USD Million) 176

Frequently Asked Questions

What is mass spectrometry?

Mass spectrometry is an analytical technique to discover and quantify chemical substances based on their mass-to-cost ratio. It includes ionizing a pattern and keeping apart the resulting ions primarily based on their mass-to-rate ratio using electric-powered and magnetic fields. Mass spectrometry offers valuable information about the pattern’s composition and shape by measuring these ions’ mass and abundance.

What are the key applications of mass spectrometry?

Mass spectrometry has a huge range of applications in diverse fields. It is commonly utilized in drug discovery and development, proteomics, metabolomics, environmental analysis, forensic analysis, food safety, and scientific diagnostics. Mass spectrometry is also substantially employed in research and development throughout prescription drugs, biotechnology, and environmental sciences industries.

What are the main components of a mass spectrometer?

A mass spectrometer commonly includes four main components: an ion source, a mass analyzer, a detector, and a data analysis machine. The ion source ionizes the pattern, converting it into charged debris. The mass analyzer separates the ions primarily based on their mass-to-charge ratio. The detector detects and measures the ions, producing a mass spectrum. The data analysis system processes and interprets the mass spectrum, imparting information about the pattern’s composition.

What are the specific forms of mass spectrometry techniques?

Several mass spectrometry techniques are available, each with its specific strengths and applications. Some commonplace types include: Gas Chromatography-Mass Spectrometry (GC-MS) Liquid Chromatography-Mass Spectrometry (LC-MS) Matrix-Assisted Laser Desorption/Ionization Mass Spectrometry (MALDI-MS) Electrospray Ionization Mass Spectrometry (ESI-MS) Time-of-Flight Mass Spectrometry (TOF-MS) Quadrupole Mass Spectrometry

What are the factors driving the growth of the mass spectrometry market?

The mass spectrometry marketplace is experiencing growth due to numerous elements. These include increasing investments in life sciences research and drug development, rising demand for personalized medicinal drugs, expanding medical diagnostics applications, growing food and environmental safety issues, and technological advancements in mass spectrometry instruments. Additionally, the need for accurate and reliable analytical equipment for quality control and compliance contributes to marketplace growth.

What are the challenges faced by the mass spectrometry market?

While the mass spectrometry marketplace has seen massive advancements, it also faces some challenges. These include the high cost of devices and maintenance, the need for professional operators, data interpretation and evaluation complexity, limitations in sensitivity and resolution for certain applications, and competition from alternative analytical techniques. Addressing these challenges requires ongoing research and development efforts to enhance instrument performance, simplify workflows, and enhance data analysis skills.

What are the important trends inside the mass spectrometry marketplace?

Some key trends in the mass spectrometry market consist of miniaturization and portability of gadgets, the mixing of mass spectrometry with different technology, which includes chromatography and imaging, advancements in ionization techniques, the emergence of high-resolution mass spectrometry, and the growing use of mass spectrometry in point-of-care and decentralized settings. Additionally, there’s a growing focus on software solutions that streamline data analysis and enable automation to enhance productivity.

Which regions are witnessing massive growth in the mass spectrometry marketplace?

The mass spectrometry marketplace is experiencing a boom globally, with numerous regions witnessing significant advancements. North America has historically been a leading marketplace due to the presence of major pharmaceutical and biotechnology companies, academic research institutes, and government investment in research. Europe is another distinguished marketplace with a sturdy research infrastructure and growing adoption of scientific diagnostics. Asia Pacific is likewise emerging as a lucrative marketplace, driven by growing investments in research and development, expanding healthcare infrastructure, and increasing focus on precision medicinal drugs.

What are the regulatory considerations for mass spectrometry instruments?

Mass spectrometry instruments used in numerous applications, which include prescription drugs, scientific diagnostics, and environmental evaluation, are subject to regulatory requirements. Depending on the specific application, instruments may need to comply with standards and guidelines set by regulatory bodies, which include the U.S. Food and Drug Administration (FDA), the European Medicines Agency (EMA), and the International Conference on Harmonization (ICH). Compliance with those policies guarantees the accuracy, reliability, and reproducibility of outcomes generated through mass spectrometry units.

What are the future prospects of the mass spectrometry market?

The mass spectrometry market is anticipated to grow within the coming years. Technological advancements will drive improvements in sensitivity, resolution, and data analysis capabilities, opening new avenues for programs. The market will possibly benefit from growing adoption in emerging areas, expanding medical diagnostics and personalized medication applications, and the growing need for superior analytical tools across industries. Collaborations among academic research establishments, industry players, and regulatory bodies will further propel innovation and market growth.

Biotechnology Contract Manufacturing Market

Published:
Report ID: 36713

Cell Culture Media And Reagents Market

Published:
Report ID: 3489

Viral Antigens Market

Published:
Report ID: 36114

Recombinant Protein Market

Published:
Report ID: 35991

Bacteriophage Market

Published:
Report ID: 2114

India Bone Marrow Transplantation (BMT) Market

Published:
Report ID: 35571

Bioengineered Skin And Skin Substitutes Market

Published:
Report ID: 3472

DNA and RNA Sample Preparation Market

Published:
Report ID: 34911

Laboratory Filtration Market

Published:
Report ID: 7940

Adult Hemoglobinopathy Testing Market

Published:
Report ID: 34717

Nanobiotechnology Market

Published:
Report ID: 14350

Canine Stem Cell Therapy Market

Published:
Report ID: 34386

Purchase Options

$2999
Delivery Format: Excel.
$4999
Designed for the individual purchaser.
$6999
Users located at a single corporate site or regional office.
$7999
Allowed for unlimited sharing globally within one company.
Smallform of Sample request

Have a question?

User Profile

Don’t settle for less – trust Mitul to help you find the best solution.

Report delivery within 24 to 48 hours

– Other Info –

What people say?-

User Review

I am very impressed with the information in this report. The author clearly did their research when they came up with this product and it has already given me a lot of ideas.

Jana Schmidt
CEDAR CX Technologies

– Connect with us –

Phone

+91 6232 49 3207


support

24/7 Research Support


sales@credenceresearch.com

– Research Methodology –

Going beyond the basics: advanced techniques in research methodology

– Trusted By –

Pepshi, LG, Nestle
Motorola, Honeywell, Johnson and johnson
LG Chem, SIEMENS, Pfizer
Unilever, Samsonite, QIAGEN