Market Overview
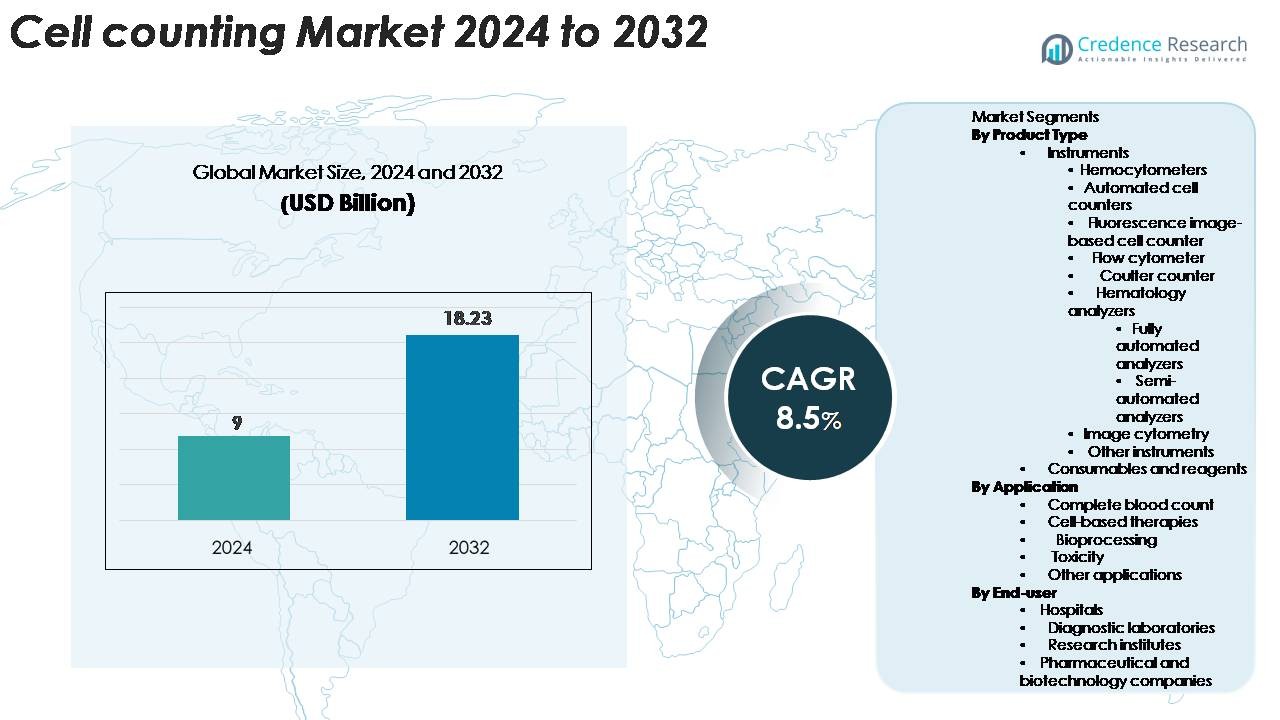
Cell counting market size was valued at USD 9 billion in 2024 and is expected to reach USD 18.23 billion by 2032, growing at a CAGR of 8.5% during the forecast period.
| REPORT ATTRIBUTE |
DETAILS |
| Historical Period |
2020-2023 |
| Base Year |
2024 |
| Forecast Period |
2025-2032 |
| Cell Counting Market Size 2024 |
USD 9 Billion |
| Cell Counting Market, CAGR |
8.5% |
| Cell Counting Market Size 2032 |
USD 18.23 Billion |
The cell counting market is shaped by leading players such as Abbott Laboratories, Agilent Technologies, Beckman Coulter, Bio-Rad Laboratories, Biotek Instruments, ChemoMetec A/S, DeNovix, Merck KGaA, NanoEnTek, Olympus Corporation, and Sysmex Corporation. These companies compete through automated counters, advanced flow cytometers, and high-resolution imaging systems that support clinical diagnostics, bioprocessing, and cell-based therapy development. Many firms focus on AI-enabled image analysis, enhanced reagent portfolios, and integrated digital platforms to improve accuracy and workflow speed. North America leads the global market with a 38% share, driven by strong diagnostic infrastructure and high adoption of automated analyzers, while Europe holds 28%, supported by established research and biopharma ecosystems.
Access crucial information at unmatched prices!
Request your sample report today & start making informed decisions powered by Credence Research Inc.!
Download Sample
Market Insights
- The market reached USD 9 billion in 2024 and will hit USD 18.23 billion by 2032 at a CAGR of 8.5%.
- Strong demand for fast diagnostics drives adoption of automated counters and flow cytometry systems. Rising disease cases and higher test volumes support steady equipment upgrades across hospitals and labs.
- Automation, AI-enabled imaging, and digital reporting shape new trends. Instruments hold the largest share as automated counters lead due to high accuracy and faster throughput.
- Global players compete through advanced analyzers, improved reagents, and integrated software platforms. Firms expand portfolios with imaging cytometry and smart counting tools to gain market reach.
- North America leads with 38% share, followed by Europe at 28%, while Asia-Pacific holds 25% and grows quickly. Complete blood count remains the dominant application due to routine testing needs across clinical settings.
Market Segmentation Analysis:
By Product Type
Instruments lead this segment with the largest share due to broad use across clinical, research, and manufacturing workflows. Automated cell counters dominate because they reduce manual errors and support faster throughput in high-volume settings. Flow cytometers and fluorescence image-based systems gain traction as labs adopt advanced cell characterization tools for precision studies. Hematology analyzers remain essential in hospital diagnostics, while image cytometry expands in research due to higher accuracy. Consumables and reagents grow steadily as recurring demand rises with increased testing frequency across therapeutic development and clinical evaluations.
- For instance, Agilent’s xCELLigence RTCA HT platform is part of a high-throughput system that, when integrated with up to four instruments, supports a total of up to 1,536 wells (across four 384-well plates) for a single run, enabling continuous kinetic monitoring of large assay batches.
By Application
Complete blood count holds the dominant share because hospitals and diagnostic centers rely on fast and accurate hematological assessment. Growing cases of chronic and infectious diseases increase routine testing, which keeps CBC at the core of diagnostic workflows. Cell-based therapies expand as regenerative medicine and immunotherapy projects scale, boosting adoption of advanced quantification platforms. Bioprocessing applications rise as manufacturers depend on precise viability checks for upstream and downstream operations. Toxicity testing and other applications also grow with higher investments in drug discovery and safety screening programs.
- For instance, Beckman Coulter’s DxH 900 hematology analyzer delivers comprehensive CBC results with around 29 reportable parameters per sample and processes up to 100 samples per hour, effectively supporting high-volume laboratories
By End-user
Hospitals lead the end-user segment with the highest share due to heavy demand for routine blood analysis, emergency diagnostics, and patient monitoring. Diagnostic laboratories follow as they process large test volumes and require automated counters for speed and accuracy. Research institutes adopt advanced imaging and flow-based tools to support cell profiling, stem cell studies, and experimental therapy research. Pharmaceutical and biotechnology companies strengthen their use of automated and image-based counters to support biologics development, quality control, and large-scale production workflows across clinical and commercial pipelines.
Key Growth Drivers
Rising Demand for High-Accuracy Diagnostics
The demand for accurate and fast diagnostic testing continues to rise as hospitals and labs face higher patient loads and more complex disease profiles. Chronic illnesses, infectious outbreaks, and routine hematology tests require precise counting of cells, which drives adoption of automated and image-based systems. Automated counters reduce human error and speed up workflows, making them essential for high-volume diagnostic centers. Flow cytometers and advanced analyzers help clinicians achieve better clinical decisions through detailed cell profiling. As healthcare systems modernize, investment in laboratory automation grows, strengthening the shift toward faster, standardized, and more reliable cell quantification tools across clinical settings.
- For instance, Beckman Coulter’s DxH 900 analyzer processes up to 100 samples per hour and delivers a 5-part white cell differential using over 70,000 cell-based data points per test, enabling high-accuracy diagnostics for busy clinical labs.
Expansion of Cell-Based Therapies and Bioprocessing
Growing adoption of regenerative medicine, CAR-T therapies, and stem-cell research fuels strong demand for advanced cell counting tools. These therapies rely on strict control of cell viability, growth rate, and purity, which increases the need for accurate quantification at each development stage. Bioprocessing facilities depend on reliable counters to manage upstream cultures and downstream purification, ensuring consistency and safety. Automated and fluorescence-based platforms help researchers monitor cell behavior in real time, supporting scalable manufacturing. As more cell-based treatments enter clinical pipelines, developers turn to high-throughput and digital counting systems to meet regulatory expectations. This expansion creates long-term demand for precision instruments across biotech and pharma sectors.
- For instance, Beckman Coulter’s AQUIOS STEM System automates CD34⁺ stem-cell enumeration and delivers sample-to-answer results in under 30 minutes while processing up to 50 samples per shift.
Growth of Precision Medicine and Research Investments
Growing interest in precision medicine encourages deeper cellular analysis in clinical and research applications. Research institutes and pharmaceutical companies invest in advanced imaging cytometry, multi-parameter flow cytometry, and automated counting systems to study disease mechanisms at a cellular level. Increased funding in oncology, immunology, vaccine development, and toxicology expands the need for accurate quantification to validate experiments and accelerate discovery timelines. Universities and private research centers adopt smart counters that integrate AI-based imaging and automated reporting to improve reproducibility. Advancements in microscopy, sensors, and digital workflows further enhance cell analysis capabilities. As personalized treatment approaches expand, demand for high-resolution cell measurement tools continues to strengthen.
Key Trends & Opportunities
Adoption of AI-Driven and Automated Counting Platforms
Automation and AI technologies create new opportunities for improved speed, accuracy, and workflow standardization. AI-powered image cytometry and machine learning algorithms now analyze cell clusters, morphology, and viability with higher precision than manual methods. Cloud-based platforms help labs store, compare, and process large datasets to support quality control and predictive analysis. Automated benchtop counters also integrate with laboratory information systems to streamline reporting. These innovations reduce operator dependency and support uniform results across processing sites. As labs aim to handle growing workloads, AI-enabled counting tools offer a scalable and cost-effective path to modernization.
- For instance, Beckman Coulter’s CellMek SPS system automates sample preparation with robotic handling and processes a variable number of samples per hour depending on the assay complexity.
Rising Use of Cell Counting in Biologics and Vaccine Production
Biologics manufacturing and vaccine development create strong opportunities for advanced cell counting technologies, especially in upstream processing. Accurate monitoring of cell growth, health, and metabolic behavior is essential for optimizing production yields. Image-based counters and cytometers support real-time decision-making during culture expansion. The rise of mRNA vaccines and antibody-based treatments increases dependence on reliable quantification tools across R&D and quality control. As the biopharma industry expands global production capacity, cell counting instruments that offer high throughput and regulatory-grade validation become more attractive. These trends open growth avenues for manufacturers offering integrated bioprocessing solutions.
- For instance, Agilent’s xCELLigence RTCA HT system supports impedance-based monitoring across 384-well plates and can be expanded to 1,536 wells, enabling high-throughput tracking of cell growth during bioreactor optimization.
Key Challenges
High Cost of Advanced Instruments and Maintenance
Advanced cell counting technologies such as flow cytometers, AI-enabled imaging systems, and fully automated analyzers carry high purchase and maintenance costs. Smaller labs, clinics, and research institutes face budget limitations that prevent them from adopting next-generation platforms. Ongoing calibration, software updates, and consumable purchases add financial burden over time. These constraints widen the technology gap between large facilities and smaller diagnostic centers. Limited availability of trained professionals further increases operational expenses, as specialized instruments often require expert handling. High cost remains a major barrier to widespread adoption, especially in emerging markets and resource-limited healthcare settings.
Complexity of Integration and Standardization Across Workflows
Integrating new counting platforms with existing laboratory workflows, software systems, and reporting tools poses a significant challenge. Variations in sample types, staining methods, and analytical protocols often lead to inconsistent results across facilities. Some advanced instruments require specialized training, which slows adoption and limits uniform implementation. Research and clinical teams face difficulties in maintaining standard operating procedures when using multi-parameter or AI-driven systems. Data security and compatibility issues also arise when cloud platforms process sensitive biological information. These integration and standardization gaps reduce efficiency and undermine reproducibility, making it harder for organizations to fully leverage modern counting technologies.
Regional Analysis
North America
North America leads the cell counting market with about 38% share, supported by strong diagnostic infrastructure and high adoption of automated analyzers across hospitals and labs. The United States drives most demand due to its large patient pool, strong oncology focus, and expanding cell-based therapy pipeline. Research institutes and biopharma companies invest heavily in flow cytometry, advanced image-based systems, and automated counters to support precision medicine. Rising chronic disease cases and routine CBC testing boost recurring use. The region benefits from strong funding, modern laboratories, and rapid adoption of digital and AI-enabled platforms.
Europe
Europe holds around 28% share, driven by established healthcare networks, robust clinical testing volume, and strong demand for advanced cell analysis tools. Germany, the UK, and France remain key markets due to rising research funding and growing biologics production. Hospitals rely on automated hematology analyzers to manage expanding diagnostic workloads, while research centers increase use of image cytometry for regenerative studies. Strict quality regulations encourage adoption of standardized and automated systems. Growth in cell therapy manufacturing, academic collaboration, and expanded bioprocessing capacity continues to strengthen Europe’s position in the global market.
Asia-Pacific
Asia-Pacific accounts for about 25% share, supported by rapid healthcare expansion and increasing investment in biotechnology. China, India, Japan, and South Korea lead the region with rising diagnostic testing volumes and fast adoption of automated counters in hospitals. Growth in vaccine production, stem-cell research, and biologics manufacturing boosts use of flow cytometry and imaging tools. The region benefits from lower equipment costs, expanding lab infrastructure, and government support for advanced medical technologies. As chronic disease screening increases, and research activities scale, Asia-Pacific becomes one of the fastest-growing markets for modern cell counting solutions.
Latin America
Latin America holds around 5% share, driven by rising healthcare modernization and expanding diagnostic capabilities in countries such as Brazil and Mexico. Hospitals adopt automated hematology analyzers to improve accuracy in routine testing, while private laboratories increase investment in mid-range cell counters to meet growing patient demand. Research activities remain limited but show steady progress as universities upgrade laboratory tools. Adoption of advanced cytometry systems grows slowly due to high costs, but government support for public health testing and infectious disease monitoring continues to boost market penetration.
Middle East & Africa
The Middle East & Africa region captures about 4% share, supported by improving healthcare infrastructure in the Gulf countries and growing lab automation. Demand increases as hospitals upgrade diagnostic departments with automated analyzers to support routine CBC tests and emergency care. Research activity is still emerging, but growth in medical education and biotechnology hubs in the UAE and Saudi Arabia supports adoption of advanced imaging systems. Resource-limited regions face budget constraints, which slow penetration of high-end counters. However, public health programs and private diagnostic chains drive gradual expansion across key markets.
Market Segmentations:
By Product Type
- Instruments
- Hemocytometers
- Automated cell counters
- Fluorescence image-based cell counter
- Flow cytometer
- Coulter counter
- Hematology analyzers
- Fully automated analyzers
- Semi-automated analyzers
- Image cytometry
- Other instruments
- Consumables and reagents
By Application
- Complete blood count
- Cell-based therapies
- Bioprocessing
- Toxicity
- Other applications
By End-user
- Hospitals
- Diagnostic laboratories
- Research institutes
- Pharmaceutical and biotechnology companies
By Geography
- North America
- Europe
- Germany
- France
- U.K.
- Italy
- Spain
- Rest of Europe
- Asia Pacific
- China
- Japan
- India
- South Korea
- South-east Asia
- Rest of Asia Pacific
- Latin America
- Brazil
- Argentina
- Rest of Latin America
- Middle East & Africa
- GCC Countries
- South Africa
- Rest of the Middle East and Africa
Competitive Landscape
The competitive landscape of the cell counting market features a mix of global instrument manufacturers, specialized imaging technology providers, and reagent suppliers competing through innovation, automation, and workflow integration. Companies focus on expanding automated cell counters, image-based cytometry platforms, and high-throughput flow cytometers to meet rising demand across diagnostics, bioprocessing, and cell therapy development. Manufacturers strengthen portfolios with AI-powered analysis, cloud connectivity, and improved sample handling to support precision and speed. Strategic partnerships with hospitals, research institutes, and biopharma companies help broaden adoption in high-volume settings. Consumables and reagent suppliers gain steady revenue through recurring demand driven by routine CBC tests, viability assessments, and culture monitoring. Product upgrades, regulatory approvals, and global distribution expansion remain central strategies as firms compete for stronger presence in North America and Europe, which together account for the largest installed base of advanced cell counting systems.
Shape Your Report to Specific Countries or Regions & Enjoy 30% Off!
Key Player Analysis
Recent Developments
- In December 2023, Beckman Coulter, Inc. (via Beckman Coulter Life Sciences) Received U.S. FDA 510(k) clearance for its AQUIOS STEM System for stem cell analysis (a key cell-counting/enumeration tool in stem cell workflows).
- In June 2023, Agilent Technologies, Inc. Announced enhanced xCELLigence RTCA system for cell therapy discovery, process development and QC-release.
- In February 2023, Agilent Technologies Announced “Cell Analysis Workflow Automation” solution for immuno-oncology, virology and vaccine development markets.
Report Coverage
The research report offers an in-depth analysis based on Product type, Application, End-User and Geography. It details leading market players, providing an overview of their business, product offerings, investments, revenue streams, and key applications. Additionally, the report includes insights into the competitive environment, SWOT analysis, current market trends, as well as the primary drivers and constraints. Furthermore, it discusses various factors that have driven market expansion in recent years. The report also explores market dynamics, regulatory scenarios, and technological advancements that are shaping the industry. It assesses the impact of external factors and global economic changes on market growth. Lastly, it provides strategic recommendations for new entrants and established companies to navigate the complexities of the market.
Future Outlook
- Demand for automated and image-based counters will rise as labs shift to faster workflows.
- AI-driven analysis will improve accuracy in viability checks and complex cell profiling.
- Adoption of cloud-linked platforms will grow to support remote monitoring and data sharing.
- Cell therapy manufacturing will expand, increasing reliance on high-precision counting tools.
- Flow cytometry will gain wider use as multi-parameter analysis becomes standard in research.
- Reagent and consumable demand will rise due to higher testing volumes in diagnostics.
- Portable and compact counters will grow in popularity across small labs and point-of-care settings.
- Integration of counting systems with laboratory automation will increase across large facilities.
- Imaging cytometry will advance as users seek higher resolution and improved morphology tracking.
- Emerging markets will adopt modern counters as healthcare systems upgrade infrastructure.


