CHAPTER NO. 1 : GENESIS OF THE MARKET
1.1 Market Prelude – Introduction & Scope
1.2 The Big Picture – Objectives & Vision
1.3 Strategic Edge – Unique Value Proposition
1.4 Stakeholder Compass – Key Beneficiaries
CHAPTER NO. 2 : EXECUTIVE LENS
2.1 Pulse of the Industry – Market Snapshot
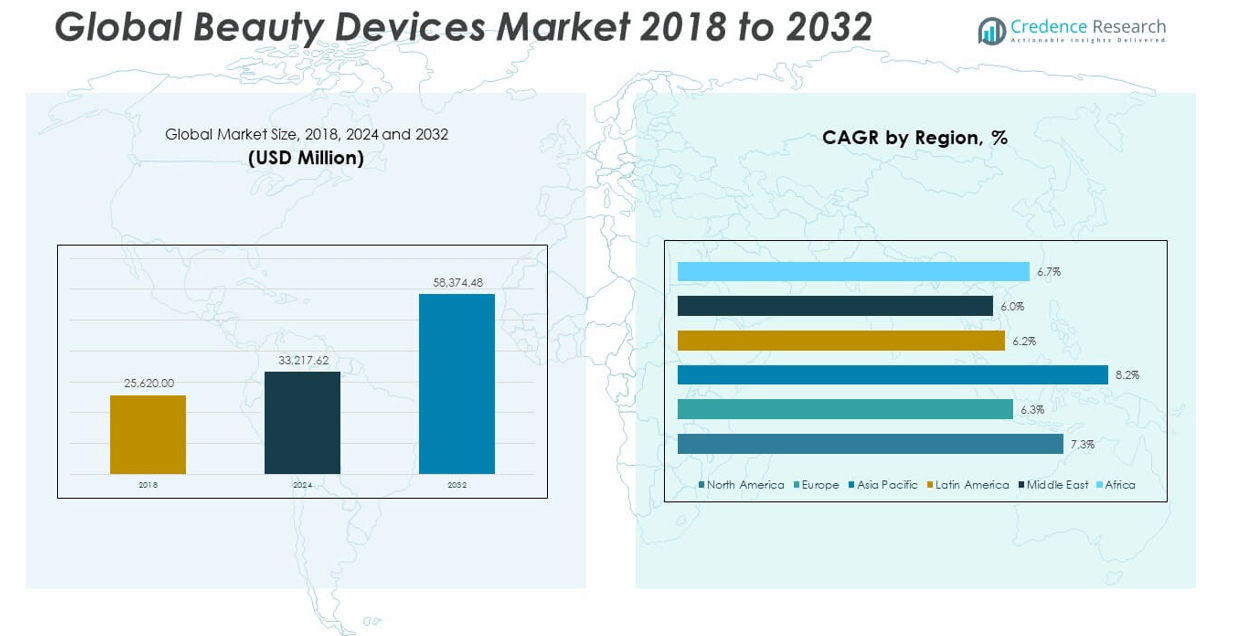
2.2 Growth Arc – Revenue Projections (USD Million)
2.3. Premium Insights – Based on Primary Interviews
CHAPTER NO. 3 : BEAUTY DEVICES MARKET FORCES & INDUSTRY PULSE
3.1 Foundations of Change – Market Overview
3.2 Catalysts of Expansion – Key Market Drivers
3.2.1 Momentum Boosters – Growth Triggers
3.2.2 Innovation Fuel – Disruptive Technologies
3.3 Headwinds & Crosswinds – Market Restraints
3.3.1 Regulatory Tides – Compliance Challenges
3.3.2 Economic Frictions – Inflationary Pressures
3.4 Untapped Horizons – Growth Potential & Opportunities
3.5 Strategic Navigation – Industry Frameworks
3.5.1 Market Equilibrium – Porter’s Five Forces
3.5.2 Ecosystem Dynamics – Value Chain Analysis
3.5.3 Macro Forces – PESTEL Breakdown
3.6 Price Trend Analysis
3.6.1 Regional Price Trend
3.6.2 Price Trend by product
CHAPTER NO. 4 : KEY INVESTMENT EPICENTER
4.1 Regional Goldmines – High-Growth Geographies
4.2 Portability Frontiers – Lucrative Portability Categories
4.3 Application Sweet Spots – Emerging Demand Segments
CHAPTER NO. 5: REVENUE TRAJECTORY & WEALTH MAPPING
5.1 Momentum Metrics – Forecast & Growth Curves
5.2 Regional Revenue Footprint – Market Share Insights
5.3 Segmental Wealth Flow – Product Type & Application Revenue
CHAPTER NO. 6 : TRADE & COMMERCE ANALYSIS
6.1. Import Analysis by Region
6.1.1. Global Beauty Devices Market Import Revenue By Region
6.2. Export Analysis by Region
6.2.1. Global Beauty Devices Market Export Revenue By Region
CHAPTER NO. 7 : COMPETITION ANALYSIS
7.1. Company Market Share Analysis
7.1.1. Global Beauty Devices Market: Company Market Share
7.2. Global Beauty Devices Market Company Revenue Market Share
7.3. Strategic Developments
7.3.1. Acquisitions & Mergers
7.3.2. New Portability Launch
7.3.3. Regional Expansion
7.4. Competitive Dashboard
7.5. Company Assessment Metrics, 2024
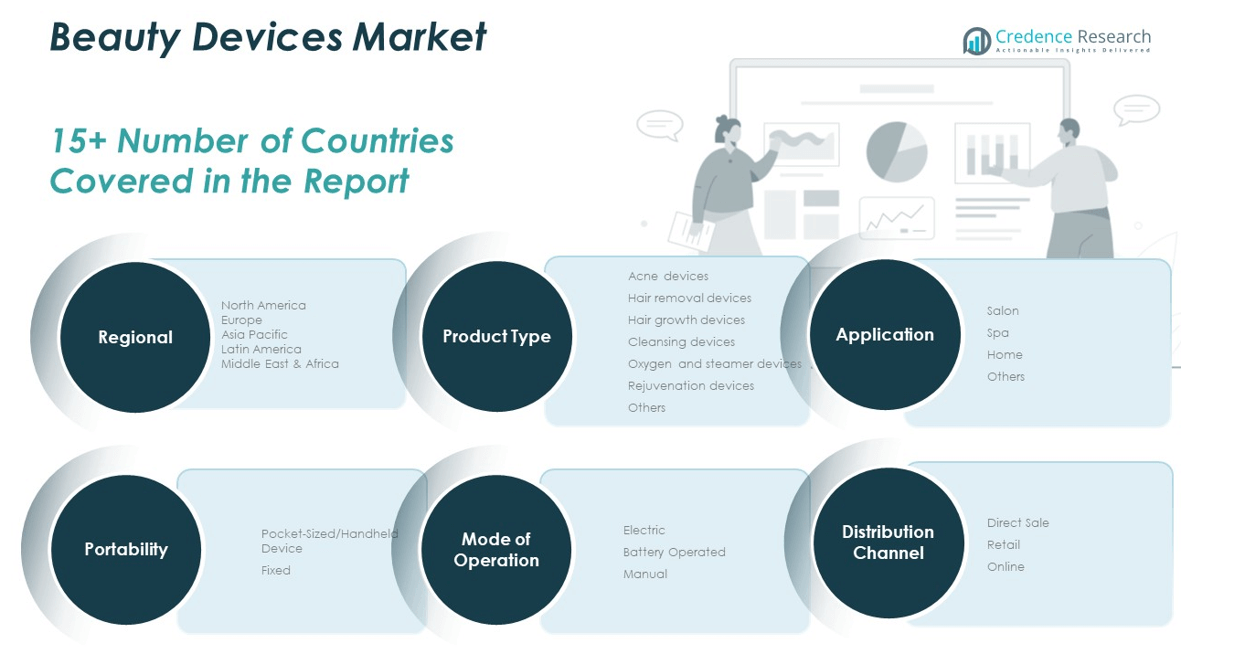
CHAPTER NO. 8 : BEAUTY DEVICES MARKET – BY PRODUCT TYPE SEGMENT ANALYSIS
8.1. Beauty Devices Market Overview by Product Type Segment
8.1.1. Beauty Devices Market Revenue Share By Product Type
8.2. Acne Devices
8.3. Hair Removal Devices
8.4. Hair Growth Devices
8.5. Cleansing Devices
8.6. Oxygen And Steamer Devices
8.7. Rejuvenation Devices
8.8. Others
CHAPTER NO. 9 : BEAUTY DEVICES MARKET – BY APPLICATION SEGMENT ANALYSIS
9.1. Beauty Devices Market Overview by Application Segment
9.1.1. Beauty Devices Market Revenue Share By Application
9.2. Salon
9.3. Spa
9.4. Home
9.5. Others
CHAPTER NO. 10 : BEAUTY DEVICES MARKET – BY PORTABILITY SEGMENT ANALYSIS
10.1. Beauty Devices Market Overview by Portability Segment
10.1.1. Beauty Devices Market Revenue Share By Portability
10.2. Pocket-Sized/Handheld Device
10.3. Fixed
CHAPTER NO. 11 : BEAUTY DEVICES MARKET – BY DISTRIBUTION CHANNEL SEGMENT ANALYSIS
11.1. Beauty Devices Market Overview by Distribution Channel Segment
11.1.1. Beauty Devices Market Revenue Share By Distribution Channel
11.2. Direct Sale
11.3. Retail
11.4. Online
CHAPTER NO. 12 : BEAUTY DEVICES MARKET – BY MODE OF OPERATION SEGMENT ANALYSIS
12.1. Beauty Devices Market Overview by Mode of Operation Segment
12.1.1. Beauty Devices Market Revenue Share By Mode of Operation
12.2. Electric
12.3. Battery Operated
12.4. Manual
CHAPTER NO. 13 : BEAUTY DEVICES MARKET – REGIONAL ANALYSIS
13.1. Beauty Devices Market Overview by Region Segment
13.1.1. Global Beauty Devices Market Revenue Share By Region
13.1.2. Regions
13.1.3. Global Beauty Devices Market Revenue By Region
13.1.4. Product Type
13.1.5. Global Beauty Devices Market Revenue By Product Type
13.1.6. Application
13.1.7. Global Beauty Devices Market Revenue By Application
13.1.8. Portability
13.1.9. Global Beauty Devices Market Revenue By Portability
13.1.10. Distribution Channel
13.1.12. Global Beauty Devices Market Revenue By Distribution Channel
13.1.13. Mode of Operation
13.1.14. Global Beauty Devices Market Revenue By Mode of Operation
CHAPTER NO. 14 : NORTH AMERICA BEAUTY DEVICES MARKET – COUNTRY ANALYSIS
14.1. North America Beauty Devices Market Overview by Country Segment
14.1.1. North America Beauty Devices Market Revenue Share By Region
14.2. North America
14.2.1. North America Beauty Devices Market Revenue By Country
14.2.2. Product Type
14.2.3. North America Beauty Devices Market Revenue By Product Type
14.2.4. Application
14.2.5. North America Beauty Devices Market Revenue By Application
14.2.6. Portability
14.2.7. North America Beauty Devices Market Revenue By Portability
14.2.8. Distribution Channel
14.2.9. North America Beauty Devices Market Revenue By Distribution Channel
14.2.10. Mode of Operation
14.2.11. North America Beauty Devices Market Revenue By Mode of Operation
14.3. U.S.
14.4. Canada
14.5. Mexico
CHAPTER NO. 15 : EUROPE BEAUTY DEVICES MARKET – COUNTRY ANALYSIS
15.1. Europe Beauty Devices Market Overview by Country Segment
15.1.1. Europe Beauty Devices Market Revenue Share By Region
15.2. Europe
15.2.1. Europe Beauty Devices Market Revenue By Country
15.2.2. Product Type
15.2.3. Europe Beauty Devices Market Revenue By Product Type
15.2.4. Application
15.2.5. Europe Beauty Devices Market Revenue By Application
15.2.6. Portability
15.2.7. Europe Beauty Devices Market Revenue By Portability
15.2.8. Distribution Channel
15.2.9. Europe Beauty Devices Market Revenue By Distribution Channel
15.2.10. Mode of Operation
15.2.11. Europe Beauty Devices Market Revenue By Mode of Operation
15.3. UK
15.4. France
15.5. Germany
15.6. Italy
15.7. Spain
15.8. Russia
15.9. Rest of Europe
CHAPTER NO. 16 : ASIA PACIFIC BEAUTY DEVICES MARKET – COUNTRY ANALYSIS
16.1. Asia Pacific Beauty Devices Market Overview by Country Segment
16.1.1. Asia Pacific Beauty Devices Market Revenue Share By Region
16.2. Asia Pacific
16.2.1. Asia Pacific Beauty Devices Market Revenue By Country
16.2.2. Product Type
16.2.3. Asia Pacific Beauty Devices Market Revenue By Product Type
16.2.4. Application
16.2.5. Asia Pacific Beauty Devices Market Revenue By Application
16.2.6. Portability
16.2.7. Asia Pacific Beauty Devices Market Revenue By Portability
16.2.8. Distribution Channel
16.2.9. Asia Pacific Beauty Devices Market Revenue By Distribution Channel
16.2.10. Mode of Operation
16.2.11. Asia Pacific Beauty Devices Market Revenue By Mode of Operation
16.3. China
16.4. Japan
16.5. South Korea
16.6. India
16.7. Australia
16.8. Southeast Asia
16.9. Rest of Asia Pacific
CHAPTER NO. 17 : LATIN AMERICA BEAUTY DEVICES MARKET – COUNTRY ANALYSIS
17.1. Latin America Beauty Devices Market Overview by Country Segment
17.1.1. Latin America Beauty Devices Market Revenue Share By Region
17.2. Latin America
17.2.1. Latin America Beauty Devices Market Revenue By Country
17.2.2. Product Type
17.2.3. Latin America Beauty Devices Market Revenue By Product Type
17.2.4. Application
17.2.5. Latin America Beauty Devices Market Revenue By Application
17.2.6. Portability
17.2.7. Latin America Beauty Devices Market Revenue By Portability
17.2.8. Distribution Channel
17.2.9. Latin America Beauty Devices Market Revenue By Distribution Channel
17.2.10. Mode of Operation
17.2.11. Latin America Beauty Devices Market Revenue By Mode of Operation
17.3. Brazil
17.4. Argentina
17.5. Rest of Latin America
CHAPTER NO. 18 : MIDDLE EAST BEAUTY DEVICES MARKET – COUNTRY ANALYSIS
18.1. Middle East Beauty Devices Market Overview by Country Segment
18.1.1. Middle East Beauty Devices Market Revenue Share By Region
18.2. Middle East
18.2.1. Middle East Beauty Devices Market Revenue By Country
18.2.2. Product Type
18.2.3. Middle East Beauty Devices Market Revenue By Product Type
18.2.4. Application
18.2.5. Middle East Beauty Devices Market Revenue By Application
18.2.6. Portability
18.2.7. Middle East Beauty Devices Market Revenue By Portability
18.2.8. Distribution Channel
18.2.9. Middle East Beauty Devices Market Revenue By Distribution Channel
18.2.10. Mode of Operation
18.2.11. Middle East Beauty Devices Market Revenue By Mode of Operation
18.3. GCC Countries
18.4. Israel
18.5. Turkey
18.6. Rest of Middle East
CHAPTER NO. 19 : AFRICA BEAUTY DEVICES MARKET – COUNTRY ANALYSIS
19.1. Africa Beauty Devices Market Overview by Country Segment
19.1.1. Africa Beauty Devices Market Revenue Share By Region
19.2. Africa
19.2.1. Africa Beauty Devices Market Revenue By Country
19.2.2. Product Type
19.2.3. Africa Beauty Devices Market Revenue By Product Type
19.2.4. Application
19.2.5. Africa Beauty Devices Market Revenue By Application
19.2.6. Portability
19.2.7. Africa Beauty Devices Market Revenue By Portability
19.2.8. Distribution Channel
19.2.9. Africa Beauty Devices Market Revenue By Distribution Channel
19.2.10. Mode of Operation
19.2.11. Africa Beauty Devices Market Revenue By Mode of Operation
19.3. South Africa
19.4. Egypt
19.5. Rest of Africa
CHAPTER NO. 20 : COMPANY PROFILES
20.1. L’Oréal
20.1.1. Company Overview
20.1.2. Portability Portfolio
20.1.3. Financial Overview
20.1.4. Recent Developments
20.1.5. Growth Strategy
20.1.6. SWOT Analysis
20.2. Procter & Gamble (US)
20.3. Estée Lauder Companies (US)
20.4. Shiseido Company, Limited (Japan)
20.5. Philips (Netherlands)
20.6. Panasonic (Japan)
20.7. LG Electronics (South Korea)
20.8. FOREO (Sweden)
20.9. Nu Skin Enterprises (US)
20.10. Carol Cole Company (NuFace) (US)
20.11. YA-MAN LTD. (Japan)
20.12. MTG Co., Ltd. (Japan)
20.13. Réduit (Switzerland)
20.14. JeNu (US)
20.15. LightStim (US)
20.16. SmoothSkin (UK)
20.17. Project E Beauty (US)
20.18. Skin Gym (US)
20.19. Droplette (US)
20.20. HighTech Beauty (Israel)