
Algae Ink Market Overview:
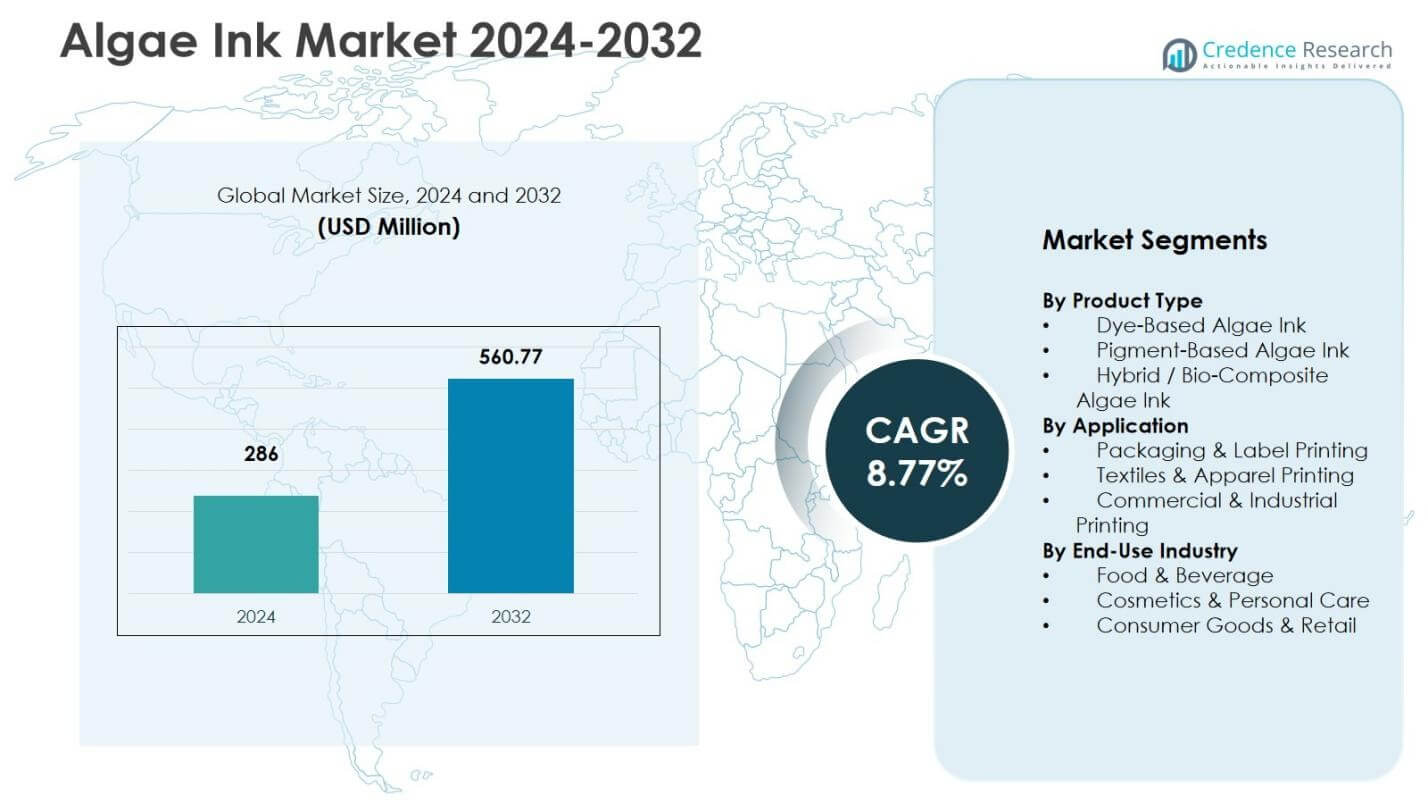
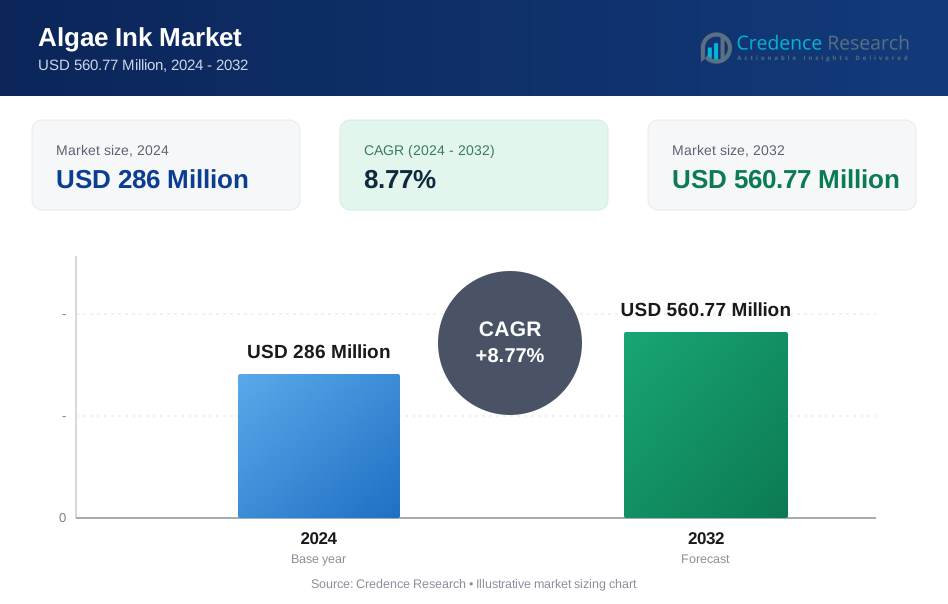
Algae ink market size was valued at USD 286 million in 2024 and is projected to reach USD 560.77 million by 2032, implying a CAGR of 8.77% over the forecast period.
| REPORT ATTRIBUTE | DETAILS |
|---|---|
| Historical Period | 2020-2023 |
| Base Year | 2024 |
| Forecast Period | 2025-2032 |
| Algae Ink Market Size 2024 | USD 286 million |
| Algae Ink Market, CAGR | 8.77% |
| Algae Ink Market Size 2032 | USD 560.77 million |
The market includes innovation-focused suppliers such as Living Ink Technologies, Nature Coatings, Vollebak, Algix, Green Pigment Labs, BioGraphix, Advanced Algae Solutions, EcoAlgae Print Solutions, Living Carbon Ink, and AlgaeTech, which focus on bio-pigment development, scaling production, and improving ink performance for packaging, textiles, and labeling. Companies commonly expand through product development, sustainability-oriented partnerships, and piloting use cases in industrial printing. North America led in 2024 with a 36.4% share, supported by adoption in packaging and apparel branding, followed by Europe and Asia Pacific, where regulatory focus and sustainability programs are associated with growing interest in bio-based materials.
Algae Ink Market Insights
- The algae ink market was USD 286 million in 2024 and is expected to reach USD 560.77 million by 2032, growing at a CAGR of 8.77% during the forecast period.
- Growth is linked to demand for bio-based printing materials, wider ESG adoption in packaging and textiles, and uptake of pigment-based algae ink, which accounted for 46.2% share in 2024 and is positioned around durability and print stability.
- Trends include increasing use in eco-fashion, premium labeling, and sustainability-led branding, alongside partnerships between material innovators and packaging converters aimed at scaling algae-derived pigments.
- Constraints include higher production costs, limited large-scale manufacturing capacity, and performance consistency challenges versus conventional synthetic inks, which can slow adoption among price-sensitive industrial users.
- North America led with a 36.4% share in 2024, followed by Europe (28.7%) and Asia Pacific (24.1%), where sustainability programs and growth in textiles and packaging support adoption.
Algae Ink Market Segmentation Analysis:
By Product Type:
Pigment-based algae ink accounted for 46.2% share in 2024. Demand for pigment-based formulations is linked to color stability, durability, and compatibility with commercial printing requirements, including better resistance to UV exposure and moisture in some applications. Dye-based algae ink is used more often in smaller-batch and creative printing where vibrancy is prioritized, while hybrid/bio-composite systems are developing as suppliers aim to increase bio-content and meet procurement requirements tied to circular-economy or sustainability goals.
- For instance, Living Ink Technologies markets ALGAE INK™ using ALGAE BLACK™ pigment with soy- or water-based carriers and claims 83% bio-renewable content for offset printing on hang tags and packaging, with positioning around ink-water balance on coated papers.
By Application:
Packaging & label printing accounted for 51.8% share in 2024. This segment is supported by demand for lower-impact printing inputs in food, cosmetics, and branded consumer products, often linked to corporate ESG targets and packaging sustainability initiatives. Textiles & apparel printing follows as brands test algae-based inks in eco-fashion and natural-pigment branding, while commercial and industrial printing remains a smaller but growing area in signage and promotional applications where sustainability claims influence procurement.
- For instance, Crocs partnered with Living Ink Technologies and EcoEnclose to print Jibbitz charm boxes using algae-derived inks in CMYK processes beginning in August 2023, replacing petroleum-based carbon black in the printed packaging.
By End-Use Industry:
Food & beverage led with a 39.5% share in 2024, reflecting adoption in packaging and labeling where brands emphasize sustainability and “clean label” positioning. Cosmetics & personal care is described as a higher-growth segment due to premium branding and recyclable-label strategies, while consumer goods and retail usage is linked to packaging and merchandising applications intended to support sustainability communication. Assumptions around regulatory fit for food-contact packaging depend on local rules and specific ink formulations, which vary by supplier and certification.
Algae Ink Market Key Growth Drivers
Rising Demand for Sustainable and Bio-Based Printing Solutions Adoption is supported by brand and converter efforts to reduce reliance on petroleum-derived pigments and align materials with sustainability commitments. Algae-derived pigments are positioned as lower-impact alternatives that can support ESG reporting and brand differentiation. Consumer interest in environmentally responsible packaging can reinforce adoption in certain categories, although the degree of demand pull varies by price sensitivity and performance requirements.
- For instance, Nike’s ISPA sub-brand has used Living Ink’s flexographic algae ink on some footwear boxes introduced in late spring 2024, positioned as a drop-in replacement for petroleum-derived carbon black while meeting black color specifications.
Growing Adoption in Packaging and Labeling Applications
Packaging and labeling are central demand areas because they combine high print volumes with visible brand sustainability messaging. Adoption is supported where algae inks are compatible with water-based systems and where converters can validate runnability, drying, and durability on target substrates. Regulatory pressure on packaging waste and corporate commitments to recyclable or compostable materials can increase interest in bio-based inks, though switching decisions also depend on cost, availability, and certification readiness.
- For instance, Patagonia uses Living Ink’s algae ink on packaging and hang tags, positioning it as a bio-based option compatible with offset printing and aqueous coatings.
Technological Advancements in Bio-Pigment Extraction and Ink Formulation
R&D in algae cultivation, pigment extraction, and ink formulation is intended to reduce performance gaps with conventional inks. Progress in viscosity control, stability, and print-system compatibility can broaden applicability to higher-speed printing and textiles. Hybrid systems may improve durability and expand the achievable color range, but scale-up remains dependent on manufacturing investment, process yields, and consistency controls.
Algae Ink Market Key Trends & Opportunities
Expansion into Fashion, Textile Printing, and Eco-Branding Applications
Textiles and apparel branding are expanding use cases, driven by eco-fashion positioning and interest in natural-pigment alternatives. Collaborations between apparel brands and bio-ink developers can accelerate market entry via limited runs and brand storytelling, with broader scaling dependent on color consistency, wash fastness, and cost.
For instance, Portuguese manufacturer SILSA has used OEKO-TEX certified algae ink in textile screen-printing collections positioned around regenerative cotton and bio-based black pigments derived from algae waste streams.
Strategic Partnerships, Commercial Pilots, and Scaling of Green Printing Ecosystems
Partnerships and pilot deployments are a common route to validate performance, build trust with converters, and secure recurring demand. Scaling opportunities increase where suppliers invest in bio-manufacturing capacity and standardize performance testing for different substrates and printing methods. Over time, competition is likely to shift toward consistent supply, cost reduction, and verified lifecycle impacts, as sustainability claims face greater scrutiny.
- For instance, Trimco Group has collaborated with Living Ink on algae-ink printing for hangtags, demonstrating integration into merchandising label production while using algae biomass waste as an input.
Algae Ink Market Key Challenges
High Production Costs and Limited Large-Scale Manufacturing Infrastructure Higher costs relative to conventional inks remain a key barrier, driven by algae cultivation inputs, pigment extraction steps, and smaller production scale. Limited industrial capacity can also constrain supply reliability and pricing for large converters. Until cost competitiveness improves and supply chains mature, adoption may remain concentrated in premium branding and pilot programs rather than broad commodity packaging.
Color Range, Performance Consistency, and Market Awareness Limitations
Performance consistency and color range are common constraints, particularly for applications requiring tight brand-color tolerances, UV durability, and repeatability across substrates. Some users may view algae inks as early-stage solutions, which increases the importance of certifications, third-party testing, and transparent performance data. Broader adoption likely depends on standardized specifications, application guidance, and converter familiarity.
Algae Ink Market Regional Analysis
North America
North America accounted for 36.4% share in 2024, supported by adoption in sustainable packaging, premium labeling, and brand-led apparel programs. Market development is linked to availability of material innovation ecosystems, converter partnerships, and stronger corporate ESG activity, particularly in the United States.
Europe
Europe held 28.7% share in 2024, supported by environmental regulation, circular-economy initiatives, and higher emphasis on sustainable packaging inputs. Adoption is reinforced by collaboration across printers, packaging converters, and materials developers, with demand concentrated in labeling and branded consumer goods where sustainability compliance is a procurement factor.
Asia Pacific
Asia Pacific accounted for 24.1% share in 2024 and is positioned as a fast-growing region due to large packaging and textile manufacturing bases and rising sustainability commitments by brands. Government initiatives promoting bio-based materials can support adoption, while scaling depends on local converter validation and cost-performance tradeoffs in high-volume applications.
Latin America
Latin America held 6.2% share in 2024, with adoption described as gradual and concentrated in sustainability-focused packaging initiatives. Growth is linked to brand-led eco-packaging programs and partnerships with international suppliers, while industrial-scale penetration remains limited by cost and supply availability.
Middle East & Africa
Middle East & Africa accounted for 4.6% share in 2024, reflecting early-stage adoption in premium packaging, cosmetics labeling, and niche textile use cases. Growth is supported by sustainability initiatives in markets such as the UAE, Saudi Arabia, and South Africa, while broader scaling is constrained by limited local supply chains and uneven converter readiness.
Algae Ink Market Segmentations:
By Product Type
- Dye-Based Algae Ink
- Pigment-Based Algae Ink
- Hybrid / Bio-Composite Algae Ink
By Application
- Packaging & Label Printing
- Textiles & Apparel Printing
- Commercial & Industrial Printing
By End-Use Industry
- Food & Beverage
- Cosmetics & Personal Care
- Consumer Goods & Retail
By Geography
- North America
- U.S.
- Canada
- Mexico
- Europe
- Germany
- France
- U.K.
- Italy
- Spain
- Rest of Europe
- Asia Pacific
- China
- Japan
- India
- South Korea
- South-east Asia
- Rest of Asia Pacific
- Latin America
- Brazil
- Argentina
- Rest of Latin America
- Middle East & Africa
- GCC Countries
- South Africa
- Rest of the Middle East and Africa
Competitive Landscape
The competitive landscape includes specialized startups and material innovators such as Living Ink Technologies, Nature Coatings, Vollebak, Algix, Green Pigment Labs, BioGraphix, Advanced Algae Solutions, EcoAlgae Print Solutions, Living Carbon Ink, and AlgaeTech. Competition centers on pigment performance, compatibility with commercial printing systems, cost and scale readiness, and the ability to support customer validation with testing data and certifications. Partnerships with packaging converters, apparel brands, and sustainable-material suppliers are a primary commercialization route, especially for pilots and brand-led packaging transitions. As adoption grows, differentiation is likely to increasingly depend on supply reliability, demonstrated performance across substrates, and verifiable lifecycle-impact claims.
Key Player Analysis
- Living Ink Technologies
- Nature Coatings
- Vollebak
- Advanced Algae Solutions
- Living Carbon Ink
- EcoAlgae Print Solutions
- BioGraphix
- Green Pigment Labs
- Algix
- AlgaeTech
Recent Developments
- In December 2025, Ryonet announced an exclusive distribution partnership with Living Ink Technologies for Screen ALGAE INK, positioned as a carbon-negative black ink for screen printing.
- In December 2025, Living Ink Technologies announced a partnership with Ryonet to distribute Algae Ink™ in the U.S. for screen-printing applications via ScreenPrinting.com.
- In November 2025, Living Ink Technologies participated in the Grow-NY Food and AgTech Startup Competition to present its waste-to-value bio-pigment approach and pursue industrial partnerships.
- In August 2025, Crocs partnered with Living Ink Technologies to launch retail packaging printed with Algae Ink™ in CMYK for Jibbitz™ charm boxes, positioned as a commercial full-color application replacing petroleum-derived carbon black.
Report Coverage
The research report analyzes the market by product type, application, end-use industry, and geography. It profiles leading participants by product approach and commercialization strategy and reviews drivers, constraints, and market trends. It also considers regulatory context and technology developments affecting adoption, alongside external factors that can influence demand. The report includes strategic considerations for both new entrants and established suppliers operating in sustainable printing materials.
Future Outlook
- The market is expected to expand as sustainability commitments and low-carbon material adoption increase in packaging and textiles.
- R&D investment is expected to focus on improving color range, durability, and printing performance to reduce gaps versus synthetic inks.
- Partnerships between ink developers, converters, and brands are expected to remain important for validation and scaling.
- Regulatory and procurement shifts toward lower-impact materials are expected to support demand in labeling and branded packaging.
- Apparel and textile applications are expected to grow where algae inks meet wash fastness and color-consistency requirements.
- Capacity expansion and process improvements are expected to be needed to reduce costs and improve supply reliability.
- Market acceptance is expected to improve through certifications, pilots, and clearer performance and lifecycle-impact evidence.
- Hybrid bio-composite formulations are likely to grow as suppliers balance performance requirements with bio-content targets.
- Growth in Europe and Asia Pacific is expected to be supported by policy focus and manufacturing scale, subject to cost competitiveness.
- Competitive differentiation is expected to shift toward verified lifecycle impact, reliable supply, and application-specific performance proof.
Request a Free Sample
Fill in your details and we'll send you a free sample report.
- Sample data tables & charts
- Research methodology
Need a Custom Version of This Report?
Tailor the scope, geography, or segments to your exact requirements.
- Custom geography or segment scope
- Direct access to our analyst team
Frequently Asked Questions
What is the current market size for the Algae Ink Market, and what is its projected size in 2032?
At what Compound Annual Growth Rate is the Algae Ink Market projected to grow between 2024 and 2032?
Which Algae Ink Market segment held the largest share in 2024?
What are the primary factors fueling the growth of the Algae Ink Market?
Who are the leading companies in the Algae Ink Market?
Which region commanded the largest share of the Algae Ink Market in 2024?
Table of Content
Chapter 1. Report Introduction
- 1.1 Report Description & Purpose
- 1.1.1 Report Title & Market Definition
- 1.1.2 Unique Selling Propositions (USP) & Key Differentiators
- 1.1.3 Value Proposition for Stakeholders
- 1.2 Research Objectives
- 1.2.1 Market Sizing Objectives (Volume & Revenue)
- 1.2.2 Segmentation Objectives
- 1.2.3 Competitive Intelligence Objectives
- 1.2.4 Forecast & Scenario Objectives
- 1.3 Report Scope
- 1.3.1 Algae Ink Scope – Types & Subtypes Covered
- 1.3.2 Geographic Scope – Regions & Countries Covered
- 1.3.3 Historical Period, Base Year & Forecast Period (2024; forecast to 2032)
- 1.3.4 Inclusions & Exclusions
- 1.4 HS Code & Classification Framework
- 1.5 Currency, Units & Pricing Basis
- 1.6 Target Stakeholders
- 1.7 Limitations & Assumptions
Chapter 2. Executive Summary
- 2.1 Global Algae Ink Market Snapshot
- 2.1.1 Market Size – Historical (2024) & Forecast (2024-2032) (2024: USD 286 Million → 2032: USD 560.77 Million)
- 2.1.2 Volume & Revenue – Global Totals
- 2.1.3 Key Market Highlights – Top Five Facts
- 2.2 Algae Ink Market Segmentation Snapshot
- 2.2.1 Market Split by Region – 2024 vs. 2032
- 2.3 Competitive Snapshot
- 2.3.1 Top 10 Players by Revenue Share – 2024
- 2.3.2 Top 10 Players by Volume Share – 2024
- 2.3.3 Recent Strategic Developments (18-Month Summary)
- 2.4 Key Investment Highlights & Strategic Conclusions
Chapter 3. Algae Ink Market Dynamics & Industry Analysis
- 3.1 Market Overview & Context
- 3.1.1 Algae Ink Market Position in the Broader Automotive Value Chain
- 3.1.2 OEM vs. Replacement Market Dynamics
- 3.1.3 Market Maturity & Development Stage by Region
- 3.2 Algae Ink Market Drivers
- 3.3 Algae Ink Market Restraints & Challenges
- 3.4 Algae Ink Market Opportunities
- 3.5 Porter's Five Forces Analysis
- 3.5.1 Threat of New Entrants
- 3.5.2 Bargaining Power of Suppliers
- 3.5.3 Bargaining Power of Buyers
- 3.5.4 Threat of Substitutes
- 3.5.5 Competitive Rivalry – Intensity Assessment
- 3.6 Algae Ink Value Chain Analysis
- 3.6.1 Upstream – Raw Material/Input Suppliers
- 3.6.1.1 Raw Material/Input 1
- 3.6.1.2 Raw Material/Input 2
- 3.6.1.3 Raw Material/Input 3
- 3.6.2 Midstream – Production/Manufacturing/Service Delivery
- 3.6.2.1 Production/Process Overview
- 3.6.2.2 Key Facility Locations & Capacity by Manufacturer
- 3.6.3 Downstream – Distribution & End Consumer
- 3.6.3.1 Primary Channel – B2B/OEM
- 3.6.3.2 Secondary Channels – Dealer, Retail, Online, Direct
- 3.6.4 Value Chain Profitability Analysis
- 3.6.1 Upstream – Raw Material/Input Suppliers
- 3.7 PESTEL Analysis
- 3.7.1 Political Factors
- 3.7.2 Economic Factors
- 3.7.3 Social Factors
- 3.7.4 Technological Factors
- 3.7.5 Environmental Factors
- 3.7.6 Legal Factors
- 3.8 Algae Ink Supply Chain Analysis
- 3.8.1 Raw Material/Input Supply Risk Assessment
- 3.8.2 Manufacturing Concentration Risk (Geographic Exposure)
- 3.8.3 Trade Disruption Impact Analysis
- 3.9 Regulatory & Policy Landscape
Note: The regulatory and policy landscape section covers regulations based on their applicability to the market, Algae Ink category, geography, and scope of the study. Only regulatory frameworks with a material impact on operations, compliance, trade, sustainability, or market access are analyzed in detail.
Chapter 4. Key Investment Pockets & Opportunity Analysis
- 4.1 Algae Ink Market Attractiveness Analysis
- 4.1.1 By Region – Investment Attractiveness Matrix (Volume × CAGR)
- 4.2 Absolute Revenue Growth Opportunity
- 4.2.1 By Region – Absolute USD Growth Through 2032
- 4.3 Incremental Volume Opportunity
- 4.3.1 By Region – Incremental Volume Through 2032
- 4.3.2 Segment – Incremental Volume
- 4.4 Emerging Submarket Opportunity Deep Dive (Subject to Applicability)
- 4.5 Emerging Market Opportunity Scorecards
- 4.5.1 United States
- 4.5.2 Europe
- 4.5.3 Asia
- 4.5.4 Middle East & Africa
Note: Emerging Market Opportunity Scorecards will be included based on relevance and strategic importance. Regions listed are indicative and may vary depending on data availability and market dynamics.
Chapter 5. Algae Ink Import-Export Analysis & Trade Flows
- 5.1 Global Trade Overview
- 5.1.1 Global Export Value by Country (2024)
- 5.1.2 Global Export Volume by Country (2024)
- 5.1.3 Global Import Value by Country (2024)
- 5.1.4 Global Import Volume by Country (2024)
- 5.1.5 Net Trade Balance by Country (2024)
- 5.2 Export Analysis – Segment
- 5.2.1 Type 1 (HS Code)
- 5.2.2 Type 2 (HS Code)
- 5.2.3 Type 3 (HS Code)
- 5.2.4 Type 4 (HS Code)
- 5.2.5 Type 5 (HS Code)
- 5.3 Import Analysis – Segment
- 5.3.1 Type 1 (HS Code)
- 5.3.2 Type 2 (HS Code)
- 5.3.3 Type 3 (HS Code)
- 5.3.4 Type 4 (HS Code)
- 5.3.5 Type 5 (HS Code)
- 5.4 Average Unit Trade Prices
- 5.4.1 Average Export Price – Segment & Country
- 5.4.2 Average Import Price – Segment & Source Country
- 5.4.3 Price Trends (2024)
- 5.5 Key Trade Route Analysis
- 5.5.1 Trade Route 1
- 5.5.2 Trade Route 2
- 5.5.3 Trade Route 3
- 5.5.4 Trade Route 4
- 5.5.5 Trade Route 5
- 5.6 Trade Policy Impact Assessment
- 5.6.1 US Anti-Dumping & Section 301 Tariffs
- 5.6.2 EU Customs Union Impact
- 5.6.3 Major Free Trade Agreements
- 5.6.4 USMCA Rules of Origin
Note: Trade policy analysis will be included only where relevant to the Algae Ink market.
Chapter 6. Competitive Landscape & Company Benchmarking
- 6.1 Algae Ink Market Concentration & Structure
- 6.1.1 Herfindahl-Hirschman Index (HHI) – vs. 2024
- 6.1.2 Tier 1, Tier 2 & Tier 3 Market Structure
- 6.1.3 Global, Regional & Local Player Dynamics
- 6.2 Algae Ink Market Share Analysis – 2024
- 6.2.1 Global Revenue Share by Company
- 6.2.2 Global Volume Share by Company
- 6.2.3 Regional Revenue Share
- 6.2.4 Market Share Evolution ( vs. 2024)
- 6.2.5 OEM Segment Share by Company
- 6.2.6 Replacement Segment Share by Company
- 6.3 Production/Delivery Capacity & Facility Analysis
- 6.3.1 Global Installed Capacity
- 6.3.2 Capacity Utilization Rates
- 6.3.3 Production/Output Volume
- 6.3.4 Facility Locations & Capacity Map
- 6.3.5 Planned Capacity Additions
- 6.4 Algae Ink Competitive Benchmarking Matrix
- 6.4.1 Revenue, Volume, CAGR & Profitability Comparison
- 6.4.2 Channel Revenue Mix
- 6.4.3 Geographic Revenue Exposure
- 6.4.4 R&D Intensity
- 6.4.5 Sustainability Maturity
- 6.5 Strategic Developments in Algae Ink (Last 24 Months)
- 6.5.1 Mergers, Acquisitions & Divestments
- 6.5.2 New Algae Ink Launches
- 6.5.3 Facility Expansions
- 6.5.4 Strategic Alliances, Joint Ventures & Partnerships
- 6.5.5 Distribution Expansion & Market Entry
- 6.5.6 Sustainability & ESG Initiatives
- 6.6 Competitive Strategy Mapping
- 6.6.1 Leader, Challenger, Follower & Niche Classification
- 6.6.2 Pricing Strategy Comparison
- 6.6.3 Channel Strategy Matrix
Note: Strategic developments are included based on their materiality and the availability of reliable information.
Chapter 7. Global Algae Ink Market – By Distribution Channel
- 7.1 Segment Overview
- 7.1.1 Volume & Revenue Split by Channel (2024 & 2032)
- 7.1.2 Channel Mix Evolution (2024-2032)
Chapter 8. Regional Market Analysis – Global Overview
- 8.1 Global Regional Overview
- 8.1.1 Regional Volume Share
- 8.1.2 Regional Revenue Share
- 8.1.3 Regional Volume by Region
- 8.1.4 Regional Revenue by Region
- 8.1.5 Regional Forecast Through 2032
- 8.2 Cross-Regional Segment Analysis
- 8.2.1 By Distribution Channel
- 8.2.2 By Brand/Price Tier
Chapter 9. North America Algae Ink Market
- 9.1 United States
- 9.2 Canada
- 9.3 Mexico
Chapter 10. Europe Algae Ink Market
- 10.1 Germany
- 10.2 France
- 10.3 Italy
- 10.4 United Kingdom
- 10.5 Spain
- 10.6 Poland
- 10.7 Russia
- 10.8 Netherlands
- 10.9 Belgium
- 10.10 Sweden
- 10.11 Denmark
- 10.12 Norway
- 10.13 Rest of Europe
Chapter 11. Asia Pacific Algae Ink Market
- 11.1 China
- 11.2 India
- 11.3 Japan
- 11.4 South Korea
- 11.5 Thailand
- 11.6 Indonesia
- 11.7 Vietnam
- 11.8 Malaysia
- 11.9 Australia
- 11.10 Rest of Asia Pacific
Chapter 12. Latin America Algae Ink Market
- 12.1 Brazil
- 12.2 Argentina
- 12.3 Colombia
- 12.4 Chile
- 12.5 Rest of Latin America
Chapter 13. Middle East Algae Ink Market
- 13.1 Saudi Arabia
- 13.2 United Arab Emirates
- 13.3 Turkey
- 13.4 Israel
- 13.5 Iran
- 13.6 Rest of the Middle East
Chapter 14. Africa Algae Ink Market
- 14.1 South Africa
- 14.2 Egypt
- 14.3 Nigeria
- 14.4 Morocco
- 14.5 Rest of Africa
Chapter 15. Algae Ink Company Profiles
- 15.1 [Company 01]
- 15.1.1 Company Overview
- 15.1.2 Key Management Personnel
- 15.1.3 Products & Services Portfolio
- 15.1.4 Financial Performance
- 15.1.5 Key Market Focus & Geographic Presence
- 15.1.6 Recent Developments & Strategic Initiatives
Note: The company profile list is preliminary and may change based on research findings, market developments, data availability, and client requirements.
Chapter 16. Appendices
- Appendix A – List of Abbreviations & Acronyms
- Appendix B – Industry Classification Code Reference – Full Series
- Appendix C – Production & Capacity Data Tables
- Appendix D – End-Use & Demand Base Tables
- Appendix E – Consumption & Replacement Rate Assumptions
- Appendix F – ASP Reference Tables
- Appendix G – Manufacturing & Facility Database
- Appendix H – Import-Export Data Tables
- Appendix I – Regulatory Summary Tables
- Appendix J – Primary Research Participant List (Anonymized)
- Appendix K – Primary Research Questionnaire Framework
- Appendix L – Data Sources & Bibliography
- Appendix M – Market Size Divergence & Source Comparison
Chapter 17. Research Methodology
- 17.1 Research Framework & Philosophy
- 17.2 Secondary Research – Sources, Hierarchy & Data Extraction
- 17.3 Data Modeling – Bottom-Up & Top-Down Market Sizing
- 17.4 Primary Research – Stakeholder Framework, LOI & Sample Sizes
- 17.5 Forecast Methodology – Regression, Scenario & Sensitivity Analysis
- 17.6 Quality Control – Four-Layer Validation Framework
- 17.7 Limitations & Standard Assumptions
- 17.8 Disclaimer
