Market Overview
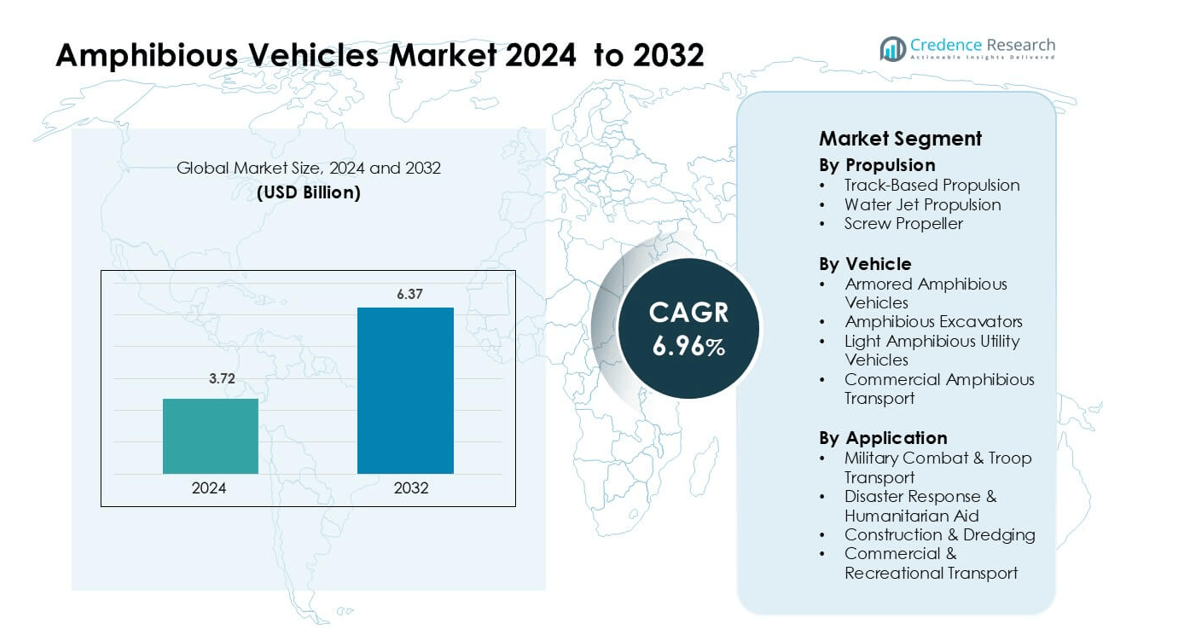
Amphibious Vehicles Market was valued at USD 3.72 billion in 2024 and is anticipated to reach USD 6.37 billion by 2032, growing at a CAGR of 6.96 % during the forecast period.
| REPORT ATTRIBUTE |
DETAILS |
| Historical Period |
2020-2023 |
| Base Year |
2024 |
| Forecast Period |
2025-2032 |
| Amphibious Vehicles Market Size 2024 |
USD 3.72 billion |
| Amphibious Vehicles Market, CAGR |
6.96% |
| Amphibious Vehicles Market Size 2032 |
USD 6.37 billion |
The Amphibious Vehicles Market is shaped by leading companies such as BAE Systems plc, General Dynamics Corporation, Rheinmetall AG, Hanwha Aerospace, Hitachi Construction Machinery Co., Ltd., EIK Engineering Sdn. Bhd., Wetland Equipment Company, Wilco Manufacturing L.L.C., Hydratrek, Inc., and Marsh Buggies Incorporated. These players compete through advanced hull engineering, stronger propulsion systems, and expanded applications across military, disaster-response, and industrial projects. North America remains the leading region with a 38% market share, supported by high defense spending, strong modernization programs, and growing adoption of amphibious platforms for emergency and commercial operations.
Market Insights
- The Amphibious Vehicles Market reached USD 3.72 billion in 2024 and will grow at a 6.96% CAGR through 2032, supported by rising defense, rescue, and industrial applications.
- Strong military procurement drives demand as armies expand amphibious combat fleets and upgrade tracked propulsion systems, which hold the largest segment share based on wide use in mixed-terrain missions.
- Hybrid propulsion upgrades, water-jet enhancements, and lightweight hull designs shape market trends as buyers seek higher mobility and fuel-efficient platforms across defense, construction, and disaster-response operations.
- Competition intensifies among BAE Systems plc, General Dynamics Corporation, Hanwha Aerospace, and Rheinmetall AG as companies introduce stronger multi-terrain designs, while smaller manufacturers expand in dredging and rescue segments; cost and maintenance challenges remain key restraints.
- North America leads the market with a 38% share, followed by Asia Pacific at 29% and Europe at 27%, while armored amphibious vehicles dominate by vehicle type due to strong military modernization programs.
Access crucial information at unmatched prices!
Request your sample report today & start making informed decisions powered by Credence Research Inc.!
Download Sample
Market Segmentation Analysis:
By Propulsion
Track-based propulsion holds the largest share due to strong use in defense and engineering operations. Military fleets prefer tracked systems for high traction on mud, swamps, and unstable terrain. The design supports heavy armor and equipment without losing stability. Demand grows as armies expand amphibious mobility programs and modernize legacy fleets. Water-jet propulsion rises in coastal patrol and rescue roles, while screw-propeller systems gain attention in niche industrial projects where slow but steady movement through marsh areas is required.
- For instance, the Indian Navy’s Larsen & Toubro developed a 651 kW water‑jet propulsion system with over 70 % indigenous content, successfully tested aboard a fast interceptor craft, highlighting the relevance of water‑jet systems for shallow‑water operations.
By Vehicle Type
Armored amphibious vehicles dominate the market with the highest share, driven by rising investment in marine-capable combat fleets. Defense agencies use these platforms for beach assaults, river crossings, and rapid troop movement across mixed terrain. Strong protection levels, multi-mission payload capacity, and upgraded amphibious drivetrains strengthen adoption. Amphibious excavators show steady demand in dredging and wetland projects, while utility and commercial amphibious vehicles gain traction in tourism, transport, and offshore support services.
- For instance, the SAUR 2 8×8 Amphibious Vehicle from ROMARM features a sealed hull, ground clearance of 450 mm, road speed of 100 km/h and water speed of 10 km/h, demonstrating how commercial‑type amphibious platforms are engineered for versatile terrain and water operations.
By Application
Military combat and troop transport leads the market as the dominant application due to expanding modernization plans and cross-border mobility needs. Defense forces rely on these platforms for amphibious landing missions, vehicle-borne assaults, and logistical transport across rivers and coastal zones. Disaster response agencies drive growth in rescue-focused systems, while construction and dredging applications expand with coastal development projects. Commercial and recreational transport also grows as tourism and water-based mobility solutions increase across coastal regions.
Key Growth Drivers
Rising Defense Modernization and Amphibious Warfare Programs
Global defense forces increase investment in amphibious fleets to strengthen coastal security and rapid-response capability. Military planners focus on platforms that operate across rivers, marshlands, and littoral zones without switching vehicles. Amphibious armored carriers and assault vehicles support faster troop deployment and reduce logistics delays in complex terrain. Nations upgrade older fleets with stronger propulsion, improved hull structures, and digital navigation tools. Rising territorial conflicts and marine border tensions accelerate procurement programs. Many countries also expand joint naval-land operations, which boosts demand for high-mobility amphibious systems. This shift drives steady growth in tactical and armored amphibious vehicle adoption across major defense markets.
- For instance, the Turkish defence‑industry firm FNSS Defence Systems is delivering 27 units of its ZAHA Marine Assault Vehicle (23 personnel carriers, 2 command & control vehicles, 2 rescue vehicles) to the Turkish Naval Forces Command under a contract signed in 2017, illustrating how modernization is translating into concrete fleet upgrades.
Expanding Disaster Response and Humanitarian Relief Needs
More floods, cyclones, and coastal emergencies create strong demand for vehicles that travel through submerged and debris-filled areas. Rescue teams choose amphibious units because they cross water, mud, and collapsed zones where normal trucks fail. Governments invest in specialized platforms that support evacuation, supply transport, and medical outreach during crises. Municipal agencies use amphibious vehicles to reach remote or cut-off communities faster. Their dual-terrain capability reduces operation time and enhances rescue success rates. Growing partnerships between emergency-response agencies and equipment manufacturers also encourage product innovation. This need for reliable multi-terrain mobility fuels sustained adoption in public-safety and disaster-management sectors.
- For instance, the ATOR N1200 amphibious all‑terrain vehicle built by JSW Gecko Motors Pvt Ltd carries up to 1,200 kg of payload and transports up to nine personnel, while achieving up to 61 hours of continuous operation in flooded terrain during its deployment in Punjab flood relief.
Rising Use of Amphibious Equipment in Coastal Infrastructure and Dredging
Coastal development projects increase the use of amphibious excavators and utility vehicles for dredging, shore restoration, and wetland construction. These machines work in shallow waters, swamps, and marsh areas where traditional equipment cannot operate. Contractors favor amphibious excavators for stable operation on soft terrain and efficient silt removal. Governments also expand programs for river deepening, flood-control improvements, and shoreline reinforcement. The growing emphasis on climate-resilient infrastructure boosts demand for machines that support both land and water construction. Ports, inland waterways, and aquaculture zones benefit from these versatile platforms. This trend strengthens industrial adoption and expands the commercial application base.
Key Trend & Opportunity
Integration of Advanced Propulsion and Hybrid Power Systems
Manufacturers introduce new propulsion systems that increase fuel efficiency, water maneuverability, and terrain stability. Hybrid-electric systems create strong interest because they reduce noise during military operations and support cleaner industrial use. Water-jet upgrades enhance speed in shallow zones, while improved track designs aid movement in deep mud. The push toward energy-efficient systems aligns with global sustainability policies. These innovations open opportunities for fleet modernization across defense, construction, and emergency sectors. Companies that offer modular propulsion packages gain an early advantage as customers seek customized performance for varied terrains. This trend creates a long runway for technological expansion.
- For instance, Honeywell’s advanced water‑jet design delivers 11,000 lbf of thrust at 25 knots and utilizes a 23-inch diameter impeller. The maximum thrust (bollard) is even higher at 15,000 lbf.
Rising Commercial and Tourism Use of Amphibious Transport
Commercial transport operators and tourism businesses adopt amphibious vehicles for lake tours, beach routes, and river-coast transfers. Growing coastal tourism encourages investment in multi-passenger amphibious buses and light utility craft. These vehicles offer safe transitions between road and water, reducing the need for separate fleets. Operators use them for sightseeing routes, island connectivity, and eco-tourism in protected water bodies. Governments also support regulated amphibious transport in urban waterfront areas. Manufacturers see strong opportunity in lighter, more affordable platforms with improved safety features. This expansion into non-defense markets strengthens long-term market diversification.
- For instance, Seahorse Amphibious Vehicles’ fully electric amphibious passenger vehicle is designed to carry 36 passengers + 2 crew, and its first unit is slated for urban river/water‑tour use in cities including London and Cape Town.
Key Challenge
High Cost and Complex Manufacturing Requirements
Amphibious vehicles require reinforced hulls, sealed drivetrains, corrosion-resistant materials, and dual-mode propulsion systems, which increase production costs. Defense-grade models add ballistic protection, advanced communication tools, and specialized suspension units, making procurement expensive for many countries. Civil agencies and rescue departments also face budget constraints that limit large-scale adoption. Manufacturers struggle with long development cycles due to strict safety and performance testing. These engineering complexities raise entry barriers for new players. The high upfront price and long procurement approvals slow adoption across developing regions, creating a major challenge for market expansion.
Operational Limitations in Extreme Marine and Weather Conditions
Amphibious vehicles work well in moderate coastal conditions but face performance issues in strong currents, deep offshore waters, and severe storms. Their propulsion systems and hull designs are optimized for shallow and mixed terrain, not high-tide or open-sea operations. Safety concerns arise when waves exceed manageable heights or when debris obstructs propulsion units during floods. Military users also struggle with maintenance in corrosive saltwater environments, which shortens component lifespan. These limitations restrict deployment in certain missions and reduce operational flexibility. Overcoming these constraints requires costly upgrades and advanced engineering, posing a challenge for wider adoption.
Regional Analysis
North America
North America holds the largest share of the Amphibious Vehicles Market at 38%, driven by strong defense spending and advanced marine warfare programs. The U.S. Marine Corps invests heavily in next-generation amphibious combat vehicles to support coastal and expeditionary missions. Disaster-response agencies in the U.S. and Canada also adopt amphibious platforms for flood rescue and emergency mobility. Commercial operators use amphibious buses and utility units for tourism in coastal cities. Continuous modernization, strong procurement budgets, and rising climate-related emergencies support steady growth across defense, civil safety, and commercial segments.
Europe
Europe accounts for 27% of the Amphibious Vehicles Market, supported by active defense modernization plans and strong engineering capabilities. NATO members upgrade their amphibious fleets to strengthen rapid-response and cross-border mobility. Countries such as Germany, France, and the U.K. adopt advanced amphibious carriers for integrated land-sea missions. The region also shows high adoption of amphibious excavators for flood-control, dredging, and coastal restoration projects. Expanding inland waterways and environmental protection programs create additional demand. Growing investments in hybrid propulsion and safety-enhanced hull designs further improve market penetration across both military and industrial sectors.
Asia Pacific
Asia Pacific holds 29% of the Amphibious Vehicles Market and grows rapidly due to rising territorial tensions and maritime security priorities. China, India, Japan, and South Korea expand procurement of amphibious combat vehicles to support littoral operations and island defense. Frequent flooding and typhoons also push governments to adopt amphibious rescue units for rapid disaster response. The region leads in the use of amphibious excavators for river deepening, wetland projects, and coastal development. Large coastlines, expanding naval forces, and fast-paced infrastructure programs strengthen adoption across military, civil, and industrial applications.
Latin America
Latin America represents 4% of the Amphibious Vehicles Market, driven mainly by disaster-response needs and selective military upgrades. Countries such as Brazil, Colombia, and Mexico use amphibious units for flood rescue, jungle mobility, and river-based patrol missions. Slow but rising investment in wetland infrastructure and dredging supports demand for amphibious excavators. Tourism operators in coastal regions also explore small amphibious transport platforms. Limited defense budgets restrict large-scale adoption, but growing climate-related emergencies and coastal development projects continue to create steady, modest demand across civilian and industrial sectors.
Middle East & Africa
The Middle East & Africa holds 2% of the Amphibious Vehicles Market, with growth driven by border security needs, humanitarian operations, and expanding coastal infrastructure. Countries facing frequent floods and desert-river crossings use amphibious rescue units to improve emergency mobility. Military forces in the Gulf region invest selectively in amphibious carriers for coastal patrol and joint marine operations. Africa shows rising adoption of amphibious excavators for dredging, irrigation, and river-maintenance projects. Despite budget constraints, increasing disaster events and infrastructure expansion support gradual market penetration across both defense and civil sectors.
Market Segmentations:
By Propulsion
- Track-Based Propulsion
- Water Jet Propulsion
- Screw Propeller
By Vehicle
- Armored Amphibious Vehicles
- Amphibious Excavators
- Light Amphibious Utility Vehicles
- Commercial Amphibious Transport
By Application
- Military Combat & Troop Transport
- Disaster Response & Humanitarian Aid
- Construction & Dredging
- Commercial & Recreational Transport
By Geography
- North America
- Europe
- Germany
- France
- U.K.
- Italy
- Spain
- Rest of Europe
- Asia Pacific
- China
- Japan
- India
- South Korea
- South-east Asia
- Rest of Asia Pacific
- Latin America
- Brazil
- Argentina
- Rest of Latin America
- Middle East & Africa
- GCC Countries
- South Africa
- Rest of the Middle East and Africa
Competitive Landscape
The competitive landscape of the Amphibious Vehicles Market includes a mix of global defense contractors, specialized construction equipment makers, and niche manufacturers focused on multi-terrain mobility. Companies introduce platforms with stronger hull structures, enhanced propulsion systems, and upgraded navigation features to meet rising demand from defense, disaster-response, and industrial users. Leading players such as BAE Systems plc, General Dynamics Corporation, and Rheinmetall AG strengthen portfolios through advanced amphibious combat vehicles designed for high mobility in littoral and riverine missions. Industrial-focused manufacturers, including Hitachi Construction Machinery Co., Ltd., EIK Engineering Sdn. Bhd., Wetland Equipment Company, and Wilco Manufacturing L.L.C., expand offerings for dredging, wetland construction, and environmental projects. Emerging players such as Hydratrek, Inc. and Marsh Buggies Incorporated target lightweight and utility applications for rescue teams and commercial operators. Partnerships, localized production, and technology integrations remain central to improving performance and widening global customer reach.
Shape Your Report to Specific Countries or Regions & Enjoy 30% Off!
Key Player Analysis
- Hydratrek, Inc.
- Rheinmetall AG
- BAE Systems plc
- Wilco Manufacturing L.L.C.
- Wetland Equipment Company
- Hanwha Aerospace
- EIK Engineering Sdn. Bhd.
- Hitachi Construction Machinery Co., Ltd.
- Marsh Buggies Incorporated
- General Dynamics Corporation
Recent Developments
- In September 2025, Rheinmetall Canada successfully tested one of its unmanned ground vehicles in Atlantic waters, moving from sea to land in a NATO exercise.
- In April 2025, BAE secured a contract valued at US$188.5 million to produce 30 ACV-30 mm vehicles for the U.S. Marine Corps.
Report Coverage
The research report offers an in-depth analysis based on Propulsion, Vehicle, Application and Geography. It details leading market players, providing an overview of their business, product offerings, investments, revenue streams, and key applications. Additionally, the report includes insights into the competitive environment, SWOT analysis, current market trends, as well as the primary drivers and constraints. Furthermore, it discusses various factors that have driven market expansion in recent years. The report also explores market dynamics, regulatory scenarios, and technological advancements that are shaping the industry. It assesses the impact of external factors and global economic changes on market growth. Lastly, it provides strategic recommendations for new entrants and established companies to navigate the complexities of the market.
Future Outlook
- Manufacturers will expand modular design platforms to support land‑to‑water transitions more efficiently, enabling faster role conversions for combat, rescue and commercial use.
- Developers will integrate hybrid propulsion systems and electric drives to reduce fuel consumption and support stealth or eco‑friendly operations in sensitive environments.
- Governments will increasingly procure amphibious vehicles for disaster relief, flood response and wetland operations in regions prone to climate change impacts and infrastructure stress.
- Commercial sectors such as tourism, leisure transport and urban waterfront mobility will adopt amphibious vehicles for novel experiences, expanding beyond purely military applications.
- Suppliers will invest in advanced materials, lighter hulls and adaptive suspension systems to improve mobility across mud, marsh terrain and shallow waters, lowering maintenance burdens.
- Regional growth will accelerate in Asia‑Pacific and Latin America as infrastructure projects in swamps, riverside cities, reclaimed land and waterfront districts increase demand for amphibious utility vehicles.
- Manufacturers will offer subscription‑based services, telematics and connected solutions in amphibious vehicles to support fleet operations, preventive maintenance and mission readiness.
- Regulatory bodies will push manufacturers to meet stricter emissions and safety standards, driving innovation toward cleaner amphibious platforms and improved corrosion resistance.
- Commercial use cases will demand more affordable, simplified amphibious designs for smaller operators, prompting OEMs to scale production and reduce unit costs.
- Collaboration among defense contractors, shipbuilders and vehicle OEMs will increase as countries localise production, share technology and combine marine and land mobility expertise.


