| REPORT ATTRIBUTE |
DETAILS |
| Historical Period |
2020-2023 |
| Base Year |
2024 |
| Forecast Period |
2025-2032 |
| Amusement Machine Market Size 2024 |
USD 15,166.62 million |
| Amusement Machine Market, CAGR |
10.58% |
| Amusement Machine Market Size 2032 |
USD 35,872.42 million |
Market Overview:
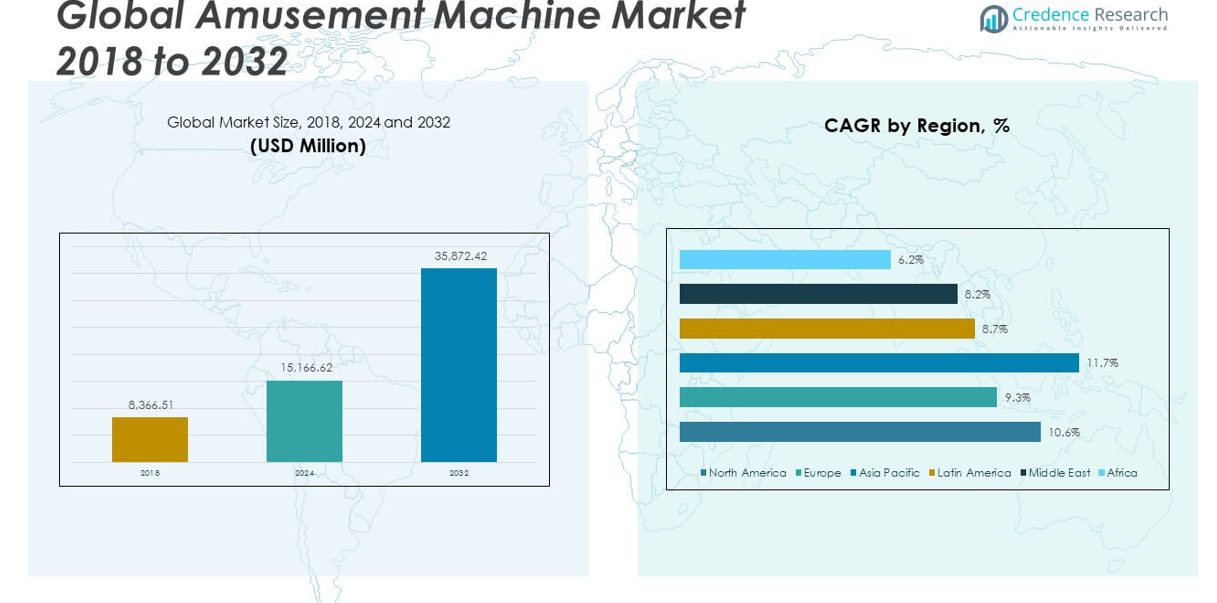
The Global Amusement Machine Market size was valued at USD 8,366.51 million in 2018 to USD 15,166.62 million in 2024 and is anticipated to reach USD 35,872.42 million by 2032, at a CAGR of 10.58% during the forecast period.
Multiple drivers are fueling the rise of amusement machines globally. Key among them is technological innovation, with the integration of AR/VR, AI, and interactive digital features elevating traditional mechanical games to immersive entertainment platforms. VR/AR simulation machines and smart analytics are reshaping user engagement, offering personalized and captivating experiences. Another primary catalyst is the growing demand for location-based entertainment praised for its social and out-of-home engagement that home consoles and mobile games cannot easily replicate. Family entertainment centers (FECs), theme parks, and arcade lounges are expanding globally, increasingly equipped with redemption games and immersive setups to drive foot traffic and repeat visits. Complementing these trends is the steady increase in disposable incomes, especially in emerging markets across Asia-Pacific, where a rising middle class is directing a growing share of its spending toward leisure and experiential entertainment. Lastly, the nostalgia factor continues to boost interest in retro arcades and pinball, engaging older demographics and creating a cross-generational appeal.
Geographically, North America currently dominates the market and is likely to sustain that leadership in the near term. The U.S. alone is seeing expansion through theme parks, FECs, and niche arcade venues incorporating high-end VR systems and league gaming capabilities. Europe is historic territory for amusement machines, with revivals in retro gaming halls, social arcade bars, and simulation attractions strong trends in countries like the UK, Germany, and France. The Asia-Pacific region, however, is emerging as the fastest-growing market. Precedence Research forecasts strong CAGR through 2034 for APAC. The region’s sizeable youth demographic, improving discretionary spending, and a growing appetite for technologically advanced entertainment seen in China’s arcade boom and Japan/Korea’s capsule and claw machine culture create fertile ground for future expansion. Latin America and Middle East & Africa are smaller markets in absolute terms but are gaining attention, especially as global firms open new entertainment venues and major theme park complexes.
Market Insights:
- The Global Amusement Machine Market was valued at USD 15,166.62 million in 2024 and is projected to reach USD 35,872.42 million by 2032, expanding at a CAGR of 10.58%.
- Technological innovation, including AR/VR integration, AI, and digital payment systems, is transforming traditional machines into immersive, interactive entertainment platforms.
- Location-based entertainment venues such as arcades, FECs, and theme parks are expanding rapidly, driving strong demand for high-engagement amusement machines.
- Rising disposable incomes and middle-class growth across Asia-Pacific and Latin America are creating favorable conditions for machine installations in new retail and entertainment hubs.
- Nostalgia for retro games is attracting older demographics and fueling cross-generational demand, especially in boutique arcades, bars, and experiential entertainment spaces.
- High upfront investment, maintenance costs, and fast-paced technology cycles remain major barriers, particularly for small operators and new entrants.
- North America leads the global market, while Asia-Pacific is the fastest-growing region, driven by a young population, strong arcade culture, and rising leisure spending.
Access crucial information at unmatched prices!
Request your sample report today & start making informed decisions powered by Credence Research Inc.!
Download Sample
Market Drivers:
Rising Popularity of Location-Based Entertainment Experiences
Consumers are increasingly seeking immersive, social, and experiential forms of entertainment, which is driving the demand for amusement machines in arcades, family entertainment centers, and theme parks. These venues offer shared experiences that mobile apps and home consoles cannot replicate, attracting both families and adult groups. Urbanization and increased foot traffic in malls and mixed-use entertainment spaces have further contributed to this trend. Developers continue to invest in new setups featuring skill-based redemption games, claw machines, and VR simulators that promote repeat visits. The Global Amusement Machine Market benefits directly from this surge in consumer interest for out-of-home interactive gaming. Operators see higher revenue per user from physically engaging experiences offered in dedicated entertainment zones.
- For instance, Sandbox VRhas expanded its full-body motion capture gaming experiences to new venues, such as Park Meadows Mall in Colorado, enabling multi-user, physically interactive VR gameplay that is not feasible on home consoles or mobile devices
Technological Innovation Is Reshaping the Amusement Machine Landscape
Advancements in technologies such as augmented reality (AR), virtual reality (VR), and artificial intelligence (AI) are transforming amusement machines from static units to dynamic, interactive systems. Touchless controls, real-time feedback, motion sensors, and personalization features enhance the player experience and boost machine utilization. Developers are incorporating smart payment systems, enabling cashless transactions through mobile apps or QR codes, which improves accessibility. It is also facilitating seamless integration with loyalty programs and user analytics. The Global Amusement Machine Market is capitalizing on these innovations to increase operator profitability and user engagement. These digital upgrades are no longer confined to premium models but are becoming standard across new product lines.
- For instance, on the operational side, Embed’s cashless arcade payment system certified by Apple, Google, and Amazon Web Services enables tap-and-play game cards, RFID wristbands, and mobile wallet integration, allowing guests to reload credits instantly from their smartphones2
Rising Disposable Income and Middle-Class Expansion in Emerging Markets
The steady rise in disposable incomes, especially across Asia-Pacific and Latin America, is strengthening demand for leisure and entertainment services. A growing middle-class population is spending more on social and recreational activities, including visits to arcades, amusement parks, and entertainment lounges. It is creating a favorable environment for operators to install high-margin machines that appeal to aspirational consumers. Countries like China, India, Indonesia, and Brazil are witnessing new arcade openings in malls and retail complexes. The Global Amusement Machine Market is gaining traction in these regions due to changing consumer habits and expanding retail entertainment formats. Machine manufacturers are also localizing offerings to suit cultural preferences and spending patterns.
Nostalgia and Cross-Generational Appeal Are Fueling Renewed Interest
The resurgence of interest in retro gaming and nostalgia-driven experiences is unlocking new consumer segments for amusement machine operators. Adults who grew up with classic arcade games are now introducing these experiences to younger generations, creating multi-generational appeal. Barcades, themed entertainment spaces, and interactive museums are embracing this trend to attract a broader demographic. It is strengthening the market presence of machines like pinball, skee-ball, and joystick-based games in non-traditional settings. The Global Amusement Machine Market is seeing increased demand from cafes, breweries, and boutique arcades that blend retro charm with modern features. This emotional connection to gaming heritage supports repeat engagement and enhances customer loyalty.
Market Trends:
Integration of Esports and Competitive Gaming Formats in Amusement Venues
The rise of esports is influencing the design and deployment of amusement machines tailored for competitive, multi-player gaming. Venues are investing in machines that support tournaments, score tracking, and real-time performance analytics to attract gaming communities. Competitive formats are replacing passive play experiences with skill-based challenges that offer tangible rewards. Arcade operators are setting up leaderboards and hosting local contests to increase dwell time and visitor frequency. The Global Amusement Machine Market is aligning with this shift by introducing gaming units that merge arcade interaction with esports-style competitiveness. It creates new revenue streams and appeals to younger, digitally-native consumers. Machine manufacturers are also developing customizable systems that support frequent content updates for evolving gameplay.
- For example, Helix eSports, a leading U.S. esports center, has implemented a technically advanced tournament management and performance tracking platform to support competitive gaming at scale. Their solution, developed by Kanda Software, involves a custom Windows service installed on each gaming PC to collect detailed player data—including username, score, location, and rewards—during tournaments.
Growth of Themed and Branded Machine Installations Across Entertainment Hubs
Brands are collaborating with amusement machine manufacturers to create themed gaming experiences that strengthen their visibility and emotional appeal. Machines based on popular film franchises, video game characters, or cultural icons are driving foot traffic in malls, amusement parks, and retail centers. These branded experiences blend interactive play with recognizable narratives, making them more memorable and shareable. It helps venue operators differentiate their offerings in competitive locations. The Global Amusement Machine Market is leveraging intellectual property (IP) licensing to increase user engagement and brand loyalty. Co-branded partnerships with media companies and gaming publishers have led to machines that reflect both high production quality and fan-driven demand. Consumers perceive such machines as more premium and immersive than generic models.
- For example, Andamiro Co., Ltd. has established itself as an industry leader by investing heavily in intellectual property (IP) licensing, resulting in the largest portfolio of licensed amusement machines in the sector. Their current licenses include globally recognized brands such as Nickelodeon’s SpongeBob SquarePants and Paw Patrol, NBCUniversal’s Despicable Me and Jurassic World, as well as Marvel Avengers, following a 2019 agreement with The Walt Disney Company.
Expansion of Compact and Mobile-Friendly Amusement Machine Designs
Space limitations in urban entertainment zones are encouraging the adoption of compact, mobile-friendly amusement machines. Developers are responding with modular systems that require minimal installation space but still deliver strong user interaction. These machines are ideal for cafes, co-working spaces, and transit hubs looking to offer recreational options without committing to large-format installations. It is helping expand the presence of amusement gaming beyond traditional arcades and theme parks. The Global Amusement Machine Market is witnessing strong uptake in micro-locations, supported by flexible pricing and operational models. Battery-powered or easily portable machines are also gaining favor in temporary events and pop-up entertainment zones. This trend supports low-cost deployment and quicker returns for operators.
Rising Use of Data Analytics and Machine Performance Tracking Software
Operators are increasingly turning to data analytics tools to monitor machine usage, game popularity, and maintenance needs in real time. This shift toward performance tracking is helping identify underperforming units and optimize machine placements within venues. Software platforms now offer dashboards that visualize key operational metrics and support predictive servicing schedules. It contributes to lower downtime and better resource allocation. The Global Amusement Machine Market is seeing greater integration of analytics capabilities into both hardware and cloud-based systems. It enables decision-makers to base strategy on measurable insights rather than guesswork. Data-driven optimization is becoming essential for operators managing multiple venues or franchise locati
Market Challenges Analysis:
High Initial Investment and Ongoing Maintenance Requirements Limit Adoption
The capital-intensive nature of amusement machines continues to challenge new entrants and small-scale operators. High costs for hardware procurement, software licensing, and installation often require significant upfront investment, which many independent venues find difficult to justify. It becomes more complicated when considering the rapid pace of technological advancement, which can render machines obsolete within a few years. Maintenance expenses, including parts replacement and software updates, add further financial strain over time. The Global Amusement Machine Market must address these financial hurdles to sustain broader adoption. Smaller venues tend to delay upgrades or rely on outdated models, which impacts user engagement and revenue potential. Manufacturers offering leasing models or modular upgrades could help reduce these barriers.
Regulatory Uncertainty and Variable Compliance Standards Across Regions
Differences in local regulations, licensing laws, and safety standards create complications for operators expanding across regions. Some countries classify certain amusement machines under gambling legislation, requiring strict oversight, while others apply broader entertainment or retail laws. It complicates market entry strategies and increases legal and operational risks. The Global Amusement Machine Market faces these constraints in both developed and emerging regions, affecting product design, content approval, and business models. Compliance challenges also extend to machine features, such as prize mechanisms and payment systems, which must align with specific national guidelines. Without consistent regulatory frameworks, companies struggle to scale efficiently and must often customize offerings per jurisdiction, increasing costs and complexity.
Market Opportunities:
Expansion into Non-Traditional Venues Creates New Revenue Avenues
The growing demand for interactive entertainment in unconventional spaces presents a strong opportunity for market growth. Coffee shops, airports, co-working hubs, and retail stores are incorporating compact amusement machines to enhance customer engagement. These locations allow operators to reach audiences beyond arcades and theme parks. The Global Amusement Machine Market can benefit by developing machines tailored for limited spaces and short user sessions. It opens new deployment models that require lower capital and offer higher footfall potential. Businesses using entertainment to increase customer retention will continue to support adoption across diverse industries.
Demand for Customization and Themed Content Unlocks Niche Segments
Consumers increasingly seek personalized and branded experiences, driving demand for machines that reflect specific themes, stories, or cultural identities. Operators are investing in customized cabinets and game mechanics to align with local events, festivals, or pop culture icons. The Global Amusement Machine Market can leverage these trends by offering scalable content libraries and flexible machine interfaces. It creates value through repeat use and emotional connection. Themed experiences help differentiate venues and encourage higher user engagement. Companies that invest in adaptable platforms will position themselves strongly in this evolving landscape.
Market Segmentation Analysis:
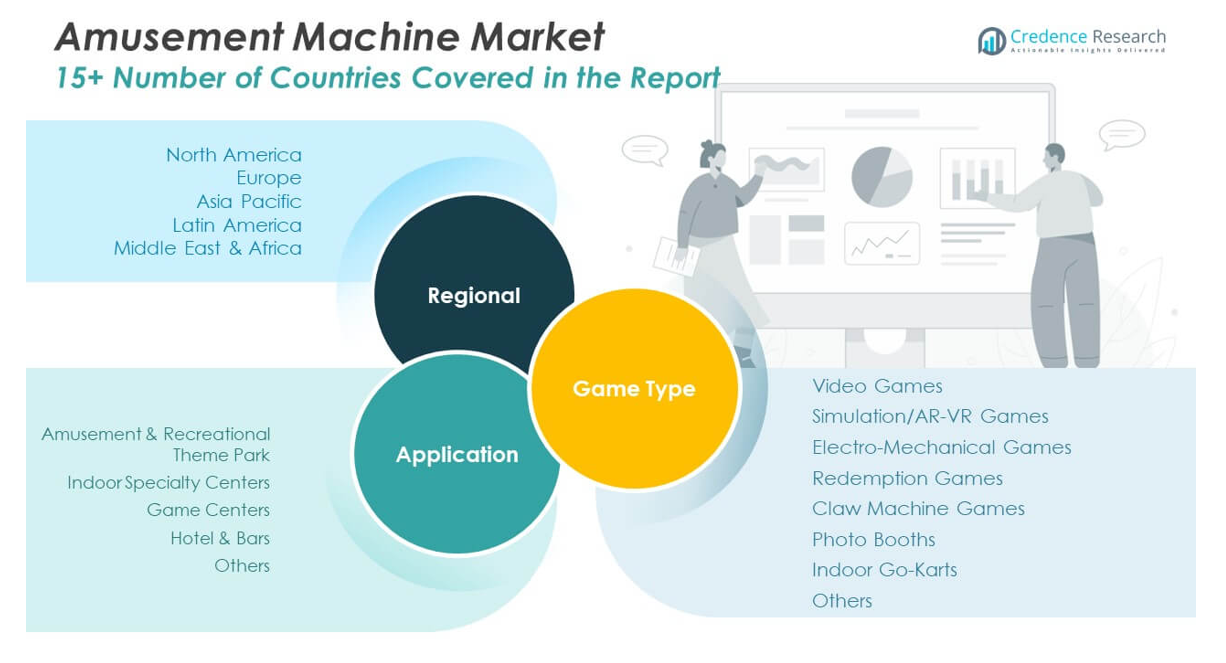
The Global Amusement Machine Market is segmented by game type and application, reflecting the industry’s diverse offerings and broad deployment range.
By game type, video games hold a significant share due to their wide appeal and adaptability across venues. Simulation/AR-VR games are gaining traction for delivering immersive, next-generation experiences, particularly in premium arcades and entertainment centers. Electro-mechanical games and redemption games continue to attract users seeking tactile and reward-based interactions. Claw machine games remain popular for their simplicity and prize appeal, while photo booths offer social engagement and nostalgia-driven usage. Indoor go-karts serve as high-value attractions in larger venues, and the others category includes hybrid machines and emerging formats designed to meet evolving consumer preferences.
- For example, Crazy Toy Jr. by Andamiro (2025) is a compact prize claw machine designed for high visibility and broad appeal in family entertainment venues. Released in early 2025, it features simple, intuitive controls, vivid LED lighting, and a sleek cabinet that enhances the visibility of prizes such as plush toys, candies, and novelty items.
By application, the Global Amusement Machine Market sees strong demand from amusement and recreational theme parks, where high-capacity machines and branded experiences dominate. Indoor specialty centers cater to families and casual users, while game centers focus on repeat engagement and competitive play. Hotels and bars use compact machines to enhance guest experiences and increase foot traffic. The others segment includes deployment in transit hubs, co-working spaces, and cafes, reflecting the market’s expansion into non-traditional entertainment venues.
- For example, Mai Mai DX (Sega, 2025) is an upcoming music rhythm arcade game designed for high replay value through its immersive gameplay and interactive features. Developed by Sega, it features a distinctive circular touchscreen interface, vibrant and dynamic visuals, and supports multiplayer gameplay.
Segmentation:
By Game Type
- Video Games
- Simulation/AR-VR Games
- Electro-Mechanical Games
- Redemption Games
- Claw Machine Games
- Photo Booths
- Indoor Go-Karts
- Others
By Application
- Amusement & Recreational Theme Park
- Indoor Specialty Centers
- Game Centers
- Hotel & Bars
- Others
By Region
- North America
- Europe
- Germany
- France
- U.K.
- Italy
- Spain
- Rest of Europe
- Asia Pacific
- China
- Japan
- India
- South Korea
- South-east Asia
- Rest of Asia Pacific
- Latin America
- Brazil
- Argentina
- Rest of Latin America
- Middle East & Africa
- GCC Countries
- South Africa
- Rest of the Middle East and Africa
Regional Analysis:
The North America Amusement Machine Market size was valued at USD 3,549.33 million in 2018 to USD 6,365.36 million in 2024 and is anticipated to reach USD 15,098.52 million by 2032, at a CAGR of 10.6% during the forecast period. North America accounts for the largest share of the Global Amusement Machine Market, holding 34% of the total revenue in 2024. High consumer spending on leisure activities, combined with the widespread presence of family entertainment centers and arcades, continues to support growth across the U.S. and Canada. It benefits from the integration of immersive technologies, digital payment systems, and loyalty programs that enhance user engagement. The U.S. remains the regional leader, driven by investments in competitive gaming zones and theme park installations. Venue operators actively adopt branded and interactive machines to attract broader demographics. Manufacturers prioritize this market with frequent product updates and strategic partnerships with entertainment chains.
Europe
The Europe Amusement Machine Market size was valued at USD 1,643.60 million in 2018 to USD 2,824.37 million in 2024 and is anticipated to reach USD 6,106.30 million by 2032, at a CAGR of 9.3% during the forecast period. Europe represents 15% of the Global Amusement Machine Market in 2024, supported by strong demand for retro and theme-based gaming experiences. Countries such as the UK, Germany, France, and Italy lead in arcade and barcade adoption. It is witnessing a revival of interest in mechanical and hybrid machines, particularly in urban social venues. Branded cabinets featuring European sports and cultural icons are gaining traction. The market also benefits from regulatory stability, allowing operators to plan longer investment cycles. Manufacturers adapt machines to regional preferences, including multi-language interfaces and content customization.
Asia Pacific
The Asia Pacific Amusement Machine Market size was valued at USD 2,497.04 million in 2018 to USD 4,771.28 million in 2024 and is anticipated to reach USD 12,276.65 million by 2032, at a CAGR of 11.7% during the forecast period. Asia Pacific holds 25% of the Global Amusement Machine Market in 2024 and is the fastest-growing regional market. Rapid urbanization, a young population, and increasing disposable incomes are driving strong demand for entertainment venues. Japan, China, and South Korea lead the region with robust arcade cultures and continuous innovation in machine design. It benefits from deep integration of anime, gaming franchises, and advanced user interfaces. The emergence of shopping malls and theme parks across Southeast Asia further supports machine deployment. Global manufacturers localize offerings to meet regional cultural preferences and gameplay styles.
Latin America
The Latin America Amusement Machine Market size was valued at USD 354.24 million in 2018 to USD 633.25 million in 2024 and is anticipated to reach USD 1,305.50 million by 2032, at a CAGR of 8.7% during the forecast period. Latin America captures 3% of the Global Amusement Machine Market in 2024, with Brazil and Mexico leading in arcade adoption. Urban entertainment complexes, mall expansions, and youth-focused venues are increasing machine penetration. It faces challenges from economic volatility but continues to gain traction through affordable machines and flexible leasing models. Redemption games and family-oriented units are especially popular. The region favors machines that combine physical activity and interactive design. Local partnerships with distributors enhance reach and customer support capabilities.
Middle East
The Middle East Amusement Machine Market size was valued at USD 228.78 million in 2018 to USD 378.23 million in 2024 and is anticipated to reach USD 751.11 million by 2032, at a CAGR of 8.2% during the forecast period. The Middle East accounts for 2% of the Global Amusement Machine Market in 2024, driven by growth in retail and tourism infrastructure. Countries like the UAE and Saudi Arabia are investing in large entertainment zones within malls and leisure destinations. It attracts both local residents and tourists seeking premium experiences. High-end arcade machines and VR-based simulators are seeing rising adoption in family entertainment centers. Government-backed diversification efforts in the Gulf region support further expansion. Operators focus on themed and culturally adapted machines for localized appeal.
Africa
The Africa Amusement Machine Market size was valued at USD 93.53 million in 2018 to USD 194.13 million in 2024 and is anticipated to reach USD 334.33 million by 2032, at a CAGR of 6.2% during the forecast period. Africa holds 1% of the Global Amusement Machine Market in 2024, with development concentrated in South Africa, Kenya, and Egypt. Growth is emerging from shopping malls, urban leisure hubs, and hospitality centers offering arcade-style attractions. It remains a nascent market but shows promise due to a growing youth demographic and expanding middle class. Cost-effective machines and refurbished units are often preferred. Infrastructure limitations and regulatory complexities pose short-term challenges. International manufacturers are gradually entering the region through local partnerships and event-based installations.
Shape Your Report to Specific Countries or Regions & Enjoy 30% Off!
Key Player Analysis:
- Adrenaline Amusements
- Bandai Namco Entertainment America Inc.
- Bay Tek Entertainment, Inc.
- Bob’s Space Racer
- Capcom Co., Ltd.
- Coastal Amusements Inc.
- Elaut Group
- Innovative Concepts in Entertainment, Inc.
- Konami Group
- LAI Games
Competitive Analysis:
The Global Amusement Machine Market features a competitive landscape dominated by both multinational corporations and regional manufacturers. Key players include Sega Corporation, Bandai Namco Holdings, Konami Holdings Corporation, Adrenaline Amusements, UNIS Technology, and LAI Games. These companies focus on product innovation, themed collaborations, and integration of emerging technologies such as AR and VR to capture market share. It continues to see new entrants targeting niche segments like skill-based redemption games and mobile-friendly arcade units. Partnerships with entertainment venues, licensing of popular intellectual properties, and flexible leasing models support expansion strategies. Competitive intensity remains high, with firms investing in localized content and multi-player formats to enhance user engagement. The market favors companies that offer scalable, customizable machines supported by strong after-sales service. Growth opportunities exist for players that adapt to evolving consumer preferences and regional regulatory requirements while delivering high-quality, immersive experiences.
Recent Developments:
- In July 2025, Stern Pinballlaunched a new product to celebrate the 50th anniversary of Universal Pictures and Steven Spielberg’s Jaws. The company unveiled the Jaws 50th Anniversary Premium Edition pinball machine at San Diego Comic-Con 2025.
- In April 2025, GENDA, a Tokyo-based entertainment company, announced the acquisition of Player One Amusement Groupfrom OpenGate Capital. Player One, headquartered in Toronto, provides amusement gaming equipment and outsourced operations and maintenance support across Canada and the US.
- Capcom Co., Ltd.announced on July 1, 2024, that it had acquired two-thirds of the shares of Minimum Studios Co., Ltd., a 3DCG animation studio based in Taiwan. This acquisition aims to bolster Capcom’s development and technological capabilities for game production, supporting its long-term goal of reaching 100 million units in annual sales.
Market Concentration & Characteristics:
The Global Amusement Machine Market is moderately concentrated, with a mix of global leaders and regional specialists competing across various segments. It reflects a dynamic structure where innovation, licensing, and customization define competitive advantage. Major players dominate premium and branded machine categories, while smaller firms cater to budget-conscious buyers and niche markets. The market favors companies with strong distribution networks, localized content capabilities, and technical support infrastructure. It exhibits high product differentiation, with machines varying by format, theme, interactivity, and venue type. Demand shifts quickly based on consumer preferences and entertainment trends, driving frequent product updates and short innovation cycles.
Report Coverage:
The research report offers an in-depth analysis based on game type and application. It details leading market players, providing an overview of their business, product offerings, investments, revenue streams, and key applications. Additionally, the report includes insights into the competitive environment, SWOT analysis, current market trends, as well as the primary drivers and constraints. Furthermore, it discusses various factors that have driven market expansion in recent years. The report also explores market dynamics, regulatory scenarios, and technological advancements that are shaping the industry. It assesses the impact of external factors and global economic changes on market growth. Lastly, it provides strategic recommendations for new entrants and established companies to navigate the complexities of the market.
Future Outlook:
- Continued integration of AR, VR, and AI technologies will redefine user experiences and drive machine innovation.
- Compact and modular machine formats will support deployment in cafés, co-working spaces, and transit hubs.
- Esports and skill-based gaming features will become core components of future amusement machine designs.
- Themed collaborations with film studios and gaming franchises will increase machine appeal and brand value.
- Asia Pacific will lead market expansion, driven by urban development and rising disposable income.
- Demand for personalized gaming content and multi-language interfaces will shape product development.
- Cashless payment systems and data analytics integration will enhance operational efficiency for venue operators.
- Refurbished and low-cost units will gain popularity in Africa and Latin America for first-time installations.
- Regulatory harmonization across regions will enable smoother international market entry for manufacturers.
- Sustainability initiatives will influence machine design, focusing on energy efficiency and recyclable materials.



