
Market Overview
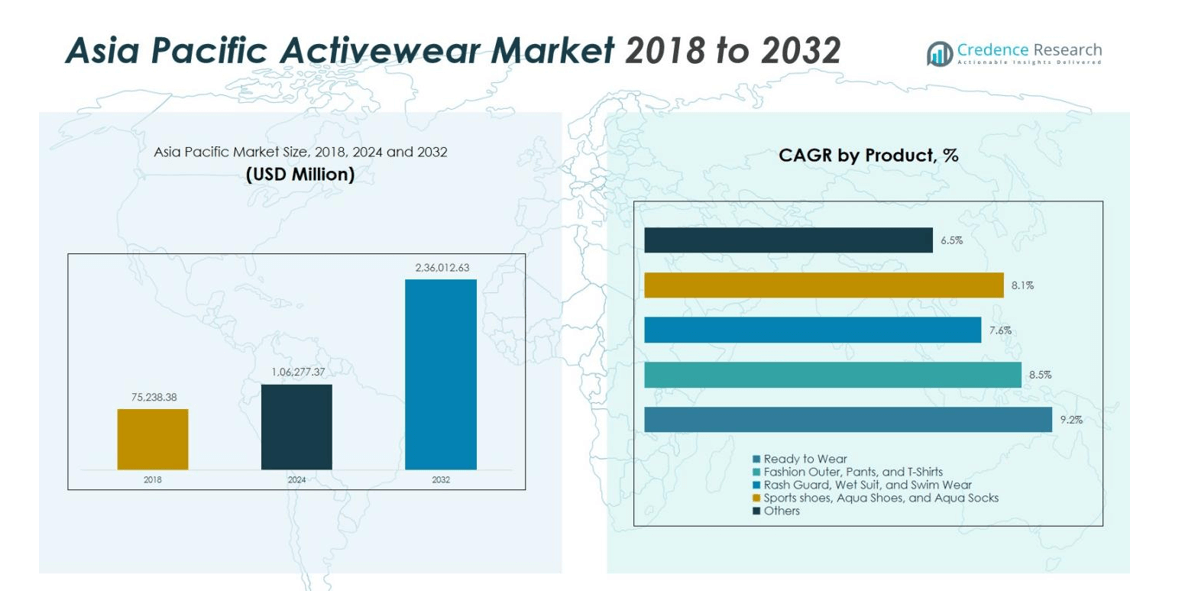
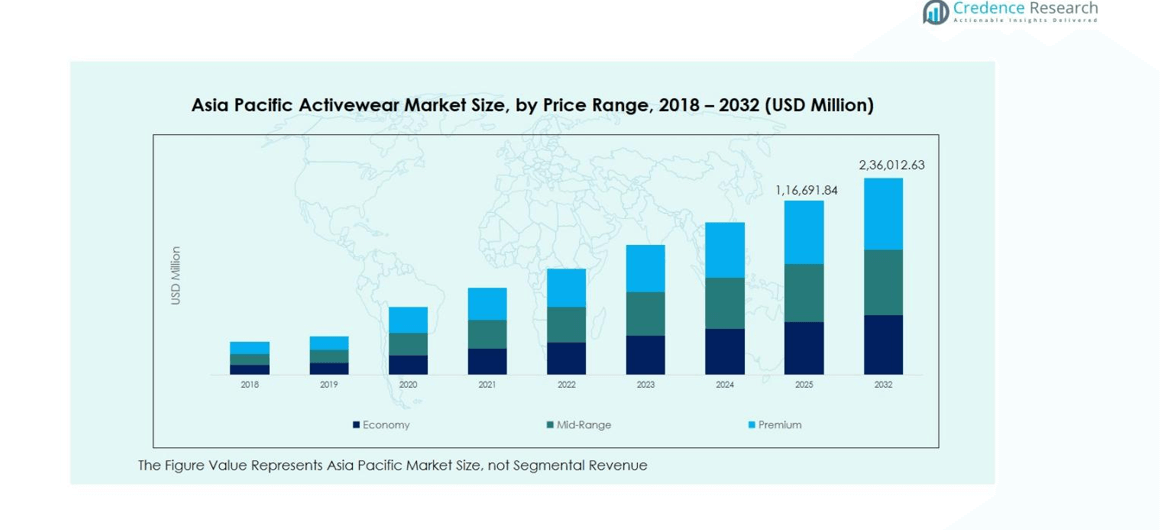
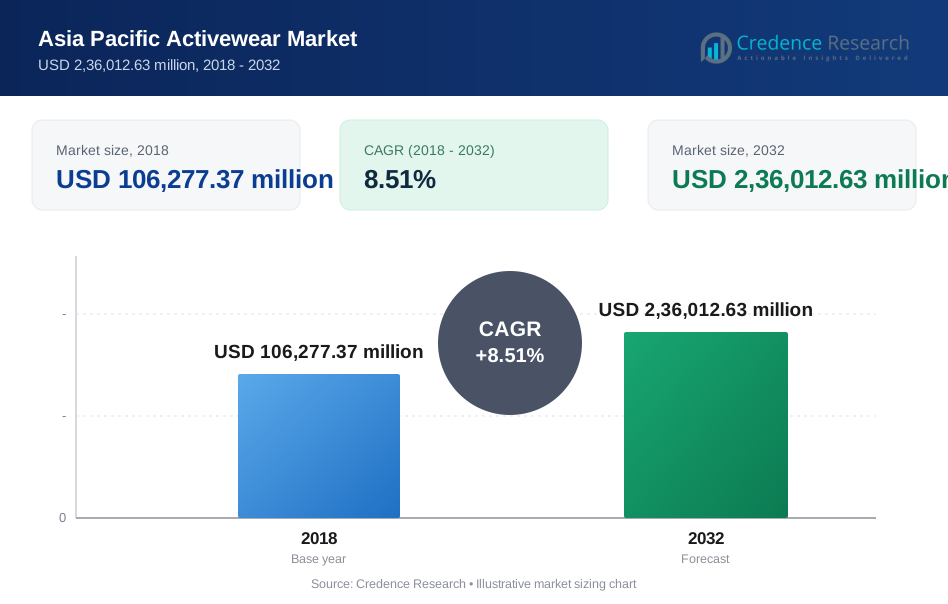
The Asia Pacific Activewear Market was valued at USD 75,238.38 million in 2018, increased to USD 1,06,277.37 million in 2024, and is anticipated to reach USD 2,36,012.63 million by 2032, growing at a CAGR of 8.51% during the forecast period.
| REPORT ATTRIBUTE | DETAILS |
|---|---|
| Historical Period | 2020-2023 |
| Base Year | 2024 |
| Forecast Period | 2025-2032 |
| Asia Pacific Activewear Market Size 2024 | USD 1,06,277.37 million |
| Asia Pacific Activewear Market, CAGR | 8.51% |
| Asia Pacific Activewear Market Size 2032 | USD 2,36,012.63 million |
The Asia Pacific Activewear Market features key players such as Adidas AG, Nike, Inc., Puma SE and Lululemon Athletica Inc. driving growth through strong brand equity and product innovation. The region’s leading market is China, capturing over 25 % of the Asia Pacific market, supported by rapid urbanization, rising disposable incomes and expanding e‑commerce channels. Japan follows with more than 15 % share, powered by premium consumer preferences and fitness culture. These brands invest in localized marketing, digital platforms and diverse product portfolios to strengthen their position and address the evolving activewear demands across the region.
Market Insights
- The Asia Pacific Activewear Market recorded a size of USD 1,06,277.37 million in 2024 and is projected to reach USD 2,36,012.63 million by 2032, reflecting a CAGR of 8.51%.
- Increasing health consciousness and fitness participation across urban populations drive demand for activewear, with the Ready to Wear product segment capturing the largest share owing to its dual appeal for performance and daily wear.
- The blend of ergonomic design and fashion in activewear has shifted consumer preference toward athleisure, with synthetic fabrics such as polyester dominating the fabric segment and synthetic material types holding a larger share than natural alternatives.
- Established brands and new entrants alike intensify brand‑building through digital channels and influencer partnerships, though price sensitivity and counterfeit product prevalence restrain margin growth and brand integrity in emerging markets.
- Regionally, China leads the Asia–Pacific region with a market share of over 25 %, followed by Japan with more than 15 %, while Southeast Asia accounts for around 6 %, demonstrating significant growth potential for brands expanding beyond mature markets.
Market Segmentation Analysis:
By Product
The Asia Pacific Activewear Market is driven by diverse product segments, with "Ready to Wear" emerging as the dominant sub-segment, commanding a significant market share. This category is fueled by increasing consumer demand for convenient and stylish activewear suitable for both fitness and daily use. "Fashion Outer, Pants, and T-Shirts" also holds a notable share, reflecting the growing trend of athleisure wear across the region. Sports Shoes, Aqua Shoes, and Aqua Socks are gaining traction, particularly in countries with a strong focus on sports and water activities. Overall, the Ready to Wear segment holds the largest market share, benefiting from its widespread appeal and growing integration into everyday fashion.
- For instance, Lululemon and Adidas have responded to this trend by integrating performance fabrics with fashion-forward designs, launching collections that blend comfort and style suited for both workout and casual wear.
By Fabric
In the Asia Pacific Activewear Market, Polyester is the leading fabric, holding a dominant share of the market due to its durability, moisture-wicking properties, and cost-effectiveness. It is highly favored in both sports and casual wear. Nylon follows closely, prized for its lightweight and resilient qualities, often used in activewear that requires flexibility. Spandex has also emerged as a key fabric for its stretchability, allowing for enhanced comfort and movement in activewear, contributing to its growing share in the market. The market is primarily driven by the increasing demand for functional, high-performance fabrics that combine comfort and versatility.
- For instance, DuPont’s Asia Pacific facilities have increasingly supplied elastic polyester fibers for sportswear, emphasizing moisture management and fabric durability, vital for high-performance activewear.
By Material
The Asia Pacific Activewear Market’s material segment is divided into Natural and Synthetic categories, with Synthetic materials holding a larger share, primarily driven by their durability, stretchability, and moisture-wicking capabilities. Polyester and Spandex are dominant materials within this sub-segment, offering exceptional performance and comfort for activewear. Natural materials like cotton are preferred for their softness and breathability but have a smaller share due to their lower performance in moisture management compared to synthetic alternatives. The demand for synthetic materials is fueled by the growing interest in high-performance activewear that caters to both athletic and lifestyle needs.
Key Growth Drivers
Increasing Health Awareness and Fitness Trends
The rising health consciousness among consumers in the Asia Pacific region is a major driver for the activewear market. As more people adopt active lifestyles and prioritize fitness, the demand for functional and comfortable activewear has surged. This shift is evident in the growing participation in sports, fitness activities, and outdoor adventures. Activewear is no longer limited to sports settings, with athleisure becoming a daily wear trend. This trend is particularly strong in urban areas, where the younger population increasingly seeks clothing that blends performance with style.
- For instance, Nike has introduced Aerogami, a novel apparel technology with moisture-reactive vents that autonomously open and close upon sensing sweat, enhancing breathability during exercise.
Rising Disposable Income and Urbanization
With the increasing disposable income and rapid urbanization across Asia Pacific, consumers are spending more on premium activewear. As cities continue to grow, more people are engaging in fitness activities, further fueling demand for high-quality, durable activewear. The region’s expanding middle class is driving the demand for branded and high-performance products, especially in countries like China, India, and Japan. Urbanization is also linked to changes in lifestyle, where fitness becomes a priority, creating a broader market for diverse activewear categories catering to different consumer needs.
- For instance, Decathlon’s large-format experiential stores in India combine retail with recreation, helping build fitness engagement among urban populations and expanding access to affordable, diverse activewear ranges.
E-commerce Growth and Digital Transformation
The growth of e-commerce and digital platforms is significantly driving the Asia Pacific activewear market. Consumers are increasingly shopping for activewear online due to the convenience, variety, and competitive pricing offered by online stores. Social media platforms also play a crucial role in driving trends and influencing purchasing decisions, especially among younger demographics. With online retailers offering a wide range of products, easy returns, and home delivery options, the market is seeing a shift from traditional retail to more digitally oriented shopping experiences, expanding market reach.
Key Trends & Opportunities
Athleisure as a Lifestyle
The athleisure trend is one of the most prominent growth drivers in the activewear market. As comfort, style, and performance blend, activewear is no longer confined to gyms or fitness centers but has seamlessly integrated into everyday fashion. Consumers are increasingly choosing activewear for both its functionality and its ability to complement casual, urban lifestyles. This trend is providing opportunities for brands to innovate by creating stylish yet performance-oriented products that cater to the demand for versatile clothing, especially in metropolitan areas across Asia Pacific.
- For instance, Lululemon’s Align High‑Rise Pant is built from its Nulu™ fabric, described as “weightlessly soft” and designed without a front seam to enhance everyday wear beyond workouts.
Sustainability in Activewear
Sustainability is becoming a significant focus for both consumers and brands in the Asia Pacific activewear market. With the rising environmental awareness among consumers, there is growing demand for eco-friendly products made from sustainable materials such as recycled fabrics and organic cotton. Brands are increasingly investing in sustainable production processes, including reducing carbon footprints and using water-saving technologies. This shift toward sustainability not only meets consumer demand but also provides companies with a competitive edge, as more environmentally conscious consumers prefer brands with strong sustainability credentials.
- For instance, Japan's ASICS launched the GEL-LYTE III CM 1.95 sneaker in 2023, featuring the lowest CO2 emissions of just 1.95 kg per pair, highlighting efforts to reduce carbon footprints in production.
Key Challenges
Intense Competition and Price Sensitivity
The Asia Pacific activewear market faces intense competition, especially with the entry of numerous international and local brands offering similar products. This has led to significant price sensitivity among consumers, especially in emerging markets. Brands are pressured to provide high-quality products at competitive prices, which can squeeze profit margins. Additionally, new entrants often offer lower-priced alternatives to gain market share, making it difficult for established players to maintain a leading position without continuous innovation and strategic pricing.
Counterfeit Products and Brand Authenticity
Another challenge for the activewear market in Asia Pacific is the widespread availability of counterfeit products. As the demand for branded activewear grows, counterfeit goods have flooded the market, undermining brand reputation and causing significant revenue losses. Consumers often find it challenging to differentiate between authentic and fake products, leading to concerns over product quality. This issue is particularly prevalent in markets where enforcement of intellectual property rights is weaker. Brands need to invest in anti-counterfeiting technologies and strategies to maintain consumer trust and brand integrity.
Regional Analysis
China
China leads the Asia Pacific activewear market with a substantial market share, exceeding 25%. The country's growing middle class, along with the increasing interest in fitness and sports, has spurred demand for high-quality activewear. Urbanization is driving the shift toward healthier lifestyles, creating a robust market for performance-oriented activewear. Additionally, China's growing e-commerce sector plays a crucial role in the distribution of activewear products, enhancing accessibility and market reach. The market is also witnessing significant expansion from both domestic and international brands, making it one of the most competitive and dynamic activewear markets in the region.
Japan
Japan holds a significant share of the Asia Pacific activewear market, accounting for over 15%. The market is driven by the country's high standards for product quality, with consumers favoring durable and stylish activewear. Japan has a strong culture of fitness, particularly in sports such as running, cycling, and yoga, which further boosts demand for performance-oriented activewear. Moreover, the growing popularity of athleisure wear among the younger population is contributing to market expansion. E-commerce is also thriving in Japan, making activewear more accessible and facilitating the growth of both local and international activewear brands.
India
India’s activewear market is experiencing rapid growth, with a market share of around 10%. The country’s young and urbanizing population is increasingly adopting fitness and wellness trends, fueling demand for activewear products. With rising disposable income and the expansion of the e-commerce sector, more consumers are able to access a wide range of activewear brands. In addition, the growing middle class and a shift towards athleisure as a daily fashion choice further drive the market. As the fitness culture continues to evolve in India, the demand for stylish, functional, and affordable activewear is expected to grow.
South Korea
South Korea holds a prominent share in the Asia Pacific activewear market, representing over 7%. The market is driven by the country’s strong fitness culture, high participation in sports, and the increasing popularity of wellness activities such as yoga and running. South Korean consumers place a high value on the quality and performance of activewear, fueling demand for premium products. The country also has a thriving athleisure trend, with activewear seamlessly integrated into daily fashion. E-commerce platforms are growing rapidly in South Korea, further boosting the reach of activewear brands in the market.
Australia
Australia contributes significantly to the Asia Pacific activewear market, holding a market share of around 5%. The country’s focus on outdoor activities, sports, and fitness has led to a strong demand for activewear, particularly for running, swimming, and gym activities. The Australian market is also driven by the growing trend of athleisure wear, as consumers seek comfortable yet stylish options for both fitness and everyday wear. The rise of online shopping and the presence of global activewear brands have made it easier for consumers to access a wide range of activewear products.
Southeast Asia
Southeast Asia is witnessing robust growth in the activewear market, holding a combined market share of 6%. The region's expanding middle class, increased participation in sports, and rising health consciousness are key factors driving demand for activewear products. Countries like Indonesia, Malaysia, and the Philippines are seeing a rise in fitness trends, creating opportunities for both local and international brands. The rapid growth of e-commerce platforms in Southeast Asia also plays a crucial role in expanding the availability of activewear, further accelerating market growth and offering new opportunities for expansion.
Market Segmentations:
By Product
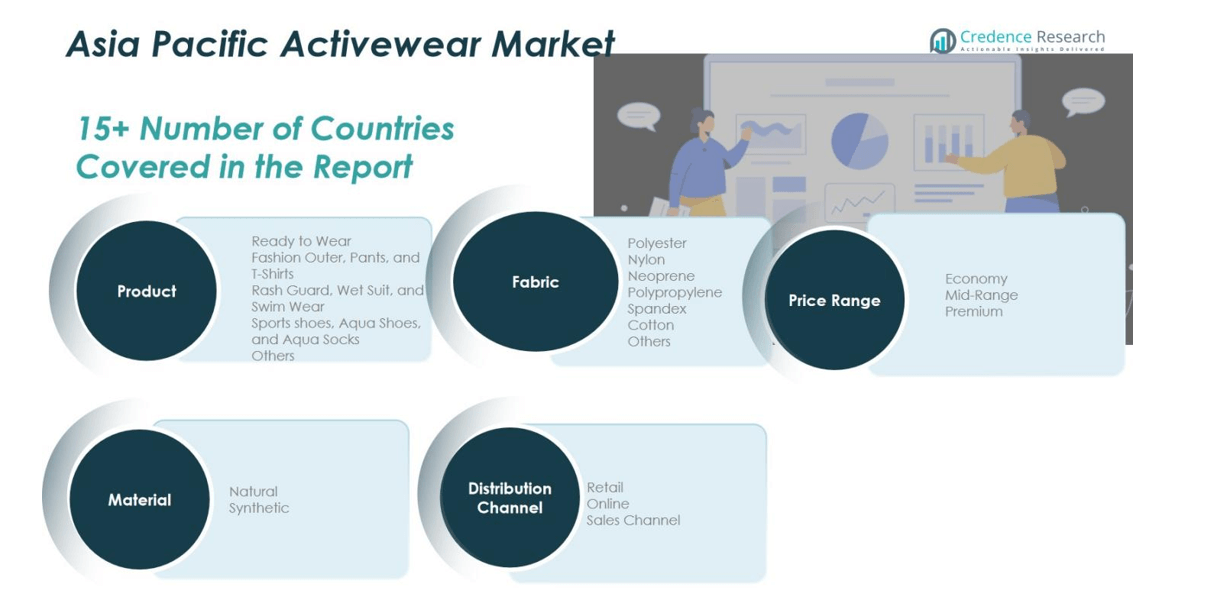
- Ready to Wear
- Fashion Outer, Pants, and T-Shirts
- Rash Guard, Wet Suit, and Swim Wear
- Sports Shoes, Aqua Shoes, and Aqua Socks
- Others
By Fabric
- Polyester
- Nylon
- Neoprene
- Polypropylene
- Spandex
- Cotton
- Others
By Material Segment:
- Natural
- Synthetic
By Price Range
- Economy
- Mid-Range
- Premium
By Distribution Channel
- Retail
- Online
- Others
By Region
- China
- Japan
- India
- South Korea
- Australia
- South East Asia
Competitive Landscape
Competitive analysis of the Asia Pacific Activewear Market reveals a dynamic and highly competitive environment, with major players such as Adidas AG, Nike, Inc., Puma SE, and Lululemon Athletica Inc. leading the charge. These brands dominate the market through continuous innovation, strong brand recognition, and strategic marketing campaigns. Adidas and Nike, with their extensive product portfolios and significant market presence, are particularly influential in the region, catering to both performance-oriented and athleisure segments. Regional players are also gaining traction by focusing on local consumer preferences and affordability. The market is witnessing increasing competition from both established and emerging brands, as the demand for activewear continues to rise. Additionally, e-commerce platforms have become a key distribution channel, allowing brands to reach a wider audience and enhance accessibility. Strategic collaborations, endorsements by sports celebrities, and product diversification are also becoming common tactics for companies to maintain a competitive edge in the rapidly evolving market.
Key Player Analysis
- Adidas AG
- Nike, Inc.
- Puma SE
- Lululemon Athletica Inc.
- The Columbia Sportswear Company
- VF Corporation
- ASICS Corporation
- Skechers USA, Inc.
- Under Armour, Inc.
- Hanesbrands Inc.
Recent Developments
- In March 2025, Frasers Group announced that it will open over 350 stores of its Sports Direct chain across India and Southeast Asia (including Thailand, Vietnam, Cambodia) under its partnership with Indonesian retailer MAP Active.
- In July 2025, Lululemon revealed a partnership with Indian e‑commerce and retail giant Tata CLiQ to launch its first physical store and online presence in India, targeted for the second half of 2026.
- In April 2024, Agilitas Sports acquired exclusive rights to design, manufacture and distribute the Italian sports‑brand Lotto in India and Australia.
- In September 2025, Lehar Footwear Limited launched its new sports & athleisure brand RANNR in India to tap into the growing activewear/footwear market among younger consumers.
Report Coverage
The research report offers an in-depth analysis based on Product, Material, Fabric, Price Range, Distribution Channel and Region. It details leading market players, providing an overview of their business, product offerings, investments, revenue streams, and key applications. Additionally, the report includes insights into the competitive environment, SWOT analysis, current market trends, as well as the primary drivers and constraints. Furthermore, it discusses various factors that have driven market expansion in recent years. The report also explores market dynamics, regulatory scenarios, and technological advancements that are shaping the industry. It assesses the impact of external factors and global economic changes on market growth. Lastly, it provides strategic recommendations for new entrants and established companies to navigate the complexities of the market.
Future Outlook
- The Asia Pacific Activewear Market is expected to continue its robust growth, driven by increasing consumer interest in health, fitness, and wellness
- The demand for athleisure wear will continue to rise as consumers seek comfort and style for both sports and everyday use
- E-commerce platforms will play a pivotal role in driving market expansion, providing brands with wider access to a broader consumer base
- Consumers will increasingly prefer sustainable and eco-friendly activewear products, pushing brands to adopt environmentally responsible materials and production processes.
- The market will see greater product diversification, with brands offering specialized activewear for different sports, outdoor activities, and wellness practices.
- Technological advancements in fabric and garment manufacturing will enhance the functionality of activewear, offering better performance and comfort.
- The younger demographic will remain a significant driving force, with millennials and Gen Z investing more in activewear as part of their lifestyle
- Regional players will expand their presence by focusing on affordability, while international brands will continue to cater to premium market segments
- Fitness trends, including home workouts and outdoor activities, will increase demand for versatile activewear products suited for various purposes.
- The rise of social media and influencer marketing will drive brand awareness and consumer purchasing decisions, especially among younger consumers.
Request a Free Sample
Fill in your details and we'll send you a free sample report.
- Sample data tables & charts
- Research methodology
Need a Custom Version of This Report?
Tailor the scope, geography, or segments to your exact requirements.
- Custom geography or segment scope
- Direct access to our analyst team
Frequently Asked Questions
What is the current market size for Asia Pacific Activewear Market, and what is its projected size in 2032?
At what Compound Annual Growth Rate is the Asia Pacific Activewear Market projected to grow between 2025 and 2032?
Which Asia Pacific Activewear Market segment held the largest share in 2024?
What are the primary factors fueling the growth of the Asia Pacific Activewear Market?
Who are the leading companies in the Asia Pacific Activewear Market?
Table of Content
Chapter 1. Report Introduction
- 1.1 Report Description & Purpose
- 1.1.1 Report Title & Market Definition
- 1.1.2 Unique Selling Propositions (USP) & Key Differentiators
- 1.1.3 Value Proposition for Stakeholders
- 1.2 Research Objectives
- 1.2.1 Market Sizing Objectives (Volume & Revenue) (Volume Where Applicable)
- 1.2.2 Segmentation Objectives
- 1.2.3 Competitive Intelligence Objectives
- 1.2.4 Forecast & Scenario Objectives
- 1.3 Report Scope
- 1.3.1 Asia Pacific Activewear Scope – Segments & Subsegments Covered
- 1.3.2 Geographic Scope – Selected Region & Countries Covered
- 1.3.3 Historical Period, Base Year & Forecast Period (2018; forecast to 2032)
- 1.3.4 Inclusions & Exclusions
- 1.4 Industry Classification & Applicable Codes
- 1.5 Currency, Measurement Units & Valuation Basis
- 1.6 Target Stakeholders
- 1.7 Limitations & Assumptions
Chapter 2. Executive Summary
- 2.1 Asia Pacific Activewear Snapshot
- 2.1.1 Market Size – Historical (2018) & Forecast (2018-2032) (2018: USD 106,277.37 million → 2032: USD 2,36,012.63 million)
- 2.1.2 Volume & Revenue – Regional Totals (Volume Where Applicable)
- 2.1.3 Key Market Highlights – Top Five Facts
- 2.2 Asia Pacific Activewear Segmentation Snapshot
- 2.2.1 Market Split by Country – 2018 vs. 2032
- 2.3 Competitive Snapshot
- 2.3.1 Top 10 Players by Revenue Share – 2018
- 2.3.2 Top 10 Players by Volume Share – 2018 (Volume Where Applicable)
- 2.3.3 Recent Strategic Developments (18-Month Summary)
- 2.4 Key Investment Highlights & Strategic Conclusions
Chapter 3. Asia Pacific Activewear Dynamics & Industry Analysis
- 3.1 Market Overview & Context
- 3.1.1 Asia Pacific Activewear Position in the Broader Industry Value Chain
- 3.1.2 Demand Structure & Purchasing Dynamics
- 3.1.3 Market Maturity & Development Stage by Country
- 3.2 Asia Pacific Activewear Drivers
- 3.3 Asia Pacific Activewear Restraints & Challenges
- 3.4 Asia Pacific Activewear Opportunities
- 3.5 Porter's Five Forces Analysis
- 3.5.1 Threat of New Entrants
- 3.5.2 Bargaining Power of Suppliers
- 3.5.3 Bargaining Power of Buyers
- 3.5.4 Threat of Substitutes
- 3.5.5 Competitive Rivalry – Intensity Assessment
- 3.6 Asia Pacific Activewear Value Chain Analysis
- 3.6.1 Upstream – Key Inputs, Resources & Suppliers
- 3.6.1.1 Key Input/Resource 1
- 3.6.1.2 Key Input/Resource 2
- 3.6.1.3 Key Input/Resource 3
- 3.6.2 Midstream – Core Operations & Value Creation
- 3.6.2.1 Operating Model & Process Overview
- 3.6.2.2 Key Operating Locations & Capabilities by Company
- 3.6.3 Downstream – Market Channels & End Users
- 3.6.3.1 Direct Sales & Customer Engagement Channels
- 3.6.3.2 Indirect Sales, Intermediaries & Partner Channels
- 3.6.4 Value Chain Profitability Analysis
- 3.6.1 Upstream – Key Inputs, Resources & Suppliers
- 3.7 PESTEL Analysis
- 3.7.1 Political Factors
- 3.7.2 Economic Factors
- 3.7.3 Social Factors
- 3.7.4 Technological Factors
- 3.7.5 Environmental Factors
- 3.7.6 Legal Factors
- 3.8 Asia Pacific Activewear Supply Chain Analysis
- 3.8.1 Critical Input & Resource Availability Risk Assessment
- 3.8.2 Supplier & Operational Concentration Risk (Geographic Exposure)
- 3.8.3 Supply & Service Disruption Impact Analysis
- 3.9 Regional & Country Regulatory Landscape
Note: The regulatory and policy landscape section covers regulations based on their applicability to the market, Asia Pacific Activewear category, geography, and scope of the study. Only regulatory frameworks with a material impact on operations, compliance, trade, sustainability, or market access are analyzed in detail.
Chapter 4. Key Investment Pockets & Opportunity Analysis
- 4.1 Asia Pacific Activewear Attractiveness Analysis
- 4.1.1 By Country – Investment Attractiveness Matrix (Market Size × CAGR)
- 4.2 Absolute Revenue Growth Opportunity
- 4.2.1 By Country – Absolute Revenue Growth Through 2032
- 4.3 Incremental Demand Opportunity
- 4.3.1 By Country – Incremental Demand Through 2032
- 4.3.2 Segment – Incremental Demand
- 4.4 Emerging Submarket Opportunity Deep Dive (Subject to Applicability)
- 4.5 Priority Country Opportunity Scorecards
- 4.5.1 Priority Country 1
- 4.5.2 Priority Country 2
- 4.5.3 Priority Country 3
- 4.5.4 Priority Country 4
Note: Priority countries are selected from within the region covered by the study. Numbered entries are indicative and are populated with relevant country names based on market size, growth potential, and strategic relevance.
Chapter 5. Asia Pacific Activewear Cross-Border Trade & Market Access Analysis
- 5.1 Intra-Regional & Extra-Regional Trade Overview
- 5.1.1 Regional Export Value by Country (2018)
- 5.1.2 Regional Export Volume by Country (2018) (Volume Where Applicable)
- 5.1.3 Regional Import Value by Country (2018)
- 5.1.4 Regional Import Volume by Country (2018) (Volume Where Applicable)
- 5.1.5 Net Trade Balance by Country (2018)
- 5.2 Export Analysis – Segment
- 5.2.1 Category 1 (Applicable Classification Code)
- 5.2.2 Category 2 (Applicable Classification Code)
- 5.2.3 Category 3 (Applicable Classification Code)
- 5.2.4 Category 4 (Applicable Classification Code)
- 5.2.5 Category 5 (Applicable Classification Code)
- 5.3 Import Analysis – Segment
- 5.3.1 Category 1 (Applicable Classification Code)
- 5.3.2 Category 2 (Applicable Classification Code)
- 5.3.3 Category 3 (Applicable Classification Code)
- 5.3.4 Category 4 (Applicable Classification Code)
- 5.3.5 Category 5 (Applicable Classification Code)
- 5.4 Cross-Border Pricing & Transaction Benchmarks
- 5.4.1 Export Pricing – Segment & Country
- 5.4.2 Import Pricing – Segment & Source Country
- 5.4.3 Price Trends (2018)
- 5.5 Key Cross-Border Trade & Delivery Routes
- 5.5.1 Cross-Border Trade/Delivery Route 1
- 5.5.2 Cross-Border Trade/Delivery Route 2
- 5.5.3 Cross-Border Trade/Delivery Route 3
- 5.5.4 Cross-Border Trade/Delivery Route 4
- 5.5.5 Cross-Border Trade/Delivery Route 5
- 5.6 Trade Policy & Market Access Impact Assessment
- 5.6.1 Tariff & Non-Tariff Barriers
- 5.6.2 Regional Trade & Economic Integration Frameworks
- 5.6.3 Bilateral & Multilateral Trade Agreements
- 5.6.4 Cross-Border Operating, Licensing & Localization Requirements
Note: Cross-border analysis applies where relevant to Asia Pacific Activewear. Country trade flows distinguish intra-regional activity from trade with markets outside the region. Regional external trade totals exclude intra-regional flows to avoid double counting. Classifications and transaction measures follow the market scope; volume and route analyses apply only where meaningful.
Chapter 6. Competitive Landscape & Company Benchmarking
- 6.1 Asia Pacific Activewear Concentration & Structure
- 6.1.1 Herfindahl-Hirschman Index (HHI) – the historical period vs. 2018
- 6.1.2 Leading, Mid-Sized & Emerging Player Structure
- 6.1.3 Global, Regional & Local Player Dynamics
- 6.2 Asia Pacific Activewear Share Analysis – 2018
- 6.2.1 Regional Revenue Share by Company
- 6.2.2 Regional Volume Share by Company (Volume Where Applicable)
- 6.2.3 Company Revenue Share by Country
- 6.2.4 Market Share Evolution (the historical period vs. 2018)
- 6.2.5 Company Market Share by Key Segment
- 6.2.6 Company Market Share by Customer Group
- 6.3 Operating Scale, Capacity & Infrastructure Analysis
- 6.3.1 Regional Operating Scale & Supply Capacity
- 6.3.2 Resource Utilization & Operating Efficiency
- 6.3.3 Output, Service Delivery & Activity Metrics
- 6.3.4 Operating Footprint & Infrastructure Map
- 6.3.5 Planned Operational & Capacity Expansion
- 6.4 Asia Pacific Activewear Competitive Benchmarking Matrix
- 6.4.1 Revenue, Growth, Profitability & Operating Metric Comparison
- 6.4.2 Channel Revenue Mix
- 6.4.3 Revenue Exposure by Country Within the Region
- 6.4.4 R&D Intensity
- 6.4.5 Sustainability Maturity
- 6.5 Strategic Developments in Asia Pacific Activewear (Last 24 Months)
- 6.5.1 Mergers, Acquisitions & Divestments
- 6.5.2 New Products, Services & Solutions in Asia Pacific Activewear
- 6.5.3 Operational & Infrastructure Expansions
- 6.5.4 Strategic Alliances, Joint Ventures & Partnerships
- 6.5.5 Distribution Expansion & Market Entry
- 6.5.6 Sustainability & ESG Initiatives
- 6.6 Competitive Strategy Mapping
- 6.6.1 Leader, Challenger, Follower & Niche Classification
- 6.6.2 Pricing Strategy Comparison
- 6.6.3 Channel Strategy Matrix
Note: Strategic developments are included based on their materiality and the availability of reliable information.
Chapter 7. Asia Pacific Activewear – By Sales & Delivery Channel
- 7.1 Segment Overview
- 7.1.1 Volume & Revenue Split by Channel (2018 & 2032) (Volume Where Applicable)
- 7.1.2 Channel Mix Evolution (2018-2032)
Chapter 8. Country Market Analysis – Regional Overview
- 8.1 Country Market Overview Within the Region
- 8.1.1 Country Volume Share Within the Region (Where Applicable)
- 8.1.2 Country Revenue Share Within the Region
- 8.1.3 Market Volume by Country (Where Applicable)
- 8.1.4 Market Revenue by Country
- 8.1.5 Country Forecasts Through 2032
- 8.2 Cross-Country Segment Analysis
- 8.2.1 By Sales & Delivery Channel
- 8.2.2 By Competitive Positioning & Price Tier
Chapter 9. Asia Pacific Activewear – Priority Country 1
Chapter 10. Asia Pacific Activewear – Priority Country 2
Chapter 11. Asia Pacific Activewear – Priority Country 3
Chapter 12. Asia Pacific Activewear – Priority Country 4
Chapter 13. Asia Pacific Activewear Company Profiles
- 13.1 [Company 01]
- 13.1.1 Company Overview
- 13.1.2 Key Management Personnel
- 13.1.3 Products & Services Portfolio
- 13.1.4 Financial Performance
- 13.1.5 Regional Market Focus & Country Presence
- 13.1.6 Recent Developments & Strategic Initiatives
Note: The company profile list is preliminary and may change based on research findings, market developments, data availability, and client requirements.
Chapter 14. Appendices
- Appendix A – List of Abbreviations & Acronyms
- Appendix B – Industry Classification Code Reference – Full Series
- Appendix C – Supply, Output & Operating Capacity Data Tables
- Appendix D – End-Use & Demand Base Tables
- Appendix E – Demand, Adoption & Usage Assumptions
- Appendix F – Pricing & Revenue Metric Reference Tables
- Appendix G – Company Operations & Infrastructure Database
- Appendix H – Cross-Border Trade & Activity Data Tables (Where Applicable)
- Appendix I – Regulatory Summary Tables
- Appendix J – Primary Research Participant List (Anonymized)
- Appendix K – Primary Research Questionnaire Framework
- Appendix L – Data Sources & Bibliography
- Appendix M – Market Size Divergence & Source Comparison
Chapter 15. Research Methodology
- 15.1 Research Framework & Philosophy
- 15.2 Secondary Research – Sources, Hierarchy & Data Extraction
- 15.3 Data Modeling – Country-Level Estimates & Regional Aggregation
- 15.4 Primary Research – Stakeholder Framework, LOI & Sample Sizes
- 15.5 Forecast Methodology – Regression, Scenario & Sensitivity Analysis
- 15.6 Quality Control – Four-Layer Validation Framework
- 15.7 Limitations & Standard Assumptions
- 15.8 Disclaimer
