
Market Overview:
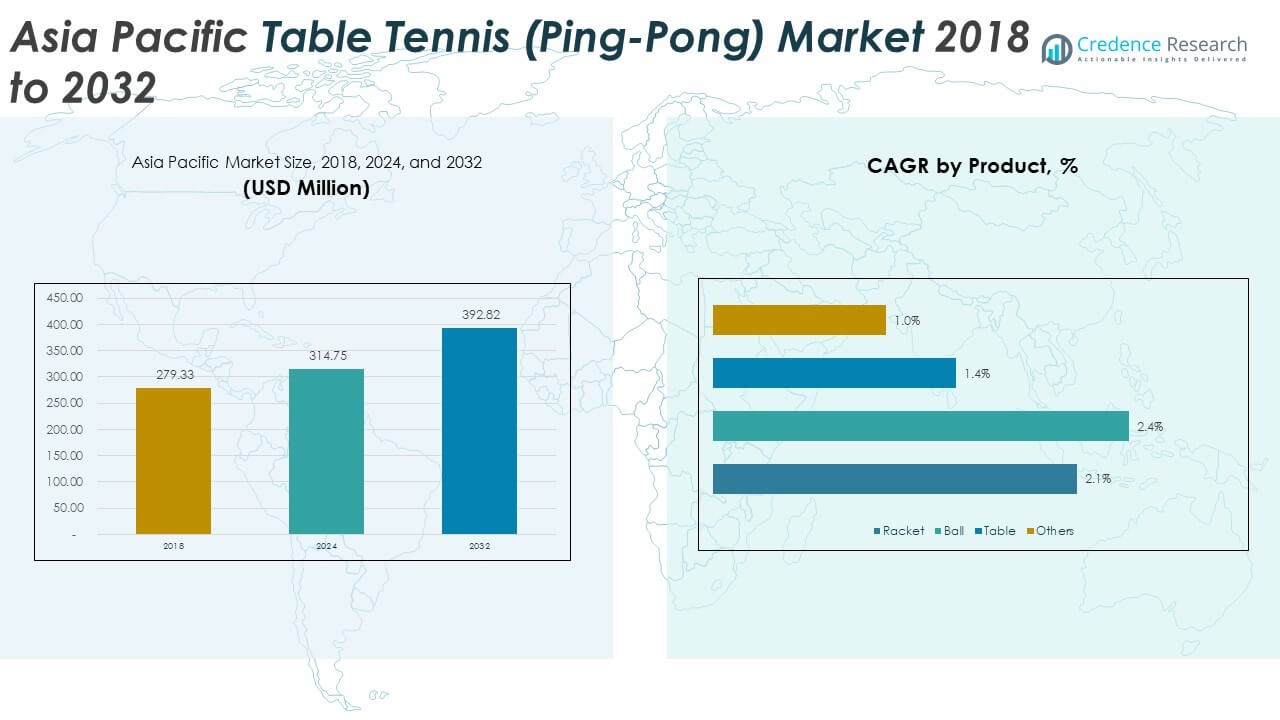
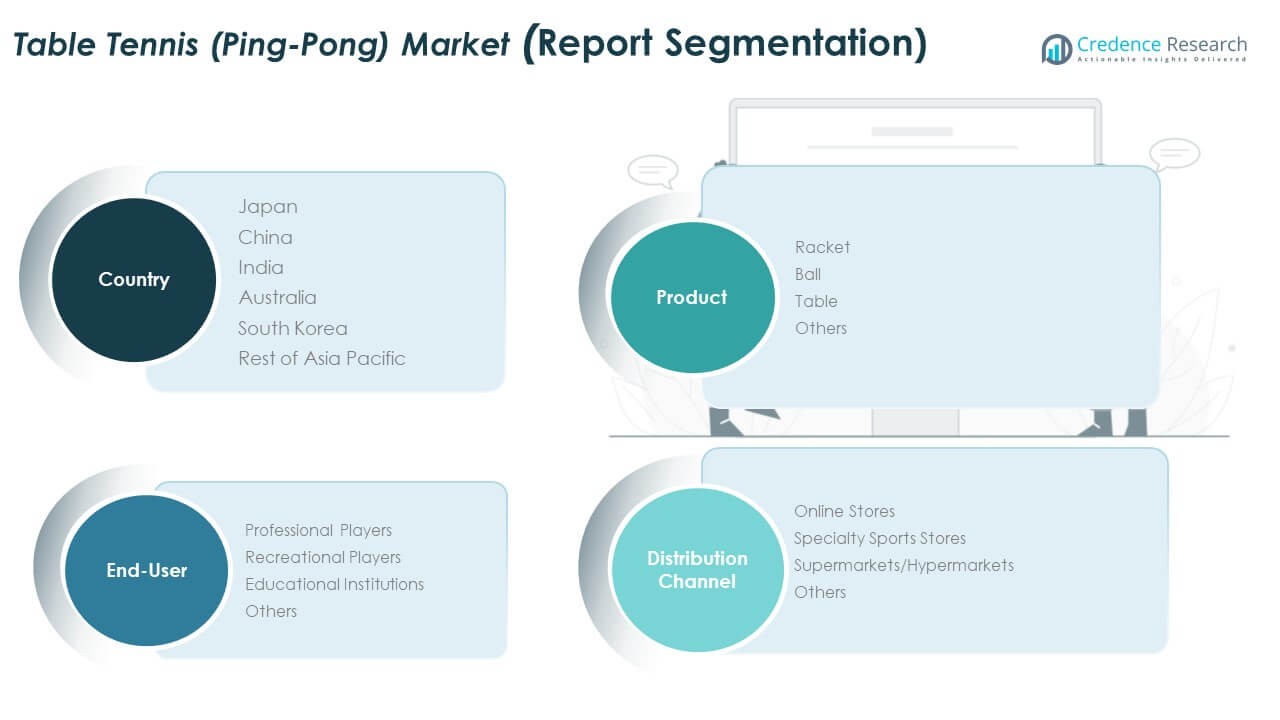
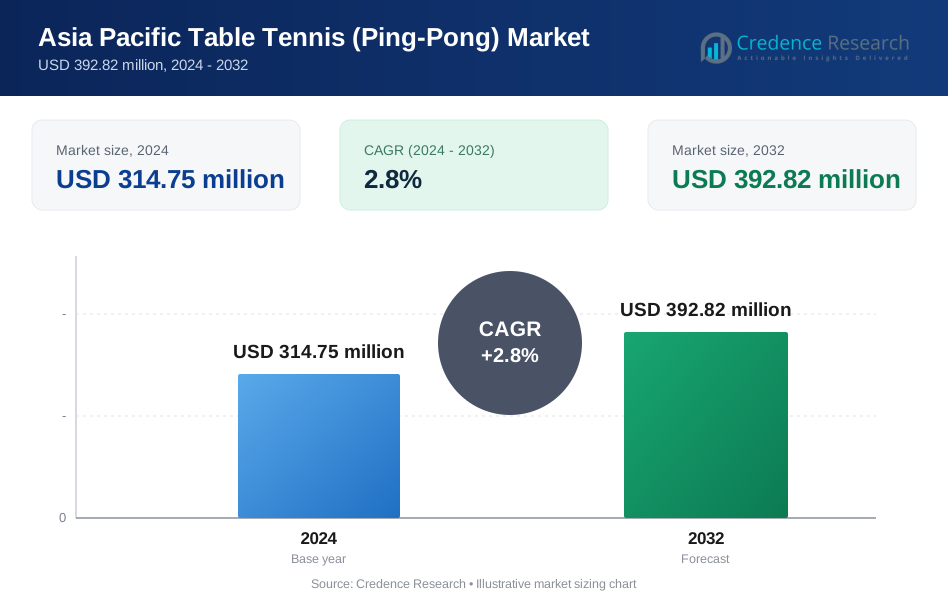
The Asia Pacific Table Tennis (Ping-Pong) Market size was valued at USD 279.33 million in 2018 to USD 314.75 million in 2024 and is anticipated to reach USD 392.82 million by 2032, at a CAGR of 2.8% during the forecast period.
| REPORT ATTRIBUTE | DETAILS |
|---|---|
| Historical Period | 2020-2023 |
| Base Year | 2024 |
| Forecast Period | 2025-2032 |
| Asia Pacific Table Tennis (Ping-Pong) Market Size 2024 | USD 314.75 Million |
| Asia Pacific Table Tennis (Ping-Pong) Market, CAGR | 2.8% |
| Asia Pacific Table Tennis (Ping-Pong) Market Size 2032 | USD 392.82 Million |
The market growth is driven by rising sports participation, government-backed sports initiatives, and increasing popularity of recreational activities across schools, clubs, and fitness centers. Rising awareness of health benefits and the inclusion of table tennis in academic programs further enhance adoption. Professional tournaments, sponsorships, and digital promotions have also contributed to increased visibility, motivating youth and adults to participate. The availability of affordable equipment and the rise of e-commerce platforms make access easier, fueling market penetration.
Regionally, China leads the Asia Pacific market, supported by a strong sports culture, professional leagues, and established training infrastructure. Japan and South Korea also show strong adoption, driven by competitive sports programs and increasing investments in youth development. Emerging markets like India and Southeast Asian countries are experiencing growing interest, supported by rising disposable incomes and expanding sports infrastructure. These regions are becoming important growth hubs as governments and private institutions invest in facilities, coaching, and awareness campaigns to boost table tennis participation.
Market Insights:
- The Asia Pacific Table Tennis (Ping-Pong) Market was valued at USD 279.33 million in 2018, reached USD 314.75 million in 2024, and is projected to hit USD 392.82 million by 2032, expanding at a CAGR of 2.8%.
- China leads with 42% market share, supported by a strong sports culture, professional leagues, and large-scale manufacturing. Japan and South Korea together hold 28%, benefiting from advanced training systems and structured sports programs.
- India, Australia, and Southeast Asia collectively hold 30%, with India and Southeast Asia growing fastest due to rising disposable incomes, urbanization, and expanding sports infrastructure.
- Rackets dominate product sales with nearly 40% share in 2024, driven by continuous upgrades and replacement demand from both professional and recreational players.
- Balls account for around 25% share, fueled by frequent replacement cycles in training and tournaments, while tables and other accessories contribute the remaining portion of market demand.
Market Drivers:
Growing Participation Supported by Expanding Infrastructure Development
The Asia Pacific Table Tennis (Ping-Pong) Market is witnessing strong momentum due to expanding sports participation. Governments across the region are investing in indoor sports facilities, encouraging both professional and recreational play. Schools and colleges are incorporating table tennis programs to enhance physical education, driving consistent demand. Private clubs and training academies also support the sport’s development, offering access to advanced coaching. Urbanization and rising disposable incomes allow families to invest in quality equipment. The presence of professional tournaments and sponsorships has raised the sport’s appeal among youth. It benefits from structured leagues and televised events that capture public interest. The growing infrastructure pipeline ensures long-term adoption and higher market stability.
- For instance, table tennis participation in China is substantial, with estimates suggesting up to 300 million players on occasion and strong government support for its development. The sport is integrated into school systems as a key component of physical education, and athletes can receive benefits for their skills.
Rising Health Awareness and Adoption of Active Lifestyles
Growing awareness about fitness has pushed individuals toward indoor sports activities. The Asia Pacific Table Tennis (Ping-Pong) Market benefits from this trend as table tennis is seen as both a recreational and health-supportive game. Consumers are increasingly engaging in indoor sports that enhance agility and improve cardiovascular wellness. It offers a low-impact but highly effective workout, making it suitable across age groups. The rising middle-class population shows preference for indoor, family-oriented leisure activities. Sports retailers promote equipment highlighting health benefits, further boosting product demand. Healthcare professionals recommend the sport for improving hand-eye coordination and mental agility. This health-linked appeal ensures sustained growth across developed and developing economies.
Technological Advancement in Equipment Manufacturing and Distribution Channels
Equipment innovation plays a critical role in supporting industry expansion. The Asia Pacific Table Tennis (Ping-Pong) Market benefits from improved paddles, tables, and balls designed for better performance and durability. Manufacturers invest in lightweight and sustainable materials to enhance gameplay. It also gains from smart tables and digital tools that allow players to track performance metrics. E-commerce platforms create strong distribution channels, offering consumers access to international brands. Online retail supports price comparisons and convenience, encouraging higher sales volumes. Local brands also gain exposure through digital channels, improving competition and variety. These technological improvements make the sport more attractive to both new and experienced players.
Strong Support from Sponsorship, Endorsements, and Institutional Backing
Corporate sponsorships and endorsements enhance the visibility of table tennis in Asia Pacific. The Asia Pacific Table Tennis (Ping-Pong) Market benefits from athletes partnering with brands to promote equipment and accessories. Sports councils and federations allocate funds to nurture talent and organize competitive events. It gains further visibility through regional championships and global tournaments hosted in Asia. Media coverage increases audience engagement, driving new interest among youth. Sponsorships also create aspirational value for professional careers in the sport. Multinational brands support regional leagues, improving financial sustainability of clubs and organizations. This collective institutional backing ensures consistent demand and brand recognition across the region.
- The Asian Table Tennis Union (ATTU) collaborates with various partners to support tournaments in the region. For instance, Li-Ning became the Global Premium Partner for the 29th Asian Youth Table Tennis championships in 2025
Market Trends:
Rising Popularity of Table Tennis in Academic and Community Programs
The integration of table tennis into schools and community centers is shaping participation. The Asia Pacific Table Tennis (Ping-Pong) Market gains traction as educational institutions adopt it to promote balanced physical activity. Local governments view community-based sports as vital for improving youth engagement. It is gaining attention from parents who prefer safe, indoor alternatives for their children. Table tennis tables in academic complexes ensure regular practice and skill-building opportunities. Community programs often combine coaching with recreational play, strengthening grassroots development. Affordable kits for beginners encourage broad participation across socio-economic groups. This integration trend highlights long-term growth prospects at foundational levels.
- For example, Butterfly supported the 2024 Table Tennis England Schools Championships, where more than 400 young players competed in over 1,000 matches. The company supplied 36 ITTF-approved Europa 25 mm tables, nets, scoring machines, surrounds, and R40 balls for the event.
Influence of International Competitions and Media Coverage on Consumer Engagement
International competitions broadcast widely across Asia Pacific drive enthusiasm and consumer interest. The Asia Pacific Table Tennis (Ping-Pong) Market benefits from televised matches that inspire younger generations. Professional athletes from China, Japan, and Korea act as role models, fueling participation. It receives greater visibility through digital platforms streaming global and regional events. Fans show rising interest in merchandise and branded equipment linked to their favorite players. The influence of media helps elevate the perception of table tennis as a serious competitive sport. Growing engagement also supports increased enrollment in training programs. Media-driven exposure creates aspirational goals that sustain growth momentum.
Expansion of Lifestyle-Oriented Recreational Facilities Offering Table Tennis Experiences
Leisure and fitness centers are increasingly incorporating table tennis facilities for members. The Asia Pacific Table Tennis (Ping-Pong) Market gains from lifestyle clubs catering to wellness-focused urban consumers. Cafes and recreational spaces integrate table tennis tables to attract young audiences. It strengthens consumer connections by merging social experiences with sports. Developers of residential complexes also include sports amenities to increase property appeal. Hospitality venues like resorts and hotels promote table tennis as a leisure feature. Recreational clubs highlight the sport’s inclusivity, making it suitable for all ages. This trend expands consumer exposure, linking the sport with modern lifestyle choices.
Rising Customization and Personalization of Table Tennis Equipment
Consumers are increasingly drawn to customized paddles, apparel, and accessories. The Asia Pacific Table Tennis (Ping-Pong) Market benefits from this trend as players seek personalized gear. Manufacturers offer products tailored to grip styles, weight preferences, and material choices. It promotes premiumization by encouraging consumers to invest in specialized equipment. The rise of 3D printing allows localized production of custom designs. Branding opportunities also emerge, with teams and clubs ordering personalized kits. E-commerce platforms simplify the process, offering custom options at scale. This personalization trend reinforces consumer loyalty and differentiates products in a competitive market.
- For instance, Paddle Palace’s 2024 product line includes a wide selection of customizable paddle options, enabling customers to choose from various blades and rubber types to create a personalized paddle tailored to their style.
Market Challenges Analysis:
High Dependence on Professional Endorsements and Limited Awareness in Rural Areas
The Asia Pacific Table Tennis (Ping-Pong) Market faces limitations due to its heavy reliance on endorsements and organized competitions. Sponsorships boost visibility, but lack of promotion in smaller towns restricts wider adoption. It struggles to capture audiences outside urban centers, where sports infrastructure remains weak. Many rural regions prioritize outdoor or traditional sports, limiting penetration for table tennis. Cost of equipment still acts as a barrier for low-income communities. Dependence on celebrity players makes consumer interest volatile, tied to performance cycles. Limited media coverage outside key markets further reduces awareness. Over-reliance on selective exposure creates uneven growth patterns across the region.
Competition from Alternative Sports and Barriers to Long-Term Retention
Table tennis competes with a wide range of indoor and outdoor sports across Asia Pacific. The Asia Pacific Table Tennis (Ping-Pong) Market faces difficulty retaining participants when competing sports receive higher media visibility. Younger audiences often shift interest toward mainstream sports like badminton, cricket, or basketball. It lacks the same level of promotional campaigns seen in these sports, creating an imbalance. Equipment costs discourage casual players from long-term commitment. Absence of consistent coaching support in smaller cities reduces skill development. Seasonal interest spikes during tournaments but declines afterward, creating unstable participation levels. Competition from alternatives challenges sustainable market expansion.
Market Opportunities:
Expansion of Digital Coaching Platforms and Online Engagement Channels
Digital innovation creates promising growth avenues for the industry. The Asia Pacific Table Tennis (Ping-Pong) Market can benefit from online coaching platforms and video-based tutorials. E-learning models allow aspiring players to access quality training remotely. It strengthens grassroots development by bridging the gap in regions lacking coaches. Social media campaigns increase visibility, promoting table tennis as an accessible sport. Virtual communities build connections among fans, expanding engagement beyond physical spaces. Online tournaments also create new formats that appeal to younger generations. Digital engagement offers long-term opportunities for player development and fan retention.
Growing Institutional Investments and Inclusion in Public Fitness Programs
Government policies and institutional support provide further scope for expansion. The Asia Pacific Table Tennis (Ping-Pong) Market benefits from integration into public fitness and recreational initiatives. It secures relevance in urban wellness agendas where inclusive indoor sports gain importance. Public schools and universities allocate funds for facilities, improving exposure to younger demographics. Sports ministries recognize its role in promoting agility and coordination, boosting program adoption. Non-profit organizations introduce affordable equipment kits to disadvantaged communities. It also receives traction through collaborations with international federations for talent exchange. Stronger institutional investments enhance inclusivity, supporting long-term industry growth.
Market Segmentation Analysis:
The Asia Pacific Table Tennis (Ping-Pong) Market demonstrates strong diversification across product categories, end-user groups, and distribution channels.
By product type, rackets remain the most demanded segment due to continuous upgrades in design, material quality, and performance attributes. Balls also hold a significant share, supported by frequent replacements in training and competitions. Tables are gaining traction in both professional and recreational facilities, while other accessories, including nets and apparel, contribute to steady growth. The product mix highlights both performance-driven demand and lifestyle adoption across markets.
- For example, Nittaku’s 3-star Premium balls dominate training and tournament use, known for their durability and adherence to ITTF standards, which require frequent ball replacements during matches.
By application, recreational players dominate the industry, driven by rising participation in clubs, fitness centers, and community programs. Professional players represent a key revenue stream due to specialized equipment and frequent replacement needs. Educational institutions are expanding adoption by incorporating table tennis into sports programs, further supporting long-term engagement. Other segments, including corporate recreational facilities, contribute to growing demand. It reflects broad-based adoption across diverse user groups, reinforcing market resilience.
By distribution channel, online stores are emerging as a critical growth driver, offering convenience, wider product selection, and price transparency. Specialty sports stores retain importance, particularly for high-end and professional-grade products requiring expert consultation. Supermarkets and hypermarkets contribute to volume sales by catering to casual and beginner-level buyers. Other channels, such as exclusive brand outlets and sports complexes, enhance accessibility in key urban centers. This distribution diversity strengthens the market’s reach and ensures consistent consumer access across different segments.
- For example, specialty sports retailers like Decathlon continue to drive premium product sales by providing expert advice and in-store experiences, particularly for competitive athletes.
Segmentation:
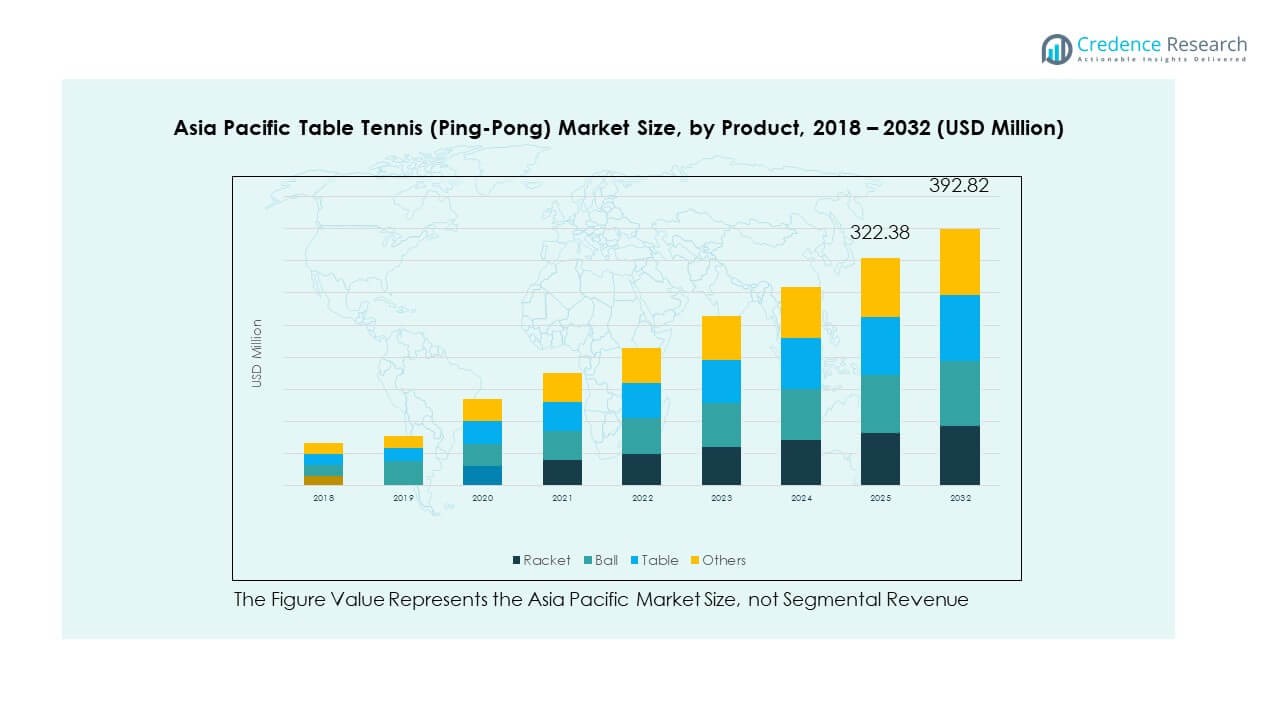
By Product Type
- Racket
- Ball
- Table
- Others
By Application (End User)
- Professional Players
- Recreational Players
- Educational Institutions
- Others
By Distribution Channel
- Online Stores
- Specialty Sports Stores
- Supermarkets/Hypermarkets
- Others
By Country
- China
- Japan
- South Korea
- India
- Australia
- Rest of Asia Pacific
Regional Analysis:
China holds the largest share of the Asia Pacific Table Tennis (Ping-Pong) Market, accounting for 42%. The country maintains a strong sports culture, with table tennis recognized as a national sport. Professional leagues, established training infrastructure, and government-backed sports initiatives fuel steady growth. International tournaments hosted in China enhance global visibility and support continuous player development. Local manufacturers also dominate equipment production, boosting domestic and export markets. It benefits from a highly engaged consumer base spanning professional, recreational, and institutional segments.
Japan and South Korea together represent 28% of the regional market, driven by competitive sports programs and early adoption of advanced equipment. Japan’s structured school-level sports ecosystem promotes consistent participation and talent development. South Korea’s emphasis on competitive training further supports high-value equipment demand. Both countries invest heavily in sports technology, creating opportunities for premium product segments. Rising media coverage and sponsorship deals increase awareness among younger demographics. The Asia Pacific Table Tennis (Ping-Pong) Market in these countries reflects mature structures with strong export potential.
India, Australia, and the Rest of Asia Pacific collectively contribute 30% of the market. India is witnessing rapid growth, supported by expanding sports infrastructure and rising awareness of indoor recreational activities. Australia maintains steady demand through community-based sports clubs and recreational centers. Southeast Asian nations in the Rest of Asia Pacific are emerging, supported by increasing disposable incomes and urban lifestyle adoption. E-commerce penetration strengthens distribution across these markets, driving wider accessibility of branded equipment. It demonstrates high growth potential in these subregions, driven by institutional support and evolving consumer behavior.
Key Player Analysis:
- JOOLA
- Butterfly
- Nanjing Spark Shot Technology Co., Ltd
- Nittaku
- Double Happiness Co. Ltd. (DHS)
- DONIC
- STIGA
- C&C
- TELAMON
- Beijing Sanwei Sport Goods Co., Ltd
- Others
Competitive Analysis:
The Asia Pacific Table Tennis (Ping-Pong) Market is characterized by strong competition among established international brands and regional players. Leading companies such as JOOLA, Butterfly, Nittaku, Double Happiness (DHS), DONIC, and STIGA dominate through extensive product portfolios and global distribution networks. These brands focus on product innovation, introducing advanced rackets, lightweight balls, and durable tables to meet both professional and recreational demand. Regional companies, including Beijing Sanwei Sport Goods Co., Ltd and Nanjing Spark Shot Technology Co., Ltd, enhance competitiveness by offering cost-effective solutions tailored to local markets. Sponsorships, endorsements, and partnerships with sports federations further strengthen brand visibility and consumer trust. The Asia Pacific Table Tennis (Ping-Pong) Market also reflects a growing balance between premiumization and affordability. It shows strong traction for professional-grade equipment supported by competitive sports programs, while affordable ranges attract recreational players and institutions. Online platforms increase exposure for both global and regional brands, intensifying competition across price categories. Companies are also focusing on expanding into emerging markets like India and Southeast Asia, where growth potential remains high.
Recent Developments:
- In June 2025, JOOLA became the Official Equipment Partner for PPA Tour Asia, providing premium balls, nets, and flooring for tournaments to support growing pickleball and table tennis activity across the region. They also introduced their new HC-40 ball with a preview at the Panas Malaysia Open from July 3-6, 2025, coupled with a partnership with PickleRoll for portable court systems to optimize playing conditions at tour venues.
- In April 2025, Double Happiness Co. Ltd (DHS) renewed a multi-year partnership with the International Table Tennis Federation (ITTF) as the Official Table Partner for the ITTF World Championships Finals from 2025 to 2028. DHS will supply innovative equipment including a specially designed Rainbow Table featuring Qatar’s national colors for the 2025 finals.
Report Coverage:
The research report offers an in-depth analysis based on Product Type, Application (End User) and Distribution Channel. It details leading market players, providing an overview of their business, product offerings, investments, revenue streams, and key applications. Additionally, the report includes insights into the competitive environment, SWOT analysis, current market trends, as well as the primary drivers and constraints. Furthermore, it discusses various factors that have driven market expansion in recent years. The report also explores market dynamics, regulatory scenarios, and technological advancements that are shaping the industry. It assesses the impact of external factors and global economic changes on market growth. Lastly, it provides strategic recommendations for new entrants and established companies to navigate the complexities of the market.
Future Outlook:
- Rising government investments in sports infrastructure will strengthen market penetration across urban and semi-urban areas.
- Growing health awareness will continue to position table tennis as a preferred indoor recreational activity.
- Expansion of e-commerce platforms will widen consumer access and drive higher product adoption.
- Demand for premium rackets and tables will rise, supported by professional players and competitive leagues.
- Recreational players will remain the dominant end-user segment, driven by clubs, schools, and community centers.
- Technological innovation in equipment manufacturing will create opportunities for sustainable and performance-driven products.
- Strong growth will emerge from India and Southeast Asia, fueled by rising disposable incomes and institutional support.
- Sponsorships and endorsements will increase brand visibility, influencing consumer preferences toward leading global players.
- Digital coaching platforms and virtual engagement models will open new avenues for skill development.
- Strategic mergers, product launches, and regional expansions will shape competitive positioning in the market.
Request a Free Sample
Fill in your details and we'll send you a free sample report.
- Sample data tables & charts
- Research methodology
Need a Custom Version of This Report?
Tailor the scope, geography, or segments to your exact requirements.
- Custom geography or segment scope
- Direct access to our analyst team
Frequently Asked Questions
What is the current market size for Asia Pacific Table Tennis (Ping-Pong) Market, and what is its projected size in 2032?
At what Compound Annual Growth Rate is the Asia Pacific Table Tennis (Ping-Pong) Market projected to grow between 2024 and 2032?
Which Asia Pacific Table Tennis (Ping-Pong) Market segment held the largest share in 2024?
What are the primary factors fueling the growth of the Asia Pacific Table Tennis (Ping-Pong) Market?
Who are the leading companies in the Asia Pacific Table Tennis (Ping-Pong) Market?
Which region commanded the largest share of the Asia Pacific Table Tennis (Ping-Pong) Market in 2024?
Table of Content
Chapter 1. Report Introduction
- 1.1 Report Description & Purpose
- 1.1.1 Report Title & Market Definition
- 1.1.2 Unique Selling Propositions (USP) & Key Differentiators
- 1.1.3 Value Proposition for Stakeholders
- 1.2 Research Objectives
- 1.2.1 Market Sizing Objectives (Volume & Revenue)
- 1.2.2 Segmentation Objectives
- 1.2.3 Competitive Intelligence Objectives
- 1.2.4 Forecast & Scenario Objectives
- 1.3 Report Scope
- 1.3.1 Asia Pacific Table Tennis (Ping-Pong) Scope – Types & Subtypes Covered
- 1.3.2 Geographic Scope – Regions & Countries Covered
- 1.3.3 Historical Period, Base Year & Forecast Period (2024; forecast to 2032)
- 1.3.4 Inclusions & Exclusions
- 1.4 HS Code & Classification Framework
- 1.5 Currency, Units & Pricing Basis
- 1.6 Target Stakeholders
- 1.7 Limitations & Assumptions
Chapter 2. Executive Summary
- 2.1 Global Asia Pacific Table Tennis (Ping-Pong) Market Snapshot
- 2.1.1 Market Size – Historical (2024) & Forecast (2024-2032) (2024: USD 314.75 million → 2032: USD 392.82 million)
- 2.1.2 Volume & Revenue – Global Totals
- 2.1.3 Key Market Highlights – Top Five Facts
- 2.2 Asia Pacific Table Tennis (Ping-Pong) Market Segmentation Snapshot
- 2.2.1 Market Split by Region – 2024 vs. 2032
- 2.3 Competitive Snapshot
- 2.3.1 Top 10 Players by Revenue Share – 2024
- 2.3.2 Top 10 Players by Volume Share – 2024
- 2.3.3 Recent Strategic Developments (18-Month Summary)
- 2.4 Key Investment Highlights & Strategic Conclusions
Chapter 3. Asia Pacific Table Tennis (Ping-Pong) Market Dynamics & Industry Analysis
- 3.1 Market Overview & Context
- 3.1.1 Asia Pacific Table Tennis (Ping-Pong) Market Position in the Broader Automotive Value Chain
- 3.1.2 OEM vs. Replacement Market Dynamics
- 3.1.3 Market Maturity & Development Stage by Region
- 3.2 Asia Pacific Table Tennis (Ping-Pong) Market Drivers
- 3.3 Asia Pacific Table Tennis (Ping-Pong) Market Restraints & Challenges
- 3.4 Asia Pacific Table Tennis (Ping-Pong) Market Opportunities
- 3.5 Porter's Five Forces Analysis
- 3.5.1 Threat of New Entrants
- 3.5.2 Bargaining Power of Suppliers
- 3.5.3 Bargaining Power of Buyers
- 3.5.4 Threat of Substitutes
- 3.5.5 Competitive Rivalry – Intensity Assessment
- 3.6 Asia Pacific Table Tennis (Ping-Pong) Value Chain Analysis
- 3.6.1 Upstream – Raw Material/Input Suppliers
- 3.6.1.1 Raw Material/Input 1
- 3.6.1.2 Raw Material/Input 2
- 3.6.1.3 Raw Material/Input 3
- 3.6.2 Midstream – Production/Manufacturing/Service Delivery
- 3.6.2.1 Production/Process Overview
- 3.6.2.2 Key Facility Locations & Capacity by Manufacturer
- 3.6.3 Downstream – Distribution & End Consumer
- 3.6.3.1 Primary Channel – B2B/OEM
- 3.6.3.2 Secondary Channels – Dealer, Retail, Online, Direct
- 3.6.4 Value Chain Profitability Analysis
- 3.6.1 Upstream – Raw Material/Input Suppliers
- 3.7 PESTEL Analysis
- 3.7.1 Political Factors
- 3.7.2 Economic Factors
- 3.7.3 Social Factors
- 3.7.4 Technological Factors
- 3.7.5 Environmental Factors
- 3.7.6 Legal Factors
- 3.8 Asia Pacific Table Tennis (Ping-Pong) Supply Chain Analysis
- 3.8.1 Raw Material/Input Supply Risk Assessment
- 3.8.2 Manufacturing Concentration Risk (Geographic Exposure)
- 3.8.3 Trade Disruption Impact Analysis
- 3.9 Regulatory & Policy Landscape
Note: The regulatory and policy landscape section covers regulations based on their applicability to the market, Asia Pacific Table Tennis (Ping-Pong) category, geography, and scope of the study. Only regulatory frameworks with a material impact on operations, compliance, trade, sustainability, or market access are analyzed in detail.
Chapter 4. Key Investment Pockets & Opportunity Analysis
- 4.1 Asia Pacific Table Tennis (Ping-Pong) Market Attractiveness Analysis
- 4.1.1 By Region – Investment Attractiveness Matrix (Volume × CAGR)
- 4.2 Absolute Revenue Growth Opportunity
- 4.2.1 By Region – Absolute USD Growth Through 2032
- 4.3 Incremental Volume Opportunity
- 4.3.1 By Region – Incremental Volume Through 2032
- 4.3.2 Segment – Incremental Volume
- 4.4 Emerging Submarket Opportunity Deep Dive (Subject to Applicability)
- 4.5 Emerging Market Opportunity Scorecards
- 4.5.1 United States
- 4.5.2 Europe
- 4.5.3 Asia
- 4.5.4 Middle East & Africa
Note: Emerging Market Opportunity Scorecards will be included based on relevance and strategic importance. Regions listed are indicative and may vary depending on data availability and market dynamics.
Chapter 5. Asia Pacific Table Tennis (Ping-Pong) Import-Export Analysis & Trade Flows
- 5.1 Global Trade Overview
- 5.1.1 Global Export Value by Country (2024)
- 5.1.2 Global Export Volume by Country (2024)
- 5.1.3 Global Import Value by Country (2024)
- 5.1.4 Global Import Volume by Country (2024)
- 5.1.5 Net Trade Balance by Country (2024)
- 5.2 Export Analysis – Segment
- 5.2.1 Type 1 (HS Code)
- 5.2.2 Type 2 (HS Code)
- 5.2.3 Type 3 (HS Code)
- 5.2.4 Type 4 (HS Code)
- 5.2.5 Type 5 (HS Code)
- 5.3 Import Analysis – Segment
- 5.3.1 Type 1 (HS Code)
- 5.3.2 Type 2 (HS Code)
- 5.3.3 Type 3 (HS Code)
- 5.3.4 Type 4 (HS Code)
- 5.3.5 Type 5 (HS Code)
- 5.4 Average Unit Trade Prices
- 5.4.1 Average Export Price – Segment & Country
- 5.4.2 Average Import Price – Segment & Source Country
- 5.4.3 Price Trends (2024)
- 5.5 Key Trade Route Analysis
- 5.5.1 Trade Route 1
- 5.5.2 Trade Route 2
- 5.5.3 Trade Route 3
- 5.5.4 Trade Route 4
- 5.5.5 Trade Route 5
- 5.6 Trade Policy Impact Assessment
- 5.6.1 US Anti-Dumping & Section 301 Tariffs
- 5.6.2 EU Customs Union Impact
- 5.6.3 Major Free Trade Agreements
- 5.6.4 USMCA Rules of Origin
Note: Trade policy analysis will be included only where relevant to the Asia Pacific Table Tennis (Ping-Pong) market.
Chapter 6. Competitive Landscape & Company Benchmarking
- 6.1 Asia Pacific Table Tennis (Ping-Pong) Market Concentration & Structure
- 6.1.1 Herfindahl-Hirschman Index (HHI) – vs. 2024
- 6.1.2 Tier 1, Tier 2 & Tier 3 Market Structure
- 6.1.3 Global, Regional & Local Player Dynamics
- 6.2 Asia Pacific Table Tennis (Ping-Pong) Market Share Analysis – 2024
- 6.2.1 Global Revenue Share by Company
- 6.2.2 Global Volume Share by Company
- 6.2.3 Regional Revenue Share
- 6.2.4 Market Share Evolution ( vs. 2024)
- 6.2.5 OEM Segment Share by Company
- 6.2.6 Replacement Segment Share by Company
- 6.3 Production/Delivery Capacity & Facility Analysis
- 6.3.1 Global Installed Capacity
- 6.3.2 Capacity Utilization Rates
- 6.3.3 Production/Output Volume
- 6.3.4 Facility Locations & Capacity Map
- 6.3.5 Planned Capacity Additions
- 6.4 Asia Pacific Table Tennis (Ping-Pong) Competitive Benchmarking Matrix
- 6.4.1 Revenue, Volume, CAGR & Profitability Comparison
- 6.4.2 Channel Revenue Mix
- 6.4.3 Geographic Revenue Exposure
- 6.4.4 R&D Intensity
- 6.4.5 Sustainability Maturity
- 6.5 Strategic Developments in Asia Pacific Table Tennis (Ping-Pong) (Last 24 Months)
- 6.5.1 Mergers, Acquisitions & Divestments
- 6.5.2 New Asia Pacific Table Tennis (Ping-Pong) Launches
- 6.5.3 Facility Expansions
- 6.5.4 Strategic Alliances, Joint Ventures & Partnerships
- 6.5.5 Distribution Expansion & Market Entry
- 6.5.6 Sustainability & ESG Initiatives
- 6.6 Competitive Strategy Mapping
- 6.6.1 Leader, Challenger, Follower & Niche Classification
- 6.6.2 Pricing Strategy Comparison
- 6.6.3 Channel Strategy Matrix
Note: Strategic developments are included based on their materiality and the availability of reliable information.
Chapter 7. Global Asia Pacific Table Tennis (Ping-Pong) Market – By Distribution Channel
- 7.1 Segment Overview
- 7.1.1 Volume & Revenue Split by Channel (2024 & 2032)
- 7.1.2 Channel Mix Evolution (2024-2032)
Chapter 8. Regional Market Analysis – Global Overview
- 8.1 Global Regional Overview
- 8.1.1 Regional Volume Share
- 8.1.2 Regional Revenue Share
- 8.1.3 Regional Volume by Region
- 8.1.4 Regional Revenue by Region
- 8.1.5 Regional Forecast Through 2032
- 8.2 Cross-Regional Segment Analysis
- 8.2.1 By Distribution Channel
- 8.2.2 By Brand/Price Tier
Chapter 9. North America Asia Pacific Table Tennis (Ping-Pong) Market
- 9.1 United States
- 9.2 Canada
- 9.3 Mexico
Chapter 10. Europe Asia Pacific Table Tennis (Ping-Pong) Market
- 10.1 Germany
- 10.2 France
- 10.3 Italy
- 10.4 United Kingdom
- 10.5 Spain
- 10.6 Poland
- 10.7 Russia
- 10.8 Netherlands
- 10.9 Belgium
- 10.10 Sweden
- 10.11 Denmark
- 10.12 Norway
- 10.13 Rest of Europe
Chapter 11. Asia Pacific Asia Pacific Table Tennis (Ping-Pong) Market
- 11.1 China
- 11.2 India
- 11.3 Japan
- 11.4 South Korea
- 11.5 Thailand
- 11.6 Indonesia
- 11.7 Vietnam
- 11.8 Malaysia
- 11.9 Australia
- 11.10 Rest of Asia Pacific
Chapter 12. Latin America Asia Pacific Table Tennis (Ping-Pong) Market
- 12.1 Brazil
- 12.2 Argentina
- 12.3 Colombia
- 12.4 Chile
- 12.5 Rest of Latin America
Chapter 13. Middle East Asia Pacific Table Tennis (Ping-Pong) Market
- 13.1 Saudi Arabia
- 13.2 United Arab Emirates
- 13.3 Turkey
- 13.4 Israel
- 13.5 Iran
- 13.6 Rest of the Middle East
Chapter 14. Africa Asia Pacific Table Tennis (Ping-Pong) Market
- 14.1 South Africa
- 14.2 Egypt
- 14.3 Nigeria
- 14.4 Morocco
- 14.5 Rest of Africa
Chapter 15. Asia Pacific Table Tennis (Ping-Pong) Company Profiles
- 15.1 [Company 01]
- 15.1.1 Company Overview
- 15.1.2 Key Management Personnel
- 15.1.3 Products & Services Portfolio
- 15.1.4 Financial Performance
- 15.1.5 Key Market Focus & Geographic Presence
- 15.1.6 Recent Developments & Strategic Initiatives
Note: The company profile list is preliminary and may change based on research findings, market developments, data availability, and client requirements.
Chapter 16. Appendices
- Appendix A – List of Abbreviations & Acronyms
- Appendix B – Industry Classification Code Reference – Full Series
- Appendix C – Production & Capacity Data Tables
- Appendix D – End-Use & Demand Base Tables
- Appendix E – Consumption & Replacement Rate Assumptions
- Appendix F – ASP Reference Tables
- Appendix G – Manufacturing & Facility Database
- Appendix H – Import-Export Data Tables
- Appendix I – Regulatory Summary Tables
- Appendix J – Primary Research Participant List (Anonymized)
- Appendix K – Primary Research Questionnaire Framework
- Appendix L – Data Sources & Bibliography
- Appendix M – Market Size Divergence & Source Comparison
Chapter 17. Research Methodology
- 17.1 Research Framework & Philosophy
- 17.2 Secondary Research – Sources, Hierarchy & Data Extraction
- 17.3 Data Modeling – Bottom-Up & Top-Down Market Sizing
- 17.4 Primary Research – Stakeholder Framework, LOI & Sample Sizes
- 17.5 Forecast Methodology – Regression, Scenario & Sensitivity Analysis
- 17.6 Quality Control – Four-Layer Validation Framework
- 17.7 Limitations & Standard Assumptions
- 17.8 Disclaimer
