
Market Overview
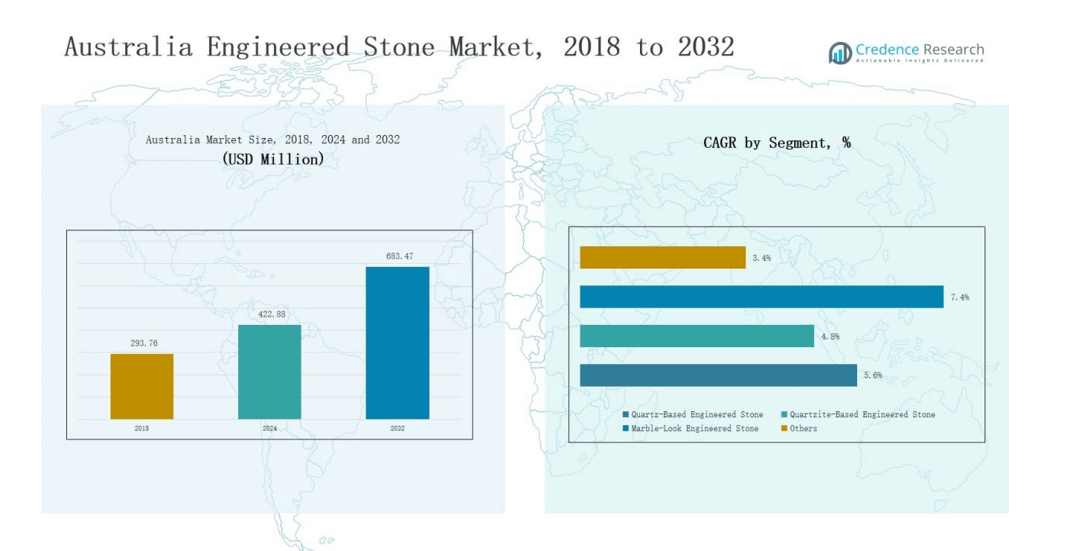
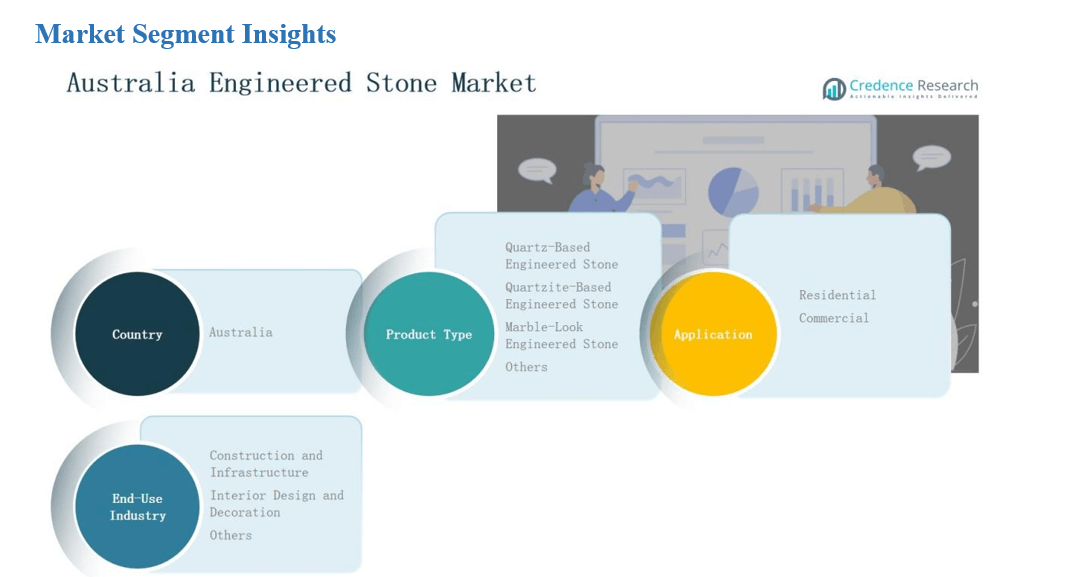
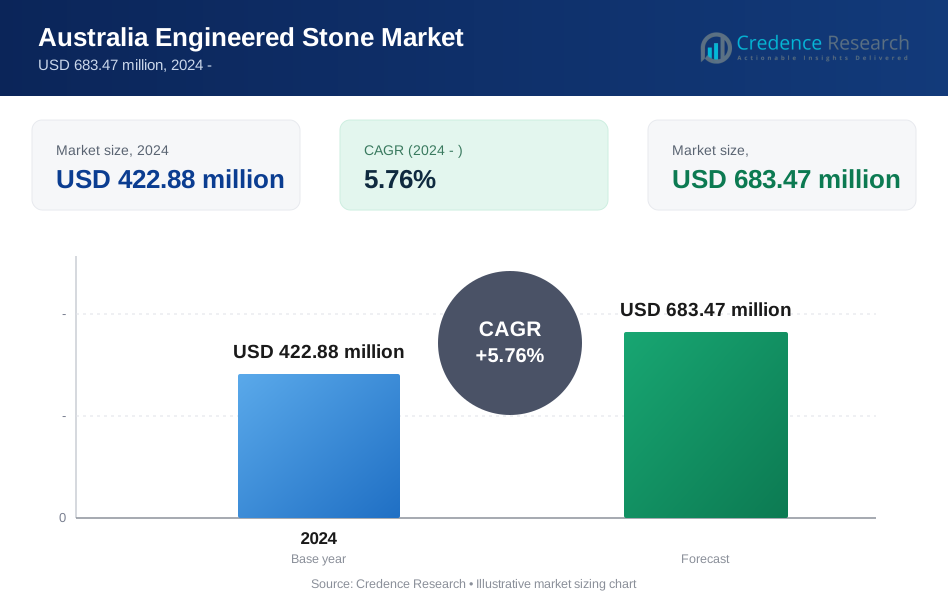
Australia Engineered Stone Market size was valued at USD 293.76 million in 2018, reached USD 422.88 million in 2024, and is anticipated to reach USD 683.47 million by 2032, growing at a CAGR of 5.76% during the forecast period.
| REPORT ATTRIBUTE | DETAILS |
|---|---|
| Historical Period | 2020-2023 |
| Base Year | 2024 |
| Forecast Period | 2025-2032 |
| Australia Engineered Stone Market Size 2024 | USD 422.88 million |
| Australia Engineered Stone Market, CAGR | 5.76% |
| Australia Engineered Stone Market Size 2032 | USD 683.47 million |
The Australia Engineered Stone Market is shaped by the presence of prominent players such as Caesarstone, Cosentino, Smartstone, Silestone, Quantum, Hanstone Quartz Australia, WK Marble & Granite, Essa Stone, Laminex Australia, and Lapitec Australia. These companies compete through product innovation, sustainability initiatives, and strong partnerships with distributors, contractors, and interior designers. Caesarstone and Cosentino maintain strong brand recognition, while domestic firms like WK Marble & Granite and Laminex Australia cater to localized demand with tailored offerings. Regionally, New South Wales led the market with 32% share in 2024, supported by robust housing activity, luxury residential projects, and large-scale commercial developments that continue to drive strong adoption of engineered stone surfaces.
Market Insights
- The Australia Engineered Stone Market grew from USD 293.76 million in 2018 to USD 422.88 million in 2024 and is forecast to reach USD 683.47 million by 2032, expanding at 5.76% CAGR.
- Quartz-based engineered stone held 54.2% share in 2024, favored for durability, low maintenance, and wide design options, while marble-look and quartzite variants gained traction in premium interiors.
- Residential applications led with 63.5% share in 2024, driven by housing projects, renovations, and demand for stylish, long-lasting surfaces, while commercial projects steadily expanded adoption in offices, retail, and hospitality.
- Construction and infrastructure dominated with 58.7% share in 2024, supported by urbanization and large-scale housing developments, while interior design and decoration added growth through customized finishes and high-end aesthetics.
- New South Wales led with 32% share in 2024, followed by Victoria at 27%, Queensland at 18%, Western Australia at 15%, and other regions contributing 8% collectively.
Market Segment Insights
By Product Type
Quartz-based engineered stone dominated the Australian market in 2024, accounting for 54.2% share. Its popularity stems from durability, low maintenance, and wide design options that appeal to both homeowners and commercial projects. Quartzite-based products followed with rising demand in premium interiors, while marble-look variants gained traction for luxury aesthetics. Other engineered stone types, including innovative blends and recycled materials, held niche appeal. Continuous innovation in textures and finishes supports growth across product categories, strengthening overall market adoption.
- For instance, Caesarstone introduced its Pebbles Collection with organic, nature-inspired quartz designs, reflecting consumer interest in subtle, sustainable finishes.
By Application
The residential segment led the market with 63.5% share in 2024, driven by growing use in kitchen countertops, bathroom vanities, and flooring. Rising housing projects, urban renovations, and consumer preference for durable yet stylish surfaces reinforced this dominance. The commercial segment, holding the remaining share, is steadily expanding with engineered stone increasingly specified in office complexes, hospitality, and retail spaces. Its strong appeal lies in offering long-lasting, visually appealing surfaces that meet modern architectural needs while reducing maintenance costs for property owners.
- For instance, Cosentino launched new Silestone designs with HybriQ+ technology, which use sustainable manufacturing processes while enhancing bathroom and countertop aesthetics.
By End-Use Industry
Construction and infrastructure accounted for 58.7% share in 2024, supported by large-scale housing developments and ongoing urbanization across Australia. Engineered stone’s strength, design versatility, and eco-friendly profile make it the preferred choice for flooring, wall cladding, and countertops in new builds. The interior design and decoration segment captured a significant share, driven by demand for customized finishes and high-end aesthetics. Other industries, including small-scale decorative applications, remain niche but show potential as design innovations and sustainable material adoption continue to rise.
Market Overview
Rising Demand from Residential Construction
The residential construction boom across Australia strongly fuels the demand for engineered stone. Growing urbanization, housing renovations, and preference for stylish yet durable surfaces such as kitchen countertops and bathroom vanities drive adoption. Consumers increasingly choose quartz-based engineered stone for its low maintenance, resistance to stains, and long product life. The availability of diverse colors and textures further enhances its appeal, positioning residential projects as the leading revenue contributor and sustaining strong growth momentum in the market.
- For instance, Quantum Quartz manufactures slabs made from over 93% natural quartz, ensuring strong resistance to scratches, stains, and heat, making them a popular choice for kitchen and vanity surfaces.
Expansion of Commercial Infrastructure
Rapid expansion of commercial spaces including offices, hotels, and retail outlets is boosting engineered stone consumption. Developers prefer engineered stone over natural alternatives due to its cost-effectiveness, consistency in quality, and superior strength. Its ability to meet modern architectural requirements while reducing long-term maintenance costs makes it the material of choice. The hospitality and corporate sectors particularly favor marble-look engineered stone for premium interiors, adding significant demand across large projects and driving overall market penetration in commercial applications.
Growing Focus on Sustainability
Sustainability has become a critical growth driver in Australia’s engineered stone market. Rising awareness of eco-friendly materials and strict government policies are encouraging manufacturers to innovate with recycled and low-emission stone products. Consumers are also shifting toward sustainable design choices in both residential and commercial projects. This preference boosts demand for engineered stone as it offers durability and reusability, reducing environmental impact compared to natural stone extraction. Manufacturers leveraging green certifications and energy-efficient production further enhance their competitive edge.
- FOr instance, Cosentino expanded its Silestone HybriQ+ technology series, manufactured with 99% reused water and 20% recycled raw materials, offering a sustainable alternative that appeals to eco-conscious architects and builders.
Key Trends & Opportunities
Rising Adoption of Marble-Look Variants
A notable trend shaping the market is the growing demand for marble-look engineered stone. These products provide the luxury appeal of natural marble while offering greater durability and affordability. Architects and designers increasingly recommend these surfaces for upscale residential and commercial interiors, driving higher adoption. The ability to replicate natural stone aesthetics with consistent quality and lower maintenance requirements positions marble-look engineered stone as a major growth opportunity, especially within Australia’s premium housing and hospitality segments.
- For instance, Caesarstone introduced its Empira White surface as part of its Supernatural Collection, designed to replicate the depth and veining of natural marble while offering improved stain resistance.
Technological Advancements in Design Innovation
Technological innovation is opening new opportunities in the engineered stone market. Advanced manufacturing techniques now allow producers to create stones with improved textures, patterns, and finishes that closely mimic natural stone. Integration of digital design tools enables customization to suit consumer preferences, increasing appeal among high-end clients. These advancements enhance design flexibility and open new applications in decorative and commercial projects. As technology adoption accelerates, companies investing in innovation are well-positioned to capture emerging demand in Australia.
- For instance, Cosentino introduced its Silestone Ethereal Collection using HybriQ+ technology, which reduces crystalline silica content while enhancing design versatility for modern interiors.
Key Challenges
Rising Health and Safety Concerns
One of the most significant challenges facing the market is health concerns linked to crystalline silica dust generated during cutting and processing of engineered stone. Regulatory authorities are tightening workplace safety standards, increasing compliance costs for manufacturers and fabricators. Stricter enforcement and potential restrictions pose risks to supply chains, raising operational challenges. Industry players must adopt advanced dust-control technologies and safer production methods to mitigate risks while ensuring compliance with occupational health regulations.
Intense Competitive Pressure
The market faces strong competition among domestic producers and international brands operating in Australia. Price sensitivity in both residential and commercial segments intensifies pressure on manufacturers to balance affordability with product quality. Differentiation is increasingly difficult as most players offer similar quartz-based products. Companies must invest in branding, innovation, and sustainable solutions to stand out in this crowded landscape. Without clear differentiation, profitability may remain under strain, especially for smaller players competing against established global leaders.
Volatility in Raw Material Prices
Fluctuations in the cost of raw materials, particularly quartz and resin, present another challenge for market participants. Global supply chain disruptions and energy cost variations directly affect production expenses. Such volatility makes pricing strategies complex, impacting margins and long-term contracts with clients. Manufacturers must secure stable sourcing agreements, explore alternative materials, and adopt efficient manufacturing practices to manage risks. Failure to address these cost challenges could limit growth opportunities and weaken competitiveness in the Australian market.
Regional Analysis
New South Wales
New South Wales accounted for 32% share in 2024, leading the Australia Engineered Stone Market due to its strong construction activity and urban housing projects. Sydney remains a hub for luxury residential and high-rise developments, fueling demand for quartz and marble-look variants. Growing investments in commercial infrastructure, including office towers and retail complexes, also reinforce the region’s dominance. It benefits from a well-established distribution network and strong presence of domestic suppliers. Rising renovation trends further support sustained market expansion.
Victoria
Victoria captured 27% share in 2024, driven by robust growth in residential and commercial construction. Melbourne’s expanding urban infrastructure and strong consumer preference for stylish, durable surfaces boost market adoption. The state’s demand for engineered stone is reinforced by premium housing projects and rising renovation activities. Developers increasingly select engineered stone for its durability and aesthetic flexibility in both residential and corporate projects. It also benefits from strong demand in interior design applications, especially in high-density housing sectors.
Queensland
Queensland held 18% share in 2024, supported by growing residential projects and rising preference for engineered stone in suburban housing developments. Brisbane and the Gold Coast recorded higher adoption in luxury homes and commercial spaces, particularly in the hospitality sector. The state benefits from ongoing tourism-related investments, which support demand in hotels and resorts. Interior designers favor marble-look variants for upscale projects, driving growth in decorative applications. It continues to expand with increasing consumer awareness of premium surfaces.
Western Australia
Western Australia secured 15% share in 2024, largely influenced by rising demand in residential construction and renovation projects. Perth’s urban development and government initiatives for housing expansions supported steady consumption of engineered stone. The region shows strong interest in quartz-based products due to their durability and lower maintenance. Growing interior design applications, especially in kitchens and bathrooms, contribute to higher market uptake. It remains an attractive growth market due to expanding distribution channels and rising consumer preference for sustainable options.
Other Regions
Other Australian regions collectively represented 8% share in 2024, reflecting steady demand from smaller states and territories. Tasmania, South Australia, and the Northern Territory exhibit rising consumption in residential projects and niche commercial applications. Demand is primarily driven by renovations, lifestyle improvements, and the availability of cost-effective engineered stone products. Smaller markets show potential for gradual growth with expanding awareness and distribution networks. It maintains relevance as manufacturers target regional demand through localized supply chains and tailored solutions.
Market Segmentations:
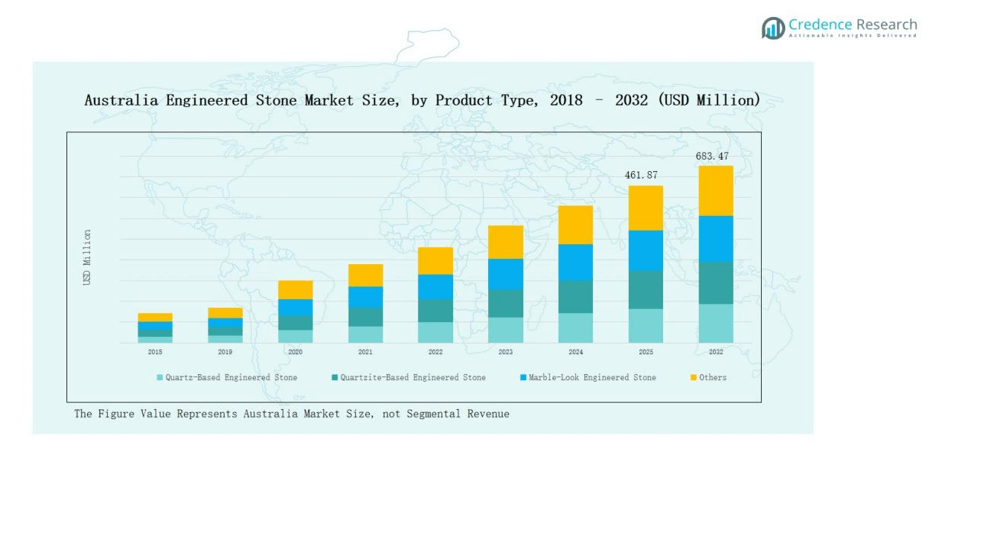
By Product Type
- Quartz-Based Engineered Stone
- Quartzite-Based Engineered Stone
- Marble-Look Engineered Stone
- Others
By Application
- Residential
- Commercial
By End-Use Industry
- Construction and Infrastructure
- Interior Design and Decoration
- Others
By Region
- New South Wales
- Victoria
- Queensland
- Western Austarlia
- Other Regions
Competitive Landscape
The Australia Engineered Stone Market is highly competitive, with both international brands and domestic manufacturers establishing a strong presence. Leading companies such as Caesarstone, Cosentino, Smartstone, Silestone, and Quantum dominate the landscape with wide product portfolios, strong distribution networks, and extensive brand recognition. Domestic players including Hanstone Quartz Australia, WK Marble & Granite, Essa Stone, Laminex Australia, and Lapitec Australia further strengthen market diversity by catering to localized demand and design preferences. Competition centers on product innovation, durability, and design versatility, with quartz-based and marble-look engineered stone remaining key focus areas. Sustainability and compliance with stricter health and safety regulations, particularly around crystalline silica management, are emerging as critical differentiators. Companies are investing in eco-friendly production processes and recycled content to align with government policies and consumer expectations. Strategic partnerships with builders, interior designers, and distributors continue to play a vital role in sustaining growth and improving market share.
Key Players
- Caesarstone
- Cosentino
- Smartstone
- Silestone
- Quantum
- Hanstone Quartz Australia
- WK Marble & Granite
- Essa Stone
- Laminex Australia
- Lapitec Australia
Recent Developments
- In July 2024, Caesarstone Australia launched its Caesarstone Mineral™ Crystalline Silica-Free surfaces as a replacement for traditional engineered stone.
- In July 2024, Safe Work Australia and WHS regulators enforced a ban on the manufacture, supply, processing, and installation of engineered stone benchtops, panels, and slabs.
- In May 2024, Granite Transformations (Sydney South) unveiled Zero Crystalline Silica as a safer alternative, offering similar aesthetics but under the 1 % silica threshold.
Report Coverage
The research report offers an in-depth analysis based on Product Type, Application, End-Use Industry and Region. It details leading market players, providing an overview of their business, product offerings, investments, revenue streams, and key applications. Additionally, the report includes insights into the competitive environment, SWOT analysis, current market trends, as well as the primary drivers and constraints. Furthermore, it discusses various factors that have driven market expansion in recent years. The report also explores market dynamics, regulatory scenarios, and technological advancements that are shaping the industry. It assesses the impact of external factors and global economic changes on market growth. Lastly, it provides strategic recommendations for new entrants and established companies to navigate the complexities of the market.
Future Outlook
- Demand for quartz-based engineered stone will continue to dominate residential and commercial projects.
- Marble-look engineered stone will gain stronger traction in premium housing and hospitality sectors.
- Residential renovations will remain a primary driver of product consumption across urban regions.
- Commercial infrastructure projects will increasingly specify engineered stone for durability and aesthetics.
- Sustainability and eco-friendly product innovations will shape consumer preferences and industry standards.
- Compliance with stricter health and safety regulations will influence production and supply strategies.
- Regional players will expand through partnerships with builders, contractors, and interior designers.
- Technological advancements in design and finishing will enhance customization and product appeal.
- Distribution networks will expand into smaller states and territories, strengthening market penetration.
- Competitive differentiation will rely on brand reputation, innovation, and value-added services.
Request a Free Sample
Fill in your details and we'll send you a free sample report.
- Sample data tables & charts
- Research methodology
Need a Custom Version of This Report?
Tailor the scope, geography, or segments to your exact requirements.
- Custom geography or segment scope
- Direct access to our analyst team
Frequently Asked Questions
What is the current market size for Australia Engineered Stone Market, and what is its projected size in 2032?
At what Compound Annual Growth Rate is the Australia Engineered Stone Market projected to grow between 2025 and 2032?
Which Australia Engineered Stone Market segment held the largest share in 2024?
What are the primary factors fueling the growth of the Australia Engineered Stone Market?
Who are the leading companies in the Australia Engineered Stone Market?
Table of Content
Chapter 1. Report Introduction
- 1.1 Report Description & Purpose
- 1.1.1 Report Title & Market Definition
- 1.1.2 Unique Selling Propositions (USP) & Key Differentiators
- 1.1.3 Value Proposition for Stakeholders
- 1.2 Research Objectives
- 1.2.1 Market Sizing Objectives (Volume & Revenue)
- 1.2.2 Segmentation Objectives
- 1.2.3 Competitive Intelligence Objectives
- 1.2.4 Forecast & Scenario Objectives
- 1.3 Report Scope
- 1.3.1 Australia Engineered Stone Scope – Types & Subtypes Covered
- 1.3.2 Geographic Scope – Regions & Countries Covered
- 1.3.3 Historical Period, Base Year & Forecast Period (2024; forecast to the forecast period)
- 1.3.4 Inclusions & Exclusions
- 1.4 HS Code & Classification Framework
- 1.5 Currency, Units & Pricing Basis
- 1.6 Target Stakeholders
- 1.7 Limitations & Assumptions
Chapter 2. Executive Summary
- 2.1 Global Australia Engineered Stone Market Snapshot
- 2.1.1 Market Size – Historical (2024) & Forecast (the forecast period) (2024: USD 422.88 million → forecast year: USD 683.47 million)
- 2.1.2 Volume & Revenue – Global Totals
- 2.1.3 Key Market Highlights – Top Five Facts
- 2.2 Australia Engineered Stone Market Segmentation Snapshot
- 2.2.1 Market Split by Region – 2024 vs.
- 2.3 Competitive Snapshot
- 2.3.1 Top 10 Players by Revenue Share – 2024
- 2.3.2 Top 10 Players by Volume Share – 2024
- 2.3.3 Recent Strategic Developments (18-Month Summary)
- 2.4 Key Investment Highlights & Strategic Conclusions
Chapter 3. Australia Engineered Stone Market Dynamics & Industry Analysis
- 3.1 Market Overview & Context
- 3.1.1 Australia Engineered Stone Market Position in the Broader Automotive Value Chain
- 3.1.2 OEM vs. Replacement Market Dynamics
- 3.1.3 Market Maturity & Development Stage by Region
- 3.2 Australia Engineered Stone Market Drivers
- 3.3 Australia Engineered Stone Market Restraints & Challenges
- 3.4 Australia Engineered Stone Market Opportunities
- 3.5 Porter's Five Forces Analysis
- 3.5.1 Threat of New Entrants
- 3.5.2 Bargaining Power of Suppliers
- 3.5.3 Bargaining Power of Buyers
- 3.5.4 Threat of Substitutes
- 3.5.5 Competitive Rivalry – Intensity Assessment
- 3.6 Australia Engineered Stone Value Chain Analysis
- 3.6.1 Upstream – Raw Material/Input Suppliers
- 3.6.1.1 Raw Material/Input 1
- 3.6.1.2 Raw Material/Input 2
- 3.6.1.3 Raw Material/Input 3
- 3.6.2 Midstream – Production/Manufacturing/Service Delivery
- 3.6.2.1 Production/Process Overview
- 3.6.2.2 Key Facility Locations & Capacity by Manufacturer
- 3.6.3 Downstream – Distribution & End Consumer
- 3.6.3.1 Primary Channel – B2B/OEM
- 3.6.3.2 Secondary Channels – Dealer, Retail, Online, Direct
- 3.6.4 Value Chain Profitability Analysis
- 3.6.1 Upstream – Raw Material/Input Suppliers
- 3.7 PESTEL Analysis
- 3.7.1 Political Factors
- 3.7.2 Economic Factors
- 3.7.3 Social Factors
- 3.7.4 Technological Factors
- 3.7.5 Environmental Factors
- 3.7.6 Legal Factors
- 3.8 Australia Engineered Stone Supply Chain Analysis
- 3.8.1 Raw Material/Input Supply Risk Assessment
- 3.8.2 Manufacturing Concentration Risk (Geographic Exposure)
- 3.8.3 Trade Disruption Impact Analysis
- 3.9 Regulatory & Policy Landscape
Note: The regulatory and policy landscape section covers regulations based on their applicability to the market, Australia Engineered Stone category, geography, and scope of the study. Only regulatory frameworks with a material impact on operations, compliance, trade, sustainability, or market access are analyzed in detail.
Chapter 4. Key Investment Pockets & Opportunity Analysis
- 4.1 Australia Engineered Stone Market Attractiveness Analysis
- 4.1.1 By Region – Investment Attractiveness Matrix (Volume × CAGR)
- 4.2 Absolute Revenue Growth Opportunity
- 4.2.1 By Region – Absolute USD Growth Through the forecast period
- 4.3 Incremental Volume Opportunity
- 4.3.1 By Region – Incremental Volume Through the forecast period
- 4.3.2 Segment – Incremental Volume
- 4.4 Emerging Submarket Opportunity Deep Dive (Subject to Applicability)
- 4.5 Emerging Market Opportunity Scorecards
- 4.5.1 United States
- 4.5.2 Europe
- 4.5.3 Asia
- 4.5.4 Middle East & Africa
Note: Emerging Market Opportunity Scorecards will be included based on relevance and strategic importance. Regions listed are indicative and may vary depending on data availability and market dynamics.
Chapter 5. Australia Engineered Stone Import-Export Analysis & Trade Flows
- 5.1 Global Trade Overview
- 5.1.1 Global Export Value by Country (2024)
- 5.1.2 Global Export Volume by Country (2024)
- 5.1.3 Global Import Value by Country (2024)
- 5.1.4 Global Import Volume by Country (2024)
- 5.1.5 Net Trade Balance by Country (2024)
- 5.2 Export Analysis – Segment
- 5.2.1 Type 1 (HS Code)
- 5.2.2 Type 2 (HS Code)
- 5.2.3 Type 3 (HS Code)
- 5.2.4 Type 4 (HS Code)
- 5.2.5 Type 5 (HS Code)
- 5.3 Import Analysis – Segment
- 5.3.1 Type 1 (HS Code)
- 5.3.2 Type 2 (HS Code)
- 5.3.3 Type 3 (HS Code)
- 5.3.4 Type 4 (HS Code)
- 5.3.5 Type 5 (HS Code)
- 5.4 Average Unit Trade Prices
- 5.4.1 Average Export Price – Segment & Country
- 5.4.2 Average Import Price – Segment & Source Country
- 5.4.3 Price Trends (2024)
- 5.5 Key Trade Route Analysis
- 5.5.1 Trade Route 1
- 5.5.2 Trade Route 2
- 5.5.3 Trade Route 3
- 5.5.4 Trade Route 4
- 5.5.5 Trade Route 5
- 5.6 Trade Policy Impact Assessment
- 5.6.1 US Anti-Dumping & Section 301 Tariffs
- 5.6.2 EU Customs Union Impact
- 5.6.3 Major Free Trade Agreements
- 5.6.4 USMCA Rules of Origin
Note: Trade policy analysis will be included only where relevant to the Australia Engineered Stone market.
Chapter 6. Competitive Landscape & Company Benchmarking
- 6.1 Australia Engineered Stone Market Concentration & Structure
- 6.1.1 Herfindahl-Hirschman Index (HHI) – vs. 2024
- 6.1.2 Tier 1, Tier 2 & Tier 3 Market Structure
- 6.1.3 Global, Regional & Local Player Dynamics
- 6.2 Australia Engineered Stone Market Share Analysis – 2024
- 6.2.1 Global Revenue Share by Company
- 6.2.2 Global Volume Share by Company
- 6.2.3 Regional Revenue Share
- 6.2.4 Market Share Evolution ( vs. 2024)
- 6.2.5 OEM Segment Share by Company
- 6.2.6 Replacement Segment Share by Company
- 6.3 Production/Delivery Capacity & Facility Analysis
- 6.3.1 Global Installed Capacity
- 6.3.2 Capacity Utilization Rates
- 6.3.3 Production/Output Volume
- 6.3.4 Facility Locations & Capacity Map
- 6.3.5 Planned Capacity Additions
- 6.4 Australia Engineered Stone Competitive Benchmarking Matrix
- 6.4.1 Revenue, Volume, CAGR & Profitability Comparison
- 6.4.2 Channel Revenue Mix
- 6.4.3 Geographic Revenue Exposure
- 6.4.4 R&D Intensity
- 6.4.5 Sustainability Maturity
- 6.5 Strategic Developments in Australia Engineered Stone (Last 24 Months)
- 6.5.1 Mergers, Acquisitions & Divestments
- 6.5.2 New Australia Engineered Stone Launches
- 6.5.3 Facility Expansions
- 6.5.4 Strategic Alliances, Joint Ventures & Partnerships
- 6.5.5 Distribution Expansion & Market Entry
- 6.5.6 Sustainability & ESG Initiatives
- 6.6 Competitive Strategy Mapping
- 6.6.1 Leader, Challenger, Follower & Niche Classification
- 6.6.2 Pricing Strategy Comparison
- 6.6.3 Channel Strategy Matrix
Note: Strategic developments are included based on their materiality and the availability of reliable information.
Chapter 7. Global Australia Engineered Stone Market – By Distribution Channel
- 7.1 Segment Overview
- 7.1.1 Volume & Revenue Split by Channel (2024 & )
- 7.1.2 Channel Mix Evolution (the forecast period)
Chapter 8. Regional Market Analysis – Global Overview
- 8.1 Global Regional Overview
- 8.1.1 Regional Volume Share
- 8.1.2 Regional Revenue Share
- 8.1.3 Regional Volume by Region
- 8.1.4 Regional Revenue by Region
- 8.1.5 Regional Forecast Through the forecast period
- 8.2 Cross-Regional Segment Analysis
- 8.2.1 By Distribution Channel
- 8.2.2 By Brand/Price Tier
Chapter 9. North America Australia Engineered Stone Market
- 9.1 United States
- 9.2 Canada
- 9.3 Mexico
Chapter 10. Europe Australia Engineered Stone Market
- 10.1 Germany
- 10.2 France
- 10.3 Italy
- 10.4 United Kingdom
- 10.5 Spain
- 10.6 Poland
- 10.7 Russia
- 10.8 Netherlands
- 10.9 Belgium
- 10.10 Sweden
- 10.11 Denmark
- 10.12 Norway
- 10.13 Rest of Europe
Chapter 11. Asia Pacific Australia Engineered Stone Market
- 11.1 China
- 11.2 India
- 11.3 Japan
- 11.4 South Korea
- 11.5 Thailand
- 11.6 Indonesia
- 11.7 Vietnam
- 11.8 Malaysia
- 11.9 Australia
- 11.10 Rest of Asia Pacific
Chapter 12. Latin America Australia Engineered Stone Market
- 12.1 Brazil
- 12.2 Argentina
- 12.3 Colombia
- 12.4 Chile
- 12.5 Rest of Latin America
Chapter 13. Middle East Australia Engineered Stone Market
- 13.1 Saudi Arabia
- 13.2 United Arab Emirates
- 13.3 Turkey
- 13.4 Israel
- 13.5 Iran
- 13.6 Rest of the Middle East
Chapter 14. Africa Australia Engineered Stone Market
- 14.1 South Africa
- 14.2 Egypt
- 14.3 Nigeria
- 14.4 Morocco
- 14.5 Rest of Africa
Chapter 15. Australia Engineered Stone Company Profiles
- 15.1 [Company 01]
- 15.1.1 Company Overview
- 15.1.2 Key Management Personnel
- 15.1.3 Products & Services Portfolio
- 15.1.4 Financial Performance
- 15.1.5 Key Market Focus & Geographic Presence
- 15.1.6 Recent Developments & Strategic Initiatives
Note: The company profile list is preliminary and may change based on research findings, market developments, data availability, and client requirements.
Chapter 16. Appendices
- Appendix A – List of Abbreviations & Acronyms
- Appendix B – Industry Classification Code Reference – Full Series
- Appendix C – Production & Capacity Data Tables
- Appendix D – End-Use & Demand Base Tables
- Appendix E – Consumption & Replacement Rate Assumptions
- Appendix F – ASP Reference Tables
- Appendix G – Manufacturing & Facility Database
- Appendix H – Import-Export Data Tables
- Appendix I – Regulatory Summary Tables
- Appendix J – Primary Research Participant List (Anonymized)
- Appendix K – Primary Research Questionnaire Framework
- Appendix L – Data Sources & Bibliography
- Appendix M – Market Size Divergence & Source Comparison
Chapter 17. Research Methodology
- 17.1 Research Framework & Philosophy
- 17.2 Secondary Research – Sources, Hierarchy & Data Extraction
- 17.3 Data Modeling – Bottom-Up & Top-Down Market Sizing
- 17.4 Primary Research – Stakeholder Framework, LOI & Sample Sizes
- 17.5 Forecast Methodology – Regression, Scenario & Sensitivity Analysis
- 17.6 Quality Control – Four-Layer Validation Framework
- 17.7 Limitations & Standard Assumptions
- 17.8 Disclaimer
