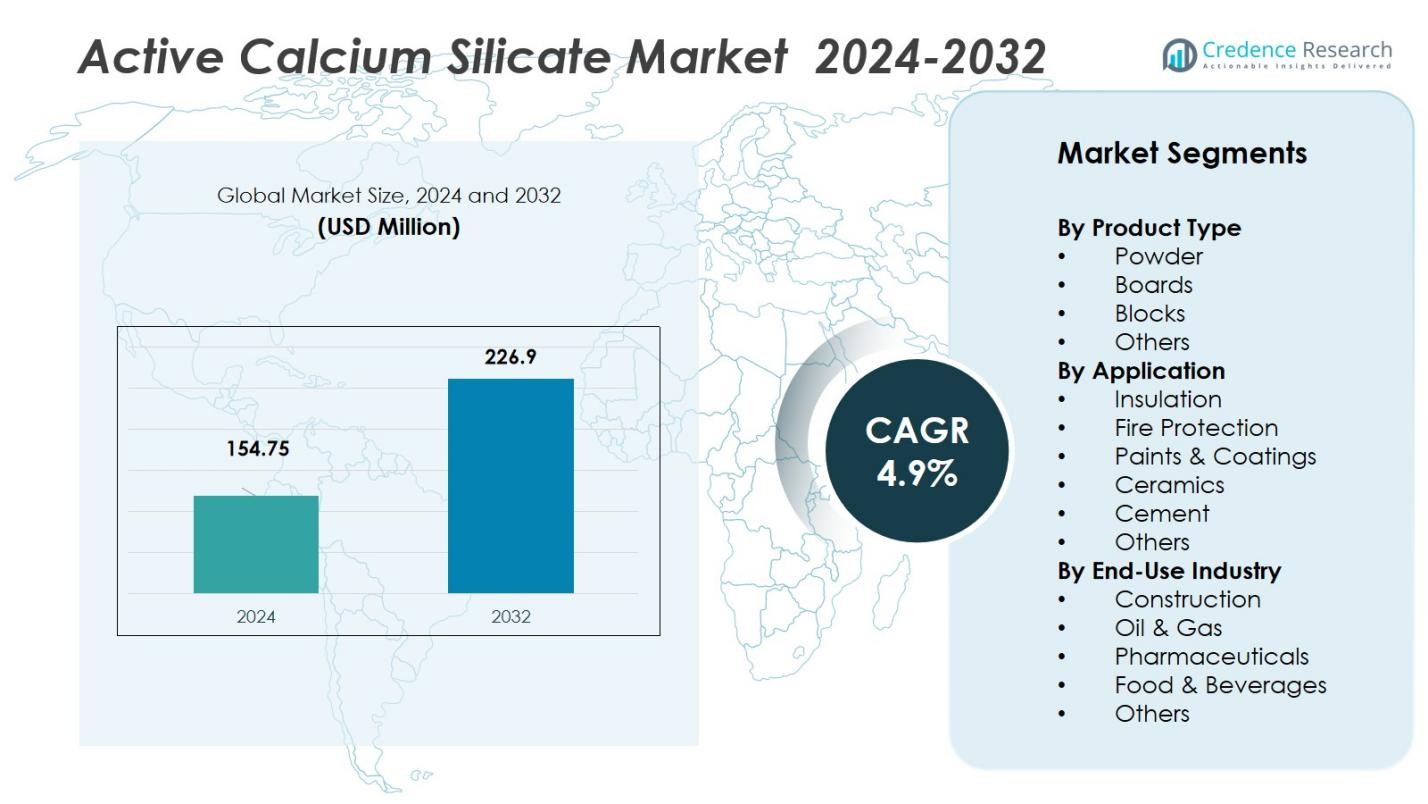
Home » Building & Construction » Active Calcium Silicate Market

Active Calcium Silicate Market By Application (Thermal Insulation, Fireproofing and Passive Fire Protection, Cement and Construction, Ceramics and Pottery, Paints and Coatings, Food and Pharmaceuticals, Others) By End-Use Industry (Industrial, Construction, Oil and Gas, Ceramics and Pottery, Automotive, Food and Beverage, Pharmaceuticals, Others)-Growth, Future Prospects & Competitive Analysis, 2016 – 2030

Price: $4699

Published: | Report ID: 22250 | Report Format : PDF

Market Insights

  • The global demand for Active Calcium Silicate was valued at USD 168.5million in 2022 and is expected to reach USD 260.5 Million in 2030, growing at a CAGR of 5.60% between 2023 and 2030.
  • During the projection period, the fireproofing and passive fire protection market is likely to grow at a rapid CAGR, and the ceramic industry is anticipated to have a sizable market share.
  • Over the projection period, the construction category is likely to lead the market, while the pharmaceutical section is expected to develop the fastest in the calcium silicate market.
  • In the next years, the blocks and boards category is expected to account for a substantial share of the market, and powder is another prominent component of the Active Calcium Silicate Market.
  • Asia Pacific is anticipated to develop at the fastest pace during the forecast period, while North America is projected to continue to lead the market with a 45% revenue share.
  • Rising Infrastructure Investments Will Aid Market Growth
  • The market’s growth is restrained by a lack of adoption in a price-sensitive market.

active calcium silicate market

Executive Summary

Market Definition

The active calcium silicate market refers to the market for a form of calcium silicate material that is utilized in a variety of applications such as insulation, fire prevention, and as a filler in construction materials. It is well-known for its strong temperature tolerance, low thermal conductivity, and capacity to absorb moisture. Rising demand for insulating materials and the need for fire-resistant materials are what are driving the market. However, considerations like as high manufacturing costs and the availability of alternatives may restrict its use. Despite these hurdles, possibilities exist in infrastructure development and the launch of novel goods, which will contribute to consistent market growth.

Design Element 2

Access crucial information at unmatched prices!

Request your free sample report today & start making informed decisions powered by Credence Research!

Download Free Sample

CTA Design Element 3

Market Overview

It is anticipated that between 2023 and 2030, the worldwide Active Calcium Silicate Market will expand at a compound annual growth rate (CAGR) of 5.60%. From USD 168.5 million in 2022, the market is projected to be worth USD 260.5 million by 2030.

The active calcium silicate market is expanding rapidly as a result of numerous factors. The rising need for insulating materials in sectors including construction, oil and gas, and power generation is one of the main motivators. Active calcium silicate has high thermal insulation qualities, making it a popular choice for applications needing heat resistance.

Another driver is the increased emphasis on fire safety standards and the necessity for fire-resistant products. Active calcium silicate is known for its fire-resistant qualities, making it appropriate for use in fire prevention systems and building materials.

However, there are some market constraints. The high production cost of active calcium silicate may limit its adoption, particularly in price-sensitive industries. Furthermore, the availability of alternative materials such as fibre glass and mineral wool may provide a hindrance to the active calcium silicate market’s growth.

Despite these obstacles, the market offers potential for expansion. Increased infrastructure development investments, particularly in emerging nations, create a demand for high-quality insulation materials such as active calcium silicate. Furthermore, the advancement of improved manufacturing methods and the introduction of novel goods might fuel market expansion.

Segmentation by Application

  • The strict regulations proposed by various governments for the usage of fire protection materials in residential, commercial, and industrial buildings are likely to drive the fireproofing and passive fire protection sector to expand at a sizable CAGR over the projection period.
  • During the projection period, the ceramic sector is expected to account for a significant share owing to increased demand for artificial ceilings and acoustic tiles.

  Segmentation by End-Users Industry

  • The construction category is expected to lead the market over the forecast period. The construction sector is the most essential because of the expanding urbanization.
  •  The pharmaceutical segment is growing the quickest in the calcium silicate market.

Segmentation by Product Form

  • The blocks and boards category is projected to account for a sizable portion of the industry in the coming years. The calcium silicate block has been shaped. Calcium silicate is available in a variety of thicknesses ranging from 1″ to 4-1/2″. The powder segment is expected to have a sizable revenue share.
  • Powder are another popular part of the Active Calcium Silicate Market

Segmentation by Region

  • North America dominated the market in 2022, with an 45% revenue share, and is predicted to grow rapidly over the forecast period.
  • Over the predicted period, Asia Pacific is expected to increase at the fastest rate.
  • The rest of the world, including Latin America, the Middle East, and Africa, supplies the remaining demand for Active Calcium Silicate.

Active calcium silicate regional (1)

Active calcium silicate demand in North America is increasing due to the region’s developing paints & coatings business. The market for active calcium silicate in the area is projected to increase due to the rising demand for paints & coatings in the home furnishings, automotive, and construction sectors. Demand for the product has increased as a result of growing consumer expenditure on luxurious interior dcor. Regional expansion will be fueled by the demand for eco-friendly paints that enhance texture, aesthetic appeal, and shelf life.

The Asia Pacific active calcium silicate market is predicted to grow at a rapid rate in the worldwide industry. This is becoming increasingly common as a result of greater government support for the construction of new residential structures as a result of population growth. For instance, China has already created a set of fire safety rules, ranging from policy-based fire suppression and reduction legislation to precise standards for fire safety structures and monitoring systems.

Key Highlights of the Report

The global Active Calcium Silicate Market is segmented by Application, End-Users Industry, Product Form, and region. Over the projection period, the construction category is expected to lead the market. In addition, the fireproofing and passive fire protection and pharmaceutical segments are predicted to increase at a rapid pace. Furthermore, the blocks and boards category is expected to account for a significant percentage of the business, with North America leading the market growth.

The primary drivers of the market include rising demand for insulation materials, a greater emphasis on fire safety standards, and technological developments in production processes. Furthermore, the market’s main limitations are high production costs, the availability of alternative materials, and limited acceptance in price-sensitive areas.

Nonetheless, The region’s expanding paints and coatings industry is driving up active calcium silicate demand in North America. Rising paint and coatings demand in the home furnishings, automotive, and construction industries is expected to drive up demand for active calcium silicate in the area. Furthermore, the Asia Pacific active calcium silicate market is expected to expand rapidly in the global sector.

 What Elements Are Driving the Global Market for Active Calcium Silicate?

The rising demand for insulating materials is one of the primary drivers of the Active Calcium Silicate Market. As industries such as building, oil and gas, and power generation expand, there is a growing demand for materials with strong thermal insulation capabilities. Another cause is the increased emphasis on fire safety requirements. Active calcium silicate is well-known for its fire-resistant qualities, making it a popular choice for applications requiring fire protection. Furthermore, technical developments in manufacturing processes have contributed to market expansion by enhancing the production efficiency and quality of active calcium silicate products.

What Are The Main Obstacles That The Global Active Calcium Silicate Market Faces?

There are some factors that may limit the growth of the Active Calcium Silicate Market. One of them is the high manufacturing costs of active calcium silicate. This may limit its adoption, particularly in price-sensitive countries where cost considerations are important. Another constraint is the lack of alternative materials. Fibre glass and mineral wool are two types of insulation that can be used instead of active calcium silicate. The existence of these substitutes can be a barrier to the expansion of the active calcium silicate market. Finally, low adoption in price-sensitive markets may impede market expansion.

What Market Development Prospects Are There For Active Calcium Silicate Globally?

The Active Calcium Silicate Market offers numerous growth potential. The continual expansion of infrastructure in emerging economies is a huge opportunity for the market. As emerging economies engage in new infrastructure, the demand for high-quality insulating materials such as active calcium silicate is increasing. Another possibility is the introduction of novel active calcium silicate compounds. The introduction of new and enhanced goods that offer improved performance and features can fuel market growth. Furthermore, as people become more conscious of the importance of energy efficiency and sustainability, there will be more opportunities for active calcium silicate, which is known for its energy-saving capabilities and environmental friendliness.

Market Drivers

The global Active Calcium Silicate Market is driven by several factors. The following are the key drivers of the global Active Calcium Silicate Market:

Rising Infrastructure Investments Will Help To Drive Market Expansion

The need for residential and commercial structures has expanded as a result of increased infrastructure development investments and population urbanization, which is expected to fuel market growth for construction calcium silicate. Because it efficiently insulates sound, has a high light density, and is resistant to water damage, it can be used to replace hazardous construction materials such as asbestos and phthalates. Over USD 10 trillion was spent on construction globally in 2018, which is projected to drive industry growth. Because they are lighter than fibre cement board, these materials are appropriate for roofing, brick, and floor tile applications. The expanding building and construction sector, as well as rising investment in infrastructure projects around the world, will drive demand for the product.

Expanding Pharmaceutical Business Is Driving Market Growth

The pharmaceuticals market has grown in size as a result of the enormous demand for healthcare services and therapeutic treatments caused by disease prevalence. Calcium silicate, a chemically stable component, is utilized as an additive in medical powders due to its capacity to allow free flow of ingredients during the manufacturing of medications since it absorbs moisture and surplus water. The addition of calcium silicate in pharmaceuticals aids in the treatment of weak bones and supports the development of healthy bones in children and women, which is expected to boost market growth. These materials are also used in the development of drug delivery systems because they enable a prolonged drug release period, considerably prolonging the therapeutic efficacy of medications.

Market Restraints

The global Active Calcium Silicate Market faces some challenges that may hinder its growth. These include the following:

Limited Adoption in Price-Sensitive Market

The low adoption of active calcium silicate in the Active Calcium Silicate Market might be attributed to its higher production costs when compared to alternative materials. Customers in price-sensitive markets prioritize cost considerations, and they prefer to choose lower-priced solutions even if they offer slightly lesser performance or features. This propensity for cost-effectiveness may impede the broad adoption of active calcium silicate in certain areas, hence limiting the market’s total growth.

Furthermore, to overcome this constraint, makers and suppliers of active calcium silicate may need to investigate cost-cutting measures or offer competitive pricing to make it more appealing to price-sensitive markets. They can also emphasize the long-term advantages and value proposition of active calcium silicate, such as its excellent thermal insulation and fire resistance.

Opportunities

The global Active Calcium Silicate Market offers significant growth opportunities. These include the following:

Rising Awareness of Energy Efficiency And Sustainability

The market for active calcium silicate is expanding as people become more concerned with sustainability and energy efficiency. As more people become aware of the environmental impact of their choices, there is a growing demand for materials that encourage energy efficiency and contribute to sustainable practices. Active calcium silicate, with its outstanding thermal insulating capabilities and fire resistance, is compatible with these goals. It provides energy savings by minimizing heat transfer and enhancing insulation in a variety of applications. Furthermore, active calcium silicate is a non-combustible substance, which increases safety and sustainability. The Active Calcium Silicate Market is positioned for expansion, driven by the demand for ecologically friendly and energy-efficient solutions.

Competitive Landscape

Active Calcium Silicate Market competitive (1)

Key Players

The global Active Calcium Silicate Market is highly competitive, with several key players. Some of the major players in the market and their market share are as follows:

  • American Elements
  • HIL Limited
  • Johns Manville
  • MLA Group of Industries
  • Promat International (Etex)
  • Ramco Industries Limited
  • Sibelco
  • Skamol Group
  • Weifang Hongyuan Chemical Co., Ltd.
  • Xella Group

These organizations prioritize Application innovation, Disease Area expansion, and mergers and acquisitions to stay competitive.

The global Active Calcium Silicate Market’s key players continually seek to stay ahead by offering new Applications and developments.

In May 2022, Ramco Industries has established a new manufacturing facility in Arakkonam. The firm claims a capacity of 11.5 million square meters for the “Calcium Silicate Board and Tiles Range,” which is distributed in over 15 countries. With this new location, they will be able to trade in over 40 countries across the world.

In August 2019, Johns Manville Industrial Insulation Group (IIG), a leading maker of building supplies and a Berkshire Hathaway company, would make Thermo-1200TM the first water-resistant calcium silicate available in North America. Thermo-12 Gold, Johns Manville Industrial Insulation Group’s current high-temperature calcium silicate product, will be replaced with this product, which will be available globally. Thermo-1200 is similar to Thermo-12 Gold in terms of thermal performance and corrosion resistance, but it also resists moisture.

In November 2019, Illinois Tool Works Inc. owns the company, which is well-known in the industrial sector for its high-quality, low-temperature polyisocyanurate foam insulations and metal jacketing solutions. Today, Johns Manville (JM), a Berkshire Hathaway firm and leading maker of building supplies, announced the acquisition of ITW Insulation Systems. The transaction is expected to close in early December.

Shape Your Report to Specific Countries or Regions & Enjoy 30% Off!

Summary of Key Findings

  • The expanding pharmaceutical industry is propelling market growth.
  • Market segmented by Application, End-Users Industry, Product Form,  and region
  • The fireproofing and passive fire protection segment is predicted to rise at a high CAGR during the forecast period
  • Over the projection period, the construction category is likely to lead the market
  • The Full-Face Masks sector typically holds the biggest market share.
  • North America is leading market growth; the market is highly competitive with key players including American Elements, HIL Limited, Johns Manville, MLA Group of Industries, Promat International (Etex), Ramco Industries Limited and Sibelco

Future Outlook

  • Insulation products are in high demand.
  • An increased emphasis on fire safety laws
  • Technological advances in manufacturing processes
  • Emerging economies driving infrastructure development
  • Launch of novel active calcium silicate products
  • Growing awareness of energy efficiency and sustainability
  • Expansion of end-use industries such as construction and oil & gas
  • Market development potential in developing regions

Segmentation

By Application:

  • Thermal Insulation
  • Fireproofing and Passive Fire Protection
  • Cement and Construction
  • Ceramics and Pottery
  • Paints and Coatingsx
  • Food and Pharmaceuticals
  • Others

By End-Use Industry:

  • Industrial
  • Construction
  • Oil and Gas
  • Ceramics and Pottery
  • Automotive
  • Food and Beverage
  • Pharmaceuticals
  • Others

By Product Form:

  • Powder
  • Blocks and Boards
  • By Region
    • North America
      • U.S
      • Canada
      • Mexico
    • Europe
      • Germany
      • France
      • U.K.
      • Italy
      • Spain
      • Rest of Europe
    • Asia Pacific
      • China
      • Japan
      • India
      • South Korea
      • South-east Asia
      • Rest of Asia Pacific
    • Latin America
      • Brazil
      • Argentina
      • Rest of Latin America
    • Middle East & Africa
      • GCC Countries
      • South Africa
      • Rest of Middle East and Africa

Adjacent Markets

In the Active Calcium Silicate Market, there are several adjacent markets which has high revenue growth opportunities. The key adjacent markets for Active Calcium Silicate Market-

Active Calcium Silicate Market adjacent market (1)

1. Preface

1.1. Report Description

1.1.1. Purpose of the Report

1.1.2. Target Audience

1.1.3. USP and Key Offerings

1.2. Research Scope

1.3. Market Introduction


2. Executive Summary

2.1. Market Snapshot: Global Active Calcium Silicate Market

2.1.1. Global Active Calcium Silicate Market, By Application

2.1.2. Global Active Calcium Silicate Market, By End-Use Industry

2.1.3. Global Active Calcium Silicate Market, By Product Form

2.1.4. Global Active Calcium Silicate Market, By Region

2.2. Insights from Primary Respondents


3. Market Dynamics & Factors Analysis

3.1. Introduction

3.1.1. Global Active Calcium Silicate Market Value, 2017-2030, (US$ Mn)

3.1.2. Y-o-Y Growth Trend Analysis

3.2. Market Dynamics

3.2.1. Active Calcium Silicate Market Drivers

3.2.2. Active Calcium Silicate Market Restraints

3.2.3. Active Calcium Silicate Market Opportunities

3.2.4. Major Active Calcium Silicate Industry Challenges

3.3. Growth and Development Patterns

3.4. Investment Feasibility Analysis

3.5. Market Opportunity Analysis

3.5.1. Application

3.5.2. End-Use Industry

3.5.3. Product Form

3.5.4. Geography


4. Market Competitive Landscape Analysis

4.1. Company Market Share Analysis, 2022

4.1.1. Global Active Calcium Silicate Market: Company Market Share, Value 2022

4.1.2. Global Active Calcium Silicate Market: Top 6 Company Market Share, Value 2022

4.1.3. Global Active Calcium Silicate Market: Top 3 Company Market Share, Value 2022

4.2. Global Active Calcium Silicate Market: Company Revenue Share Analysis, 2022

4.3. Company Assessment Metrics, 2022

4.3.1. Stars

4.3.2. Emerging Leaders

4.3.3. Pervasive Players

4.3.4. Participants

4.4. Startups/ SMEs Assessment Metrics, 2022

4.4.1. Progressive Companies

4.4.2. Responsive Companies

4.4.3. Dynamic Companies

4.4.4. Starting Blocks

4.5. Strategic Development

4.5.1. Acquisition and Mergers

4.5.2. New Application Launch

4.5.3. Regional Expansion

4.5.4. Partnerships

4.6. Key Player Application Matrix

4.7. Potential for New Players in the Global Active Calcium Silicate Market


5. Premium Insights

5.1. STAR (Situation, Task, Action, Results) Analysis

5.2. Porter’s Five Forces Analysis

5.2.1. Threat of New Entrants

5.2.2. Bargaining Power of Buyers/Consumers

5.2.3. Bargaining Power of Suppliers

5.2.4. Threat of Substitute Types

5.2.5. Intensity of Competitive Rivalry

5.3. PESTEL Analysis

5.3.1. Political Factors

5.3.2. Economic Factors

5.3.3. Social Factors

5.3.4. Technological Factors

5.3.5. Environmental Factors

5.3.6. Legal Factors

5.4. Key Market Trends

5.4.1. Demand Side Trends

5.4.2. Supply Side Trends

5.5. Value Chain Analysis

5.6. Technology Analysis

5.6.1. Blocks and Boards in the global market

5.6.2. Patent Analysis

5.6.3. Emerging technologies and their potential disruption to the market

5.7. Consumer Behaviour Analysis

5.7.1. Consumer Preferences and Expectations

5.7.2. Factors Influencing Consumer Buying Decisions

5.7.2.1. North America

5.7.2.2. Europe

5.7.2.3. Asia Pacific

5.7.2.4. Latin America

5.7.2.5. Middle East and Africa

5.7.3. Consumer Pain Points

5.8. Analysis and Recommendations

5.9. Adjacent Market Analysis


6. Market Positioning of Key Players, 2022

6.1. Company market share of key players, 2022

6.2. Competitive Benchmarking

6.3. Market Positioning of Key Vendors

6.4. Geographical Presence Analysis

6.5. Major Strategies Adopted by Key Players

6.5.1. Key Strategies Analysis

6.5.2. Mergers and Acquisitions

6.5.3. Partnerships

6.5.4. Application Launch

6.5.5. Geographical Expansion

6.5.6. Paints and Coatings


7. Impact Analysis of COVID 19 and Russia – Ukraine War on Active Calcium Silicate Market

7.1. Ukraine-Russia War Impact

7.1.1. Uncertainty and Economic Instability

7.1.2. Supply chain disruptions

7.1.3. Regional market shifts

7.1.4. Shift in government priorities

7.2. COVID-19 Impact Analysis

7.2.1. Supply Chain Disruptions

7.2.2. Demand Fluctuations

7.2.3. Shift in Application Mix

7.2.4. Reduced Thermal Insulation Activity

7.2.5. Regional Impact Analysis

7.2.5.1. North America

7.2.5.2. Europe

7.2.5.3. Asia Pacific

7.2.5.4. Latin America

7.2.5.5. Middle East and Africa


8. Global Active Calcium Silicate Market, By Application

8.1. Global Active Calcium Silicate Market Overview, By Application

8.1.1. Global Active Calcium Silicate Market Revenue Share, By Application, 2022 Vs 2030 (in %)

8.2. Thermal Insulation

8.2.1. Global Active Calcium Silicate Market, By THERMAL INSULATION, By Region, 2017-2030 (US$ Mn)

8.2.2. Market Dynamics for THERMAL INSULATION

8.2.2.1. Drivers

8.2.2.2. Restraints

8.2.2.3. Opportunities

8.2.2.4. Trends

8.3. Fireproofing and Passive Fire Protection

8.3.1. Global Active Calcium Silicate Market, By FIREPROOFING AND PASSIVE FIRE PROTECTION, By Region, 2017-2030 (US$ Mn)

8.3.2. Market Dynamics for FIREPROOFING AND PASSIVE FIRE PROTECTION

8.3.2.1. Drivers

8.3.2.2. Restraints

8.3.2.3. Opportunities

8.3.2.4. Trends

8.4. Cement and Construction

8.4.1. Global Active Calcium Silicate Market, By Cement and Construction, By Region, 2017-2030 (US$ Mn)

8.4.2. Market Dynamics for Cement and Construction

8.4.2.1. Drivers

8.4.2.2. Restraints

8.4.2.3. Opportunities

8.4.2.4. Trends

8.5. Ceramics and Pottery

8.5.1. Global Active Calcium Silicate Market, By Ceramics and Pottery, By Region, 2017-2030 (US$ Mn)

8.5.2. Market Dynamics for Ceramics and Pottery

8.5.2.1. Drivers

8.5.2.2. Restraints

8.5.2.3. Opportunities

8.5.2.4. Trends

8.6. Paints and Coatings

8.6.1. Global Active Calcium Silicate Market, By Paints and Coatings, By Region, 2017-2030 (US$ Mn)

8.6.2. Market Dynamics for Paints and Coatings

8.6.2.1. Drivers

8.6.2.2. Restraints

8.6.2.3. Opportunities

8.6.2.4. Trends


9. Global Active Calcium Silicate Market, By End-Use Industry

9.1. Global Active Calcium Silicate Market Overview, By End-Use Industry

9.1.1. Global Active Calcium Silicate Market Revenue Share, By End-Use Industry, 2022 Vs 2030 (in %)

9.2. Industrial

9.2.1. Global Active Calcium Silicate Market, By Industrial, By Region, 2017-2030 (US$ Mn)

9.2.2. Market Dynamics for Industrial

9.2.2.1. Drivers

9.2.2.2. Restraints

9.2.2.3. Opportunities

9.2.2.4. Trends

9.3. Construction

9.3.1. Global Active Calcium Silicate Market, By Construction, By Region, 2017-2030 (US$ Mn)

9.3.2. Market Dynamics for Construction

9.3.2.1. Drivers

9.3.2.2. Restraints

9.3.2.3. Opportunities

9.3.2.4. Trends


10. Global Active Calcium Silicate Market, By Product Form

10.1. Global Active Calcium Silicate Market Overview, By Product Form

10.1.1. Global Active Calcium Silicate Market Revenue Share, By Product Form, 2022 Vs 2030 (in %)

10.2. Powder

10.2.1. Global Active Calcium Silicate Market, By Powder, By Region, 2017-2030 (US$ Mn)

10.2.2. Market Dynamics for Powder

10.2.2.1. Drivers

10.2.2.2. Restraints

10.2.2.3. Opportunities

10.2.2.4. Trends

10.3. Blocks and Boards

10.3.1. Global Active Calcium Silicate Market, By Blocks and Boards, By Region, 2017-2030 (US$ Mn)

10.3.2. Market Dynamics for Blocks and Boards

10.3.2.1. Drivers

10.3.2.2. Restraints

10.3.2.3. Opportunities

10.3.2.4. Trends


11. Global Active Calcium Silicate Market, By Region

11.1. Global Active Calcium Silicate Market Overview, by Region

11.1.1. Global Active Calcium Silicate Market, By Region, 2022 vs 2030 (in%)

11.2. Application

11.2.1. Global Active Calcium Silicate Market, By Application, 2017-2030 (US$ Mn)

11.3. End-Use Industry

11.3.1. Global Active Calcium Silicate Market, By End-Use Industry, 2017-2030 (US$ Mn)

11.4. Product Form

11.4.1. Global Active Calcium Silicate Market, By Product Form, 2017-2030 (US$ Mn)


12. North America Active Calcium Silicate Market Analysis

12.1. Overview

12.1.1. Market Dynamics for North America

12.1.1.1. Drivers

12.1.1.2. Restraints

12.1.1.3. Opportunities

12.1.1.4. Trends

12.2. North America Active Calcium Silicate Market, By Application, 2017-2030(US$ Mn)

12.2.1. Overview

12.2.2. SRC Analysis

12.3. North America Active Calcium Silicate Market, By End-Use Industry, 2017-2030(US$ Mn)

12.3.1. Overview

12.3.2. SRC Analysis

12.4. North America Active Calcium Silicate Market, By Product Form, 2017-2030(US$ Mn)

12.4.1. Overview

12.4.2. SRC Analysis

12.5. North America Active Calcium Silicate Market, by Country, 2017-2030(US$ Mn)

12.5.1. North America Active Calcium Silicate Market, by Country, 2022 Vs 2030 (in%)

12.5.2. U.S.

12.5.3. Canada

12.5.4. Mexico


13. Europe Active Calcium Silicate Market Analysis

13.1. Overview

13.1.1. Market Dynamics for North America

13.1.1.1. Drivers

13.1.1.2. Restraints

13.1.1.3. Opportunities

13.1.1.4. Trends

13.2. Europe Active Calcium Silicate Market, By Application, 2017-2030(US$ Mn)

13.2.1. Overview

13.2.2. SRC Analysis

13.3. Europe Active Calcium Silicate Market, By End-Use Industry, 2017-2030(US$ Mn)

13.3.1. Overview

13.3.2. SRC Analysis

13.4. Europe Active Calcium Silicate Market, By Product Form, 2017-2030(US$ Mn)

13.4.1. Overview

13.4.2. SRC Analysis

13.5. Europe Active Calcium Silicate Market, by Country, 2017-2030 (US$ Mn)

13.5.1. Europe Active Calcium Silicate Market, by Country, 2022 Vs 2030 (in%)

13.5.2. UK

13.5.3. France

13.5.4. Germany

13.5.5. Italy

13.5.6. Spain

13.5.7. Benelux

13.5.8. Russia

13.5.9. Rest of Europe


14. Asia Pacific Active Calcium Silicate Market Analysis

14.1. Overview

14.1.1. Market Dynamics for North America

14.1.1.1. Drivers

14.1.1.2. Restraints

14.1.1.3. Opportunities

14.1.1.4. Trends

14.2. Asia Pacific Active Calcium Silicate Market, By Application, 2017-2030(US$ Mn)

14.2.1. Overview

14.2.2. SRC Analysis

14.3. Asia Pacific Active Calcium Silicate Market, By End-Use Industry, 2017-2030(US$ Mn)

14.3.1. Overview

14.3.2. SRC Analysis

14.4. Asia Pacific Active Calcium Silicate Market, By Product Form, 2017-2030(US$ Mn)

14.4.1. Overview

14.4.2. SRC Analysis

14.5. Asia Pacific Active Calcium Silicate Market, by Country, 2017-2030 (US$ Mn)

14.5.1. Asia Pacific Active Calcium Silicate Market, by Country, 2022 Vs 2030 (in%)

14.5.2. China

14.5.3. Japan

14.5.4. India

14.5.5. South Korea

14.5.6. South East Asia

14.5.7. Rest of Asia Pacific


15. Latin America Active Calcium Silicate Market Analysis

15.1. Overview

15.1.1. Market Dynamics for North America

15.1.1.1. Drivers

15.1.1.2. Restraints

15.1.1.3. Opportunities

15.1.1.4. Trends

15.2. Latin America Active Calcium Silicate Market, By Application, 2017-2030(US$ Mn)

15.2.1. Overview

15.2.2. SRC Analysis

15.3. Latin America Active Calcium Silicate Market, By End-Use Industry, 2017-2030(US$ Mn)

15.3.1. Overview

15.3.2. SRC Analysis

15.4. Latin America Active Calcium Silicate Market, By Product Form, 2017-2030(US$ Mn)

15.4.1. Overview

15.4.2. SRC Analysis

15.5. Latin America Active Calcium Silicate Market, by Country, 2017-2030 (US$ Mn)

15.5.1. Latin America Active Calcium Silicate Market, by Country, 2022 Vs 2030 (in%)

15.5.2. Brazil

15.5.3. Argentina

15.5.4. Rest of Latin America


16. Middle East Active Calcium Silicate Market Analysis

16.1. Overview

16.1.1. Market Dynamics for North America

16.1.1.1. Drivers

16.1.1.2. Restraints

16.1.1.3. Opportunities

16.1.1.4. Trends

16.2. Middle East Active Calcium Silicate Market, By Application, 2017-2030(US$ Mn)

16.2.1. Overview

16.2.2. SRC Analysis

16.3. Middle East Active Calcium Silicate Market, By End-Use Industry, 2017-2030(US$ Mn)

16.3.1. Overview

16.3.2. SRC Analysis

16.4. Middle East Active Calcium Silicate Market, By Product Form, 2017-2030(US$ Mn)

16.4.1. Overview

16.4.2. SRC Analysis

16.5. Middle East Active Calcium Silicate Market, by Country, 2017-2030 (US$ Mn)

16.5.1. Middle East Active Calcium Silicate Market, by Country, 2022 Vs 2030 (in%)

16.5.2. UAE

16.5.3. Saudi Arabia

16.5.4. Rest of Middle East


17. Africa Active Calcium Silicate Market Analysis

17.1. Overview

17.1.1. Market Dynamics for North America

17.1.1.1. Drivers

17.1.1.2. Restraints

17.1.1.3. Opportunities

17.1.1.4. Trends

17.2. Africa Active Calcium Silicate Market, By Application, 2017-2030(US$ Mn)

17.2.1. Overview

17.2.2. SRC Analysis

17.3. Africa Active Calcium Silicate Market, By End-Use Industry, 2017-2030(US$ Mn)

17.3.1. Overview

17.3.2. SRC Analysis

17.4. Africa Active Calcium Silicate Market, By Product Form, 2017-2030(US$ Mn)

17.4.1. Overview

17.4.2. SRC Analysis

17.5. Africa Active Calcium Silicate Market, by Country, 2017-2030 (US$ Mn)

17.5.1. Middle East Active Calcium Silicate Market, by Country, 2022 Vs 2030 (in%)

17.5.2. South Africa

17.5.3. Egypt

17.5.4. Rest of Africa


18. Company Profiles

18.1. American Elements

18.1.1. Company Overview

18.1.2. Applications/Services Portfolio

18.1.3. Geographical Presence

18.1.4. SWOT Analysis

18.1.5. Financial Summary

18.1.5.1. Market Revenue and Net Profit (2019-2022)

18.1.5.2. Business Segment Revenue Analysis

18.1.5.3. Geographical Revenue Analysis

18.2. HIL Limited

18.3. Johns Manville

18.4. MLA Group of Industries

18.5. Promat International (Etex)

18.6. Ramco Industries Limited

18.7. Sibelco

18.8. Skamol Group

18.9. Weifang Hongyuan Chemical Co., Ltd.

18.10. Xella Group


19. Research Methodology

19.1. Research Methodology

19.2. Powder – Secondary Research

19.3. Powder I – Data Modelling

19.3.1. Company Share Analysis Model

19.3.2. Revenue Based Modelling

19.4. Powder II – Primary Research

19.5. Research Limitations

19.5.1. Assumptions

List of Figures

FIG. 1 Global Active Calcium Silicate Market: Research Methodology

FIG. 2 Market Size Estimation – Top Down & Bottom up Approach

FIG. 3 Global Active Calcium Silicate Market Segmentation

FIG. 4 Global Active Calcium Silicate Market, By Application, 2022 (US$ Mn)

FIG. 5 Global Active Calcium Silicate Market, By End-Use Industry, 2022 (US$ Mn)

FIG. 6 Global Active Calcium Silicate Market, By Product Form, 2022 (US$ Mn)

FIG. 7 Global Active Calcium Silicate Market, by Geography, 2022 (US$ Mn)

FIG. 8 Attractive Investment Proposition, By Application, 2022

FIG. 9 Attractive Investment Proposition, By End-Use Industry, 2022

FIG. 10 Attractive Investment Proposition, By Product Form, 2022

FIG. 11 Attractive Investment Proposition, by Geography, 2022

FIG. 12 Global Market Share Analysis of Key Active Calcium Silicate Market Manufacturers, 2022

FIG. 13 Global Market Positioning of Key Active Calcium Silicate Market Manufacturers, 2022

FIG. 14 Global Active Calcium Silicate Market Value Contribution, By Application, 2022 & 2030 (Value %)

FIG. 15 Global Active Calcium Silicate Market, by THERMAL INSULATION, Value, 2017-2030 (US$ Mn)

FIG. 16 Global Active Calcium Silicate Market, by FIREPROOFING AND PASSIVE FIRE PROTECTION, Value, 2017-2030 (US$ Mn)

FIG. 17 Global Active Calcium Silicate Market, by Cement and Construction, Value, 2017-2030 (US$ Mn)

FIG. 18 Global Active Calcium Silicate Market, by Ceramics and Pottery, Value, 2017-2030 (US$ Mn)

FIG. 19 Global Active Calcium Silicate Market, by Paints and Coatingsx, Value, 2017-2030 (US$ Mn)

FIG. 20 Global Active Calcium Silicate Market Value Contribution, By End-Use Industry, 2022 & 2030 (Value %)

FIG. 21 Global Active Calcium Silicate Market, by Industrial, Value, 2017-2030 (US$ Mn)

FIG. 22 Global Active Calcium Silicate Market, by Construction, Value, 2017-2030 (US$ Mn)

FIG. 23 Global Active Calcium Silicate Market Value Contribution, By Product Form, 2022 & 2030 (Value %)

FIG. 24 Global Active Calcium Silicate Market, by Powder, Value, 2017-2030 (US$ Mn)

FIG. 25 Global Active Calcium Silicate Market, by Blocks and Boards, Value, 2017-2030 (US$ Mn)

FIG. 26 North America Active Calcium Silicate Market, 2017-2030 (US$ Mn)

FIG. 27 U.S. Active Calcium Silicate Market, 2017-2030 (US$ Mn)

FIG. 28 Canada Active Calcium Silicate Market, 2017-2030 (US$ Mn)

FIG. 29 Mexico Active Calcium Silicate Market, 2017-2030 (US$ Mn)

FIG. 30 Europe Active Calcium Silicate Market, 2017-2030 (US$ Mn)

FIG. 31 Germany Active Calcium Silicate Market, 2017-2030 (US$ Mn)

FIG. 32 France Active Calcium Silicate Market, 2017-2030 (US$ Mn)

FIG. 33 U.K. Active Calcium Silicate Market, 2017-2030 (US$ Mn)

FIG. 34 Italy Active Calcium Silicate Market, 2017-2030 (US$ Mn)

FIG. 35 Spain Active Calcium Silicate Market, 2017-2030 (US$ Mn)

FIG. 36 Benelux Active Calcium Silicate Market, 2017-2030 (US$ Mn)

FIG. 37 Russia Active Calcium Silicate Market, 2017-2030 (US$ Mn)

FIG. 38 Rest of Europe Active Calcium Silicate Market, 2017-2030 (US$ Mn)

FIG. 39 Asia Pacific Active Calcium Silicate Market, 2017-2030 (US$ Mn)

FIG. 40 China Active Calcium Silicate Market, 2017-2030 (US$ Mn)

FIG. 41 Japan Active Calcium Silicate Market, 2017-2030 (US$ Mn)

FIG. 42 India Active Calcium Silicate Market, 2017-2030 (US$ Mn)

FIG. 43 South Korea Active Calcium Silicate Market, 2017-2030 (US$ Mn)

FIG. 44 South-East Asia Active Calcium Silicate Market, 2017-2030 (US$ Mn)

FIG. 45 Rest of Asia Pacific Active Calcium Silicate Market, 2017-2030 (US$ Mn)

FIG. 46 Latin America Active Calcium Silicate Market, 2017-2030 (US$ Mn)

FIG. 47 Brazil Active Calcium Silicate Market, 2017-2030 (US$ Mn)

FIG. 48 Argentina Active Calcium Silicate Market, 2017-2030 (US$ Mn)

FIG. 49 Rest of Latin America Active Calcium Silicate Market, 2017-2030 (US$ Mn)

FIG. 50 Middle East Active Calcium Silicate Market, 2017-2030 (US$ Mn)

FIG. 51 UAE Active Calcium Silicate Market, 2017-2030 (US$ Mn)

FIG. 52 Saudi Arabia Active Calcium Silicate Market, 2017-2030 (US$ Mn)

FIG. 53 Rest of Middle East Active Calcium Silicate Market, 2017-2030 (US$ Mn)

FIG. 54 Africa Active Calcium Silicate Market, 2017-2030 (US$ Mn)

FIG. 55 South Africa Active Calcium Silicate Market, 2017-2030 (US$ Mn)

FIG. 56 Egypt Active Calcium Silicate Market, 2017-2030 (US$ Mn)

FIG. 57 Rest of Africa Active Calcium Silicate Market, 2017-2030 (US$ Mn)


List of Tables

TABLE 1 Market Snapshot: Global Active Calcium Silicate Market

TABLE 2 Global Active Calcium Silicate Market: Drivers Impact Analysis

TABLE 3 Global Active Calcium Silicate Market: Market Restraints Impact Analysis

TABLE 4 Global Active Calcium Silicate Market, by Competitive Benchmarking, 2022

TABLE 5 Global Active Calcium Silicate Market, by Geographical Presence Analysis, 2022

TABLE 6 Global Active Calcium Silicate Market, by Key Strategies Analysis, 2022

TABLE 7 Global Active Calcium Silicate Market, by THERMAL INSULATION, By Region, 2017-2022 (US$ Mn)

TABLE 8 Global Active Calcium Silicate Market, by THERMAL INSULATION, By Region, 2023-2030 (US$ Mn)

TABLE 9 Global Active Calcium Silicate Market, by FIREPROOFING AND PASSIVE FIRE PROTECTION, By Region, 2017-2022 (US$ Mn)

TABLE 10 Global Active Calcium Silicate Market, by FIREPROOFING AND PASSIVE FIRE PROTECTION, By Region, 2023-2030 (US$ Mn)

TABLE 11 Global Active Calcium Silicate Market, by Industrial, By Region, 2017-2022 (US$ Mn)

TABLE 12 Global Active Calcium Silicate Market, by Industrial, By Region, 2023-2030 (US$ Mn)

TABLE 13 Global Active Calcium Silicate Market, by Construction, By Region, 2017-2022 (US$ Mn)

TABLE 14 Global Active Calcium Silicate Market, by Construction, By Region, 2023-2030 (US$ Mn)

TABLE 15 Global Active Calcium Silicate Market, by Powder, By Region, 2017-2022 (US$ Mn)

TABLE 16 Global Active Calcium Silicate Market, by Powder, By Region, 2023-2030 (US$ Mn)

TABLE 17 Global Active Calcium Silicate Market, by Blocks and Boards, By Region, 2017-2022 (US$ Mn)

TABLE 18 Global Active Calcium Silicate Market, by Blocks and Boards, By Region, 2023-2030 (US$ Mn)

TABLE 19 Global Active Calcium Silicate Market, By Application, 2017-2022 (US$ Mn)

TABLE 20 Global Active Calcium Silicate Market, By Application, 2023-2030 (US$ Mn)

TABLE 21 Global Active Calcium Silicate Market, By End-Use Industry, 2017-2022 (US$ Mn)

TABLE 22 Global Active Calcium Silicate Market, By End-Use Industry, 2023-2030 (US$ Mn)

TABLE 23 Global Active Calcium Silicate Market, By Product Form, 2017-2022 (US$ Mn)

TABLE 24 Global Active Calcium Silicate Market, By Product Form, 2023-2030 (US$ Mn)

TABLE 25 Global Active Calcium Silicate Market, by Region, 2017-2022 (US$ Mn)

TABLE 26 Global Active Calcium Silicate Market, by Region, 2023-2030 (US$ Mn)

TABLE 27 North America Active Calcium Silicate Market, By Application, 2017-2022 (US$ Mn)

TABLE 28 North America Active Calcium Silicate Market, By Application, 2023-2030 (US$ Mn)

TABLE 29 North America Active Calcium Silicate Market, By End-Use Industry, 2017-2022 (US$ Mn)

TABLE 30 North America Active Calcium Silicate Market, By End-Use Industry, 2023-2030 (US$ Mn)

TABLE 31 North America Active Calcium Silicate Market, By Product Form, 2017-2022 (US$ Mn)

TABLE 32 North America Active Calcium Silicate Market, By Product Form, 2023-2030 (US$ Mn)

TABLE 33 North America Active Calcium Silicate Market, by Country, 2017-2022 (US$ Mn)

TABLE 34 North America Active Calcium Silicate Market, by Country, 2023-2030 (US$ Mn)

TABLE 35 United States Active Calcium Silicate Market, By Application, 2017-2022 (US$ Mn)

TABLE 36 United States Active Calcium Silicate Market, By Application, 2023-2030 (US$ Mn)

TABLE 37 United States Active Calcium Silicate Market, By End-Use Industry, 2017-2022 (US$ Mn)

TABLE 38 United States Active Calcium Silicate Market, By End-Use Industry, 2023-2030 (US$ Mn)

TABLE 39 United States Active Calcium Silicate Market, By Product Form, 2017-2022 (US$ Mn)

TABLE 40 United States Active Calcium Silicate Market, By Product Form, 2023-2030 (US$ Mn)

TABLE 41 Canada Active Calcium Silicate Market, By Application, 2017-2022 (US$ Mn)

TABLE 42 Canada Active Calcium Silicate Market, By Application, 2023-2030 (US$ Mn)

TABLE 43 Canada Active Calcium Silicate Market, By End-Use Industry, 2017-2022 (US$ Mn)

TABLE 44 Canada Active Calcium Silicate Market, By End-Use Industry, 2023-2030 (US$ Mn)

TABLE 45 Canada Active Calcium Silicate Market, By Product Form, 2017-2022 (US$ Mn)

TABLE 46 Canada Active Calcium Silicate Market, By Product Form, 2023-2030 (US$ Mn)

TABLE 47 Mexico Active Calcium Silicate Market, By Application, 2017-2022 (US$ Mn)

TABLE 48 Mexico Active Calcium Silicate Market, By Application, 2023-2030 (US$ Mn)

TABLE 49 Mexico Active Calcium Silicate Market, By End-Use Industry, 2017-2022 (US$ Mn)

TABLE 50 Mexico Active Calcium Silicate Market, By End-Use Industry, 2023-2030 (US$ Mn)

TABLE 51 Mexico Active Calcium Silicate Market, By Product Form, 2017-2022 (US$ Mn)

TABLE 52 Mexico Active Calcium Silicate Market, By Product Form, 2023-2030 (US$ Mn)

TABLE 53 Europe Active Calcium Silicate Market, By Application, 2017-2022 (US$ Mn)

TABLE 54 Europe Active Calcium Silicate Market, By Application, 2023-2030 (US$ Mn)

TABLE 55 Europe Active Calcium Silicate Market, By End-Use Industry, 2017-2022 (US$ Mn)

TABLE 56 Europe Active Calcium Silicate Market, By End-Use Industry, 2023-2030 (US$ Mn)

TABLE 57 Europe Active Calcium Silicate Market, By Product Form, 2017-2022 (US$ Mn)

TABLE 58 Europe Active Calcium Silicate Market, By Product Form, 2023-2030 (US$ Mn)

TABLE 59 Europe Active Calcium Silicate Market, by Country, 2017-2022 (US$ Mn)

TABLE 60 Europe Active Calcium Silicate Market, by Country, 2023-2030 (US$ Mn)

TABLE 61 Germany Active Calcium Silicate Market, By Application, 2017-2022 (US$ Mn)

TABLE 62 Germany Active Calcium Silicate Market, By Application, 2023-2030 (US$ Mn)

TABLE 63 Germany Active Calcium Silicate Market, By End-Use Industry, 2017-2022 (US$ Mn)

TABLE 64 Germany Active Calcium Silicate Market, By End-Use Industry, 2023-2030 (US$ Mn)

TABLE 65 Germany Active Calcium Silicate Market, By Product Form, 2017-2022 (US$ Mn)

TABLE 66 Germany Active Calcium Silicate Market, By Product Form, 2023-2030 (US$ Mn)

TABLE 67 France Active Calcium Silicate Market, By Application, 2017-2022 (US$ Mn)

TABLE 68 France Active Calcium Silicate Market, By Application, 2023-2030 (US$ Mn)

TABLE 69 France Active Calcium Silicate Market, By End-Use Industry, 2017-2022 (US$ Mn)

TABLE 70 France Active Calcium Silicate Market, By End-Use Industry, 2023-2030 (US$ Mn)

TABLE 71 France Active Calcium Silicate Market, By Product Form, 2017-2022 (US$ Mn)

TABLE 72 France Active Calcium Silicate Market, By Product Form, 2023-2030 (US$ Mn)

TABLE 73 United Kingdom Active Calcium Silicate Market, By Application, 2017-2022 (US$ Mn)

TABLE 74 United Kingdom Active Calcium Silicate Market, By Application, 2023-2030 (US$ Mn)

TABLE 75 United Kingdom Active Calcium Silicate Market, By End-Use Industry, 2017-2022 (US$ Mn)

TABLE 76 United Kingdom Active Calcium Silicate Market, By End-Use Industry, 2023-2030 (US$ Mn)

TABLE 77 United Kingdom Active Calcium Silicate Market, By Product Form, 2017-2022 (US$ Mn)

TABLE 78 United Kingdom Active Calcium Silicate Market, By Product Form, 2023-2030 (US$ Mn)

TABLE 79 Italy Active Calcium Silicate Market, By Application, 2017-2022 (US$ Mn)

TABLE 80 Italy Active Calcium Silicate Market, By Application, 2023-2030 (US$ Mn)

TABLE 81 Italy Active Calcium Silicate Market, By End-Use Industry, 2017-2022 (US$ Mn)

TABLE 82 Italy Active Calcium Silicate Market, By End-Use Industry, 2023-2030 (US$ Mn)

TABLE 83 Italy Active Calcium Silicate Market, By Product Form, 2017-2022 (US$ Mn)

TABLE 84 Italy Active Calcium Silicate Market, By Product Form, 2023-2030 (US$ Mn)

TABLE 85 Spain Active Calcium Silicate Market, By Application, 2017-2022 (US$ Mn)

TABLE 86 Spain Active Calcium Silicate Market, By Application, 2023-2030 (US$ Mn)

TABLE 87 Spain Active Calcium Silicate Market, By End-Use Industry, 2017-2022 (US$ Mn)

TABLE 88 Spain Active Calcium Silicate Market, By End-Use Industry, 2023-2030 (US$ Mn)

TABLE 89 Spain Active Calcium Silicate Market, By Product Form, 2017-2022 (US$ Mn)

TABLE 90 Spain Active Calcium Silicate Market, By Product Form, 2023-2030 (US$ Mn)

TABLE 91 Benelux Active Calcium Silicate Market, By Application, 2017-2022 (US$ Mn)

TABLE 92 Benelux Active Calcium Silicate Market, By Application, 2023-2030 (US$ Mn)

TABLE 93 Benelux Active Calcium Silicate Market, By End-Use Industry, 2017-2022 (US$ Mn)

TABLE 94 Benelux Active Calcium Silicate Market, By End-Use Industry, 2023-2030 (US$ Mn)

TABLE 95 Benelux Active Calcium Silicate Market, By Product Form, 2017-2022 (US$ Mn)

TABLE 96 Benelux Active Calcium Silicate Market, By Product Form, 2023-2030 (US$ Mn)

TABLE 97 Russia Active Calcium Silicate Market, By Application, 2017-2022 (US$ Mn)

TABLE 98 Russia Active Calcium Silicate Market, By Application, 2023-2030 (US$ Mn)

TABLE 99 Russia Active Calcium Silicate Market, By End-Use Industry, 2017-2022 (US$ Mn)

TABLE 100 Russia Active Calcium Silicate Market, By End-Use Industry, 2023-2030 (US$ Mn)

TABLE 101 Russia Active Calcium Silicate Market, By Product Form, 2017-2022 (US$ Mn)

TABLE 102 Russia Active Calcium Silicate Market, By Product Form, 2023-2030 (US$ Mn)

TABLE 103 Rest of Europe Active Calcium Silicate Market, By Application, 2017-2022 (US$ Mn)

TABLE 104 Rest of Europe Active Calcium Silicate Market, By Application, 2023-2030 (US$ Mn)

TABLE 105 Rest of Europe Active Calcium Silicate Market, By End-Use Industry, 2017-2022 (US$ Mn)

TABLE 106 Rest of Europe Active Calcium Silicate Market, By End-Use Industry, 2023-2030 (US$ Mn)

TABLE 107 Rest of Europe Active Calcium Silicate Market, By Product Form, 2017-2022 (US$ Mn)

TABLE 108 Rest of Europe Active Calcium Silicate Market, By Product Form, 2023-2030 (US$ Mn)

TABLE 109 Asia Pacific Active Calcium Silicate Market, By Application, 2017-2022 (US$ Mn)

TABLE 110 Asia Pacific Active Calcium Silicate Market, By Application, 2023-2030 (US$ Mn)

TABLE 111 Asia Pacific Active Calcium Silicate Market, By End-Use Industry, 2017-2022 (US$ Mn)

TABLE 112 Asia Pacific Active Calcium Silicate Market, By End-Use Industry, 2023-2030 (US$ Mn)

TABLE 113 Asia Pacific Active Calcium Silicate Market, By Product Form, 2017-2022 (US$ Mn)

TABLE 114 Asia Pacific Active Calcium Silicate Market, By Product Form, 2023-2030 (US$ Mn)

TABLE 115 China Active Calcium Silicate Market, By Application, 2017-2022 (US$ Mn)

TABLE 116 China Active Calcium Silicate Market, By Application, 2023-2030 (US$ Mn)

TABLE 117 China Active Calcium Silicate Market, By End-Use Industry, 2017-2022 (US$ Mn)

TABLE 118 China Active Calcium Silicate Market, By End-Use Industry, 2023-2030 (US$ Mn)

TABLE 119 China Active Calcium Silicate Market, By Product Form, 2017-2022 (US$ Mn)

TABLE 120 China Active Calcium Silicate Market, By Product Form, 2023-2030 (US$ Mn)

TABLE 121 Japan Active Calcium Silicate Market, By Application, 2017-2022 (US$ Mn)

TABLE 122 Japan Active Calcium Silicate Market, By Application, 2023-2030 (US$ Mn)

TABLE 123 Japan Active Calcium Silicate Market, By End-Use Industry, 2017-2022 (US$ Mn)

TABLE 124 Japan Active Calcium Silicate Market, By End-Use Industry, 2023-2030 (US$ Mn)

TABLE 125 Japan Active Calcium Silicate Market, By Product Form, 2017-2022 (US$ Mn)

TABLE 126 Japan Active Calcium Silicate Market, By Product Form, 2023-2030 (US$ Mn)

TABLE 127 India Active Calcium Silicate Market, By Application, 2017-2022 (US$ Mn)

TABLE 128 India Active Calcium Silicate Market, By Application, 2023-2030 (US$ Mn)

TABLE 129 India Active Calcium Silicate Market, By End-Use Industry, 2017-2022 (US$ Mn)

TABLE 130 India Active Calcium Silicate Market, By End-Use Industry, 2023-2030 (US$ Mn)

TABLE 131 India Active Calcium Silicate Market, By Product Form, 2017-2022 (US$ Mn)

TABLE 132 India Active Calcium Silicate Market, By Product Form, 2023-2030 (US$ Mn)

TABLE 133 South Korea Active Calcium Silicate Market, By Application, 2017-2022 (US$ Mn)

TABLE 134 South Korea Active Calcium Silicate Market, By Application, 2023-2030 (US$ Mn)

TABLE 135 South Korea Active Calcium Silicate Market, By End-Use Industry, 2017-2022 (US$ Mn)

TABLE 136 South Korea Active Calcium Silicate Market, By End-Use Industry, 2023-2030 (US$ Mn)

TABLE 137 South Korea Active Calcium Silicate Market, By Product Form, 2017-2022 (US$ Mn)

TABLE 138 South Korea Active Calcium Silicate Market, By Product Form, 2023-2030 (US$ Mn)

TABLE 139 South-East Asia Active Calcium Silicate Market, By Application, 2017-2022 (US$ Mn)

TABLE 140 South-East Asia Active Calcium Silicate Market, By Application, 2023-2030 (US$ Mn)

TABLE 141 South-East Asia Active Calcium Silicate Market, By End-Use Industry, 2017-2022 (US$ Mn)

TABLE 142 South-East Asia Active Calcium Silicate Market, By End-Use Industry, 2023-2030 (US$ Mn)

TABLE 143 South-East Asia Active Calcium Silicate Market, By Product Form, 2017-2022 (US$ Mn)

TABLE 144 South-East Asia Active Calcium Silicate Market, By Product Form, 2023-2030 (US$ Mn)

TABLE 145 Rest of Asia Pacific Active Calcium Silicate Market, By Application, 2017-2022 (US$ Mn)

TABLE 146 Rest of Asia Pacific Active Calcium Silicate Market, By Application, 2023-2030 (US$ Mn)

TABLE 147 Rest of Asia Pacific Active Calcium Silicate Market, By End-Use Industry, 2017-2022 (US$ Mn)

TABLE 148 Rest of Asia Pacific Active Calcium Silicate Market, By End-Use Industry, 2023-2030 (US$ Mn)

TABLE 149 Rest of Asia Pacific Active Calcium Silicate Market, By Product Form, 2017-2022 (US$ Mn)

TABLE 150 Rest of Asia Pacific Active Calcium Silicate Market, By Product Form, 2023-2030 (US$ Mn)

TABLE 151 Latin America Active Calcium Silicate Market, By Application, 2017-2022 (US$ Mn)

TABLE 152 Latin America Active Calcium Silicate Market, By Application, 2023-2030 (US$ Mn)

TABLE 153 Latin America Active Calcium Silicate Market, By End-Use Industry, 2017-2022 (US$ Mn)

TABLE 154 Latin America Active Calcium Silicate Market, By End-Use Industry, 2023-2030 (US$ Mn)

TABLE 155 Latin America Active Calcium Silicate Market, By Product Form, 2017-2022 (US$ Mn)

TABLE 156 Latin America Active Calcium Silicate Market, By Product Form, 2023-2030 (US$ Mn)

TABLE 157 Brazil Active Calcium Silicate Market, By Application, 2017-2022 (US$ Mn)

TABLE 158 Brazil Active Calcium Silicate Market, By Application, 2023-2030 (US$ Mn)

TABLE 159 Brazil Active Calcium Silicate Market, By End-Use Industry, 2017-2022 (US$ Mn)

TABLE 160 Brazil Active Calcium Silicate Market, By End-Use Industry, 2023-2030 (US$ Mn)

TABLE 161 Brazil Active Calcium Silicate Market, By Product Form, 2017-2022 (US$ Mn)

TABLE 162 Brazil Active Calcium Silicate Market, By Product Form, 2023-2030 (US$ Mn)

TABLE 163 Argentina Active Calcium Silicate Market, By Application, 2017-2022 (US$ Mn)

TABLE 164 Argentina Active Calcium Silicate Market, By Application, 2023-2030 (US$ Mn)

TABLE 165 Argentina Active Calcium Silicate Market, By End-Use Industry, 2017-2022 (US$ Mn)

TABLE 166 Argentina Active Calcium Silicate Market, By End-Use Industry, 2023-2030 (US$ Mn)

TABLE 167 Argentina Active Calcium Silicate Market, By Product Form, 2017-2022 (US$ Mn)

TABLE 168 Argentina Active Calcium Silicate Market, By Product Form, 2023-2030 (US$ Mn)

TABLE 169 Rest of Latin America Active Calcium Silicate Market, By Application, 2017-2022 (US$ Mn)

TABLE 170 Rest of Latin America Active Calcium Silicate Market, By Application, 2023-2030 (US$ Mn)

TABLE 171 Rest of Latin America Active Calcium Silicate Market, By End-Use Industry, 2017-2022 (US$ Mn)

TABLE 172 Rest of Latin America Active Calcium Silicate Market, By End-Use Industry, 2023-2030 (US$ Mn)

TABLE 173 Rest of Latin America Active Calcium Silicate Market, By Product Form, 2017-2022 (US$ Mn)

TABLE 174 Rest of Latin America Active Calcium Silicate Market, By Product Form, 2023-2030 (US$ Mn)

TABLE 175 Middle East Active Calcium Silicate Market, By Application, 2017-2022 (US$ Mn)

TABLE 176 Middle East Active Calcium Silicate Market, By Application, 2023-2030 (US$ Mn)

TABLE 177 Middle East Active Calcium Silicate Market, By End-Use Industry, 2017-2022 (US$ Mn)

TABLE 178 Middle East Active Calcium Silicate Market, By End-Use Industry, 2023-2030 (US$ Mn)

TABLE 179 Middle East Active Calcium Silicate Market, By Product Form, 2017-2022 (US$ Mn)

TABLE 180 Middle East Active Calcium Silicate Market, By Product Form, 2023-2030 (US$ Mn)

TABLE 181 UAEActive Calcium Silicate Market, By Application, 2017-2022 (US$ Mn)

TABLE 182 UAEActive Calcium Silicate Market, By Application, 2023-2030 (US$ Mn)

TABLE 183 UAEActive Calcium Silicate Market, By End-Use Industry, 2017-2022 (US$ Mn)

TABLE 184 UAEActive Calcium Silicate Market, By End-Use Industry, 2023-2030 (US$ Mn)

TABLE 185 UAEActive Calcium Silicate Market, By Product Form, 2017-2022 (US$ Mn)

TABLE 186 UAEActive Calcium Silicate Market, By Product Form, 2023-2030 (US$ Mn)

TABLE 187 Saudi Arabia Active Calcium Silicate Market, By Application, 2017-2022 (US$ Mn)

TABLE 188 Saudi Arabia Active Calcium Silicate Market, By Application, 2023-2030 (US$ Mn)

TABLE 189 Saudi Arabia Active Calcium Silicate Market, By End-Use Industry, 2017-2022 (US$ Mn)

TABLE 190 Saudi Arabia Active Calcium Silicate Market, By End-Use Industry, 2023-2030 (US$ Mn)

TABLE 191 Saudi Arabia Active Calcium Silicate Market, By Product Form, 2017-2022 (US$ Mn)

TABLE 192 Saudi Arabia Active Calcium Silicate Market, By Product Form, 2023-2030 (US$ Mn)

TABLE 193 Rest of Middle East Active Calcium Silicate Market, By Application, 2017-2022 (US$ Mn)

TABLE 194 Rest of Middle East Active Calcium Silicate Market, By Application, 2023-2030 (US$ Mn)

TABLE 195 Rest of Middle East Active Calcium Silicate Market, By End-Use Industry, 2017-2022 (US$ Mn)

TABLE 196 Rest of Middle East Active Calcium Silicate Market, By End-Use Industry, 2023-2030 (US$ Mn)

TABLE 197 Rest of Middle East Active Calcium Silicate Market, By Product Form, 2017-2022 (US$ Mn)

TABLE 198 Rest of Middle East Active Calcium Silicate Market, By Product Form, 2023-2030 (US$ Mn)

TABLE 199 Africa Active Calcium Silicate Market, By Application, 2017-2022 (US$ Mn)

TABLE 200 Africa Active Calcium Silicate Market, By Application, 2023-2030 (US$ Mn)

TABLE 201 Africa Active Calcium Silicate Market, By End-Use Industry, 2017-2022 (US$ Mn)

TABLE 202 Africa Active Calcium Silicate Market, By End-Use Industry, 2023-2030 (US$ Mn)

TABLE 203 Africa Active Calcium Silicate Market, By Product Form, 2017-2022 (US$ Mn)

TABLE 204 Africa Active Calcium Silicate Market, By Product Form, 2023-2030 (US$ Mn)

TABLE 205 South Africa Active Calcium Silicate Market, By Application, 2017-2022 (US$ Mn)

TABLE 206 South Africa Active Calcium Silicate Market, By Application, 2023-2030 (US$ Mn)

TABLE 207 South Africa Active Calcium Silicate Market, By End-Use Industry, 2017-2022 (US$ Mn)

TABLE 208 South Africa Active Calcium Silicate Market, By End-Use Industry, 2023-2030 (US$ Mn)

TABLE 209 South Africa Active Calcium Silicate Market, By Product Form, 2017-2022 (US$ Mn)

TABLE 210 South Africa Active Calcium Silicate Market, By Product Form, 2023-2030 (US$ Mn)

TABLE 211 Egypt Active Calcium Silicate Market, By Application, 2017-2022 (US$ Mn)

TABLE 212 Egypt Active Calcium Silicate Market, By Application, 2023-2030 (US$ Mn)

TABLE 213 Egypt Active Calcium Silicate Market, By End-Use Industry, 2017-2022 (US$ Mn)

TABLE 214 Egypt Active Calcium Silicate Market, By End-Use Industry, 2023-2030 (US$ Mn)

TABLE 215 Egypt Active Calcium Silicate Market, By Product Form, 2017-2022 (US$ Mn)

TABLE 216 Egypt Active Calcium Silicate Market, By Product Form, 2023-2030 (US$ Mn)

TABLE 217 Rest of Africa Active Calcium Silicate Market, By Application, 2017-2022 (US$ Mn)

TABLE 218 Rest of Africa Active Calcium Silicate Market, By Application, 2023-2030 (US$ Mn)

TABLE 219 Rest of Africa Active Calcium Silicate Market, By End-Use Industry, 2017-2022 (US$ Mn)

TABLE 220 Rest of Africa Active Calcium Silicate Market, By End-Use Industry, 2023-2030 (US$ Mn)

TABLE 221 Rest of Africa Active Calcium Silicate Market, By Product Form, 2017-2022 (US$ Mn)

TABLE 222 Rest of Africa Active Calcium Silicate Market, By Product Form, 2023-2030 (US$ Mn)

Frequently asked questions

What is the current Product Form of the worldwide Active Calcium Silicate Market?

In 2022, the global Active Calcium Silicate Market is expected to be worth USD 168.5 million.

What is the predicted growth rate of the Active Calcium Silicate Market between 2023 and 2030?

The Active Calcium Silicate Market is estimated to increase at a CAGR of 5.60% between 2023 and 2030, reaching USD 260.5 Million in 2030.

Which segment has the most market share in terms of End-Users Industry Industry?

Over the projection period, the construction category is likely to lead the market

Which Product Form segment governs the market demand for Active Calcium Silicate?

The blocks and boards category is expected to account for a substantial share of the market.

Which Application segment is predicted to grow at the highest rate over the forecast period?

The fireproofing and passive fire protection segment is predicted to rise at a high CAGR during the forecast period.

Which region is driving the Active Calcium Silicate industry forward?

North America dominated the market in 2022, accounting for 45% of revenue

Who are the major players in the global Active Calcium Silicate Market?

The top players include American Elements, HIL Limited, Johns Manville, MLA Group of Industries, Promat International (Etex), Ramco Industries Limited and Sibelco

What are the major market drivers of the Active Calcium Silicate industry?

The primary drivers of the market include rising demand for insulation materials, a greater emphasis on fire safety standards, and technological developments in production processes.

What are the major market restraints of the Active Calcium Silicate industry?

The market’s main difficulties include high production costs, the availability of alternative materials, and limited acceptance in price-sensitive areas.

What are the major market opportunities of the Active Calcium Silicate industry?

The primary opportunities in the market are infrastructure growth in emerging nations, the introduction of novel active calcium silicate products, and rising awareness of energy efficiency and sustainability.

Automotive Active Roll Control System Market

Published:
Report ID: 69114

Active Damping Smartphone Case Market

Published:
Report ID: 68042

Active Power Filters Market

Published:
Report ID: 15883

Interactive Wound Dressing Market

Published:
Report ID: 62904

Interactive And Self-Service Kiosk Market

Published:
Report ID: 6956

Active and Modified Atmospheric Packaging Market

Published:
Report ID: 62126

Interactive Display Market

Published:
Report ID: 6962

Hypoactive Sexual Desire Disorder (HSDD) Treatment Market

Published:
Report ID: 5715

Turkey Industrial Design Market

Published:
Report ID: 69495

Indonesia Industrial Design Market

Published:
Report ID: 69382

Germany Industrial Design Market

Published:
Report ID: 69356

UAE Industrial Design Market

Published:
Report ID: 69210

Spain Industrial Design Market

Published:
Report ID: 69198

Mexico Industrial Design Market

Published:
Report ID: 69183

South Africa Industrial Design Market

Published:
Report ID: 68858

South Korea Industrial Design Market

Published:
Report ID: 68855

UK Industrial Design Market

Published:
Report ID: 68868

U.S. Industrial Design Market

Published:
Report ID: 68862

Russia Industrial Design Market

Published:
Report ID: 68549

Netherlands Industrial Design Market

Published:
Report ID: 68546

Purchase Options

The report comes as a view-only PDF document, optimized for individual clients. This version is recommended for personal digital use and does not allow printing.
$4699

To meet the needs of modern corporate teams, our report comes in two formats: a printable PDF and a data-rich Excel sheet. This package is optimized for internal analysis and multi-location access, making it an excellent choice for organizations with distributed workforce.
$5699

The report will be delivered in printable PDF format along with the report’s data Excel sheet. This license offers 100 Free Analyst hours where the client can utilize Credence Research Inc.’s research team. It is highly recommended for organizations seeking to execute short, customized research projects related to the scope of the purchased report.
$7699

Smallform of Sample request

Have a question?

User Profile

Don’t settle for less – trust Mitul to help you find the best solution.

Report delivery within 24 to 48 hours

– Other Info –

What people say?-

User Review

I am very impressed with the information in this report. The author clearly did their research when they came up with this product and it has already given me a lot of ideas.

Jana Schmidt
CEDAR CX Technologies

– Connect with us –

Phone

+91 6232 49 3207


support

24/7 Research Support


sales@credenceresearch.com

– Research Methodology –

Going beyond the basics: advanced techniques in research methodology

– Trusted By –

Pepshi, LG, Nestle
Motorola, Honeywell, Johnson and johnson
LG Chem, SIEMENS, Pfizer
Unilever, Samsonite, QIAGEN